Article Text

Abstract
Objective Neuropathological studies in amyotrophic lateral sclerosis (ALS) have shown a dissemination in a regional sequence in four anatomically defined patterns. The aim of this retrospective study was to see whether longitudinal diffusion tensor imaging (DTI) data support the pathological findings.
Methods The application of DTI analysis to fibre structures that are prone to be involved at each neuropathological pattern of ALS was performed in a monocentre sample of 67 patients with ALS and 31 controls that obtained at least one follow-up scan after a median of 6 months.
Results At the group level, longitudinal ALS data showed significant differences for the stage-related tract systems. At the individual level, 27% of the longitudinally scanned patients with ALS showed an increase in ALS stage, while the remaining were stable or were at the highest ALS stage. Longitudinal fractional anisotropy changes in the respective tract systems correlated significantly with the slope of the revised ALS functional rating scale.
Interpretation The DTI-based protocol was able to image the disease patterns of ALS in vivo cross-sectionally and longitudinally, in support of DTI as a technical marker to image ALS stages.
- amyotrophic lateral sclerosis
- diffusion tensor imaging
- biomarkers
This is an Open Access article distributed in accordance with the Creative Commons Attribution Non Commercial (CC BY-NC 4.0) license, which permits others to distribute, remix, adapt, build upon this work non-commercially, and license their derivative works on different terms, provided the original work is properly cited and the use is non-commercial. See: http://creativecommons.org/licenses/by-nc/4.0/
Statistics from Altmetric.com
Introduction
Investigations of the brain pathology of amyotrophic lateral sclerosis (ALS) based on phosphorylated 43 kDa TAR DNA-binding protein (pTDP-43) in postmortem studies have shown that ALS may disseminate in a regional sequence in four disease-related patterns.1–5 This sequential protein pathology in ALS initially spreads outwardly from the motor neocortex and towards the spinal cord and brainstem,6 and then to frontal, parietal and, ultimately, anteromedial temporal lobes.7
Recently, our group reported an in vivo imaging protocol using diffusion tensor imaging (DTI) for the quantification of the integrity of white matter tracts to address the issue of sequential disease spreading in ALS8; tracts were analysed that become involved during the course of ALS: the corticospinal tract (CST) (stage 1), the corticorubral and the corticopontine tracts (stage 2), the corticostriatal pathway (stage 3) and the proximal portion of the perforant path (stage 4). In DTI-based neuroimaging, the specific tract of interest (TOI)-based technique targeted to the individual analysis of predefined tract structures according to the propagation scheme, thus making it possible to image the disease stages in ALS in vivo in a given patient.8 Advantages of this neuroimaging technique are that the specific fibre tract structures could be analysed at the individual subject level, and that this analysis is hypothesis-driven, automated and unbiased. This in vivo approach to the ALS staging pattern was subsequently corroborated by the results of a multicentre DTI study at the group level.9
The aims of the current study were to validate the neuroimaging analysis of sequential ALS spreading8 in a larger study cohort and, based on this consistency, to extend the cross-sectional study to a longitudinal design based on the identical analysis techniques. The longitudinal database for the individual DTI-based staging analysis might provide progression markers by intra-individual shifts to higher stages. To this end, 649 DTI data sets (387 patients with ALS with 474 scans; 144 controls with 175 scans) from a single study site were studied, including longitudinal scans from 67 patients with ALS and 31 controls.
Methods
Subjects and clinical characterisation
The database consisted of 649 cross-sectional and longitudinal DTI data from patients with ALS (n=387) and controls (n=144) acquired at 1.5T (Magnetom Symphony, Siemens Medical, Erlangen, Germany; 479 scans from 382 subjects) or at 3.0 T (Allegra, Siemens Medical, Erlangen, Germany; 182 scans from 149 subjects). DTI scanning protocols are provided in online supplementary table 1.
Supplementary file 2
A total of 110 subjects (79 patients with ALS and 31 controls) obtained at least one follow-up scan. The interscan time intervals were in average 9 (±6) months, median 6 months, for the patients with ALS. Twelve follow-up scans of patients with ALS could not be analysed due to the presence of scanning artefacts or non-compliance with the scan protocol. Thus, 67 scans of patients with ALS remained for analysis, 16 patients with ALS obtained a second follow-up scan, two patients with ALS obtained a third follow-up scan and one patient with ALS obtained five follow-up scans (figure 1A). Baseline and follow-up scans of each subject were always obtained on the same scanner using the identical recording protocol.

Schematic overview of the data analysis workflow. (A) Schematic overview of subject distribution for 1.5 and 3.0 T for baseline and follow-up scans, respectively. (B) Control samples used for calculation of age correction (i), calculation of scanner correction matrices (ii) and for fibre tracking (iii). (C) Schematic representation of subject statistics for calculation of group averaged differences (i). (D) Scheme for longitudinal staging calculation (II) and for cross-sectional comparison (III).
All patients with ALS underwent standardised clinical-neurological and routine laboratory examinations. The patients with ALS (n=221 male, n=166 female, mean age 60±12 years) presented with a sporadic form of clinically definite or probable ALS according to the revised El Escorial diagnostic criteria.10 Severity of physical symptoms as measured with the revised ALS functional rating scale (ALS-FRS-R)11 was 39±7 (range 15–47). Disease duration was 20±18 months. For the patients with ALS who obtained a follow-up scan, ALS-FRS-R was 40±5 at baseline and 35±7 at follow-up; extrapolation of ALS-FRS-R reduction to a time period of 1 year resulted in an average ALS-FRS-R progression rate of 11 per year. None of the patients with ALS had a history of other neurological or psychiatric disorders. A normal database of age-matched healthy controls (n=74 male, n=70 female, p=0.24 compared with ALS; mean age 59±13 years, p=0.26 compared with ALS), that is, 78 controls at 1.5 T and 66 controls at 3.0 T, was used for comparison. None had a history of neurological or psychiatric disease. The interscan time intervals were in average 12(±7) months, median 7 months, for the controls. In both patients with ALS and controls, vascular brain alterations or inflammatory or neoplastic brain processes had been excluded by conventional MRI.
Data analysis
The DTI analysis software Tensor Imaging and Fiber Tracking (TIFT) was used for preprocessing and postprocessing.12 Prior to standardised preprocessing and postprocessing, DTI data underwent a quality control,13 eddy current correction and motion correction.9 11
Preprocessing of longitudinal data
In a first step, follow-up DTI data and baseline DTI data for each subject with follow-up scans were aligned by fitting of the (b=0)-volumes in order to perform consequent stereotaxic Montreal Neurological Institute (MNI) transformation of baseline and follow-up data with the identical parameters. For this task, baseline and follow-up data were aligned by halfway linear registration14 to avoid a bias of the baseline data (figure 1B,C).
Preprocessing—stereotaxic normalisation and harmonisation of fractional anisotropy maps from different protocols
In a second step, a non-linear spatial normalisation to the MNI stereotaxic standard space15 was performed in an iterative manner using study-specific templates for the DTI data from all patients and controls.16 Details of the normalisation procedure have been described previously.17 Fractional anisotropy (FA) maps of each data set were calculated and were smoothed with a Gaussian filter of 8 mm full-width-at-half-maximum. The filter size of 8 mm (which is about two to three times the recording voxel size, depending on the protocol) provides a good balance between sensitivity and specificity.18
Subgroups of 50 age-matched and gender-matched controls from each scanning protocol (1.5 and 3.0 T) were used for (i) calculation of the scanner differences19 and (ii) for calculation of the age dependency of the FA maps (figure 1B).
Preprocessing—fibre tracking and tractwise FA statistics
For the identification of the relevant pathways, an averaged DTI data set was calculated from 66 control data sets by arithmetic averaging of the MNI transformed data. This averaged control DTI data set was then used to identify pathways for defined brain structures according to the ALS-associated staging system2 8 20 with a seed-to-target approach: FA threshold was set at 0.2,21 FT was a modified deterministic streamline tracking approach,22 the Eigenvector scalar product threshold was set at 0.9, the regions of interest for the seed regions had a radius of 5 mm and the regions of interest for the target region had a radius of 10 mm. Seed and target coordinates of the respective tracts are summarised in online supplementary table 2. The CST (representing stage 1), the corticorubral and corticopontine tracts (representing stage 2), the corticostriatal pathway (representative of stage 3) and the proximal portion of the perforant path (representative of stage 4); the optic tract where no involvement in ALS-associated neurodegeneration could be anticipated was defined as a reference path.
Supplementary file 3
For quantification of the directionality of the underlying tract structures, the technique of tractwise fractional anisotropy statistics (TFAS16) was applied. To assess the axonal damage and myelin degradation for the predefined staging scheme, FA values were arithmetically averaged from fibre tracts that have been shown to become involved at a given stage of ALS; bihemispheric FA values of tracts were averaged. In order to validate the bihemispheric averaging, the FA values within the single tracts were compared for laterality, and this analysis showed no significant differences between the hemispheres for each pair of tracts.
Preprocessing—harmonisation of FA maps and pooling
FA maps of the different protocols from 1.5 and 3.0 T scanners were separately corrected for age according to the regression for age calculated from data sets of 50 controls from 1.5 and 3.0 T each (see the ‘Preprocessing—stereotaxic normalisation and harmonisation of FA maps from different protocols’ section).
FA maps of data from controls (50 data sets recorded at 1.5 T and 50 data sets recorded at 3.0 T—see the ‘Preprocessing—stereotaxic normalisation and harmonisation of FA maps from different protocols’ section) were used for calculation of three-dimensional (3D) correction matrices as previously reported.9 19 Then, FA maps of patients with ALS and controls that had been recorded at 3.0 T were harmonised to FA maps at 1.5 T by application of the respective 3D correction matrix (linear first-order correction).
Postprocessing—cross-sectional comparison at the group level
Age-corrected and scanner-corrected FA maps from baseline scans of 387 patients with ALS and 144 controls formed a unified FA map sample. For each FA map, mean FA values for the investigated tracts could be calculated (in conformance with the above-mentioned FA threshold of 0.2). Then, cross-sectional comparisons between patients with ALS and controls of mean FA values in the relevant respective tract structures were performed using the Student’s t-test (figure 1D).
Postprocessing—staging at the individual level
Staging categorisation was performed according to the published protocol.8 Separately for each tract structure, an FA threshold for discriminating between controls and pathology was defined at µ–0.47σ8; the thresholds for each tract are summarised in online supplementary table 3. Staging categorisation was performed for baseline scans and for follow-up scans using the identical categorisation scheme with the identical thresholds. Results for staging categorisation were obtained for each patient at the individual level.
Supplementary file 4
Postprocessing—longitudinal comparison at the group level
FA maps from 67 patients with ALS and 31 controls who had received at least one follow-up scan were analysed to calculate group-averaged differences in the staging-associated tract systems. Data from patients with ALS with more than one follow-up scan were analysed separately, and regression analysis was used to obtain one comprehensive result of all follow-up scans from one subject. Differences in FA values between baseline and follow-up in the pathways were linearly normalised to obtain an FA decrease slope, thus making it possible to arithmetically average differences between baseline and follow-up FA values for all patients with ALS and controls (figure 1C). By means of this approach, the results are independent of the normalisation timescale.
Postprocessing—whole brain-based voxelwise longitudinal comparison at the group level
Whole-brain-based spatial statistics (WBSS)9 17 was performed for the calculation of longitudinal difference FA maps. Differences in FA values were linearly normalised for each subject (patients with ALS and controls) to an identical time-interval prior to statistical comparison.
 (1)
(1)
The differences in FA values in each voxel were calculated for patients with ALS and controls; t1 and t2 are the date of baseline and follow-up scans, respectively. Statistical comparisons of ΔFA for 67 patients with ALS vs 31 controls were performed voxelwise by means of the Student’s t-test. Statistical results were corrected for multiple comparisons by use of the false discovery rate (FDR) algorithm at p<0.05.23 Further reduction of the alpha error was performed by a spatial correction algorithm that eliminated isolated voxels or small isolated groups of voxels in the size range of the smoothing kernel leading to a cluster size threshold of 256 voxels.
Correlation calculations
In order to investigate the decline of the ALS-FRS-R and the decline of FA values in the CST in the longitudinal observation, Pearson’s correlations were calculated.
Effect size and sample size calculations
Standardised effect size calculations were performed by
 (2)
(2)
The sample size calculations for future clinical studies were performed based on a two-sided significance level of 5% (group mean difference with p<0.05) and a power of 80%; then, a good approximation to calculate the minimum sample size S from the effect size E for a desired treatment effect t is given by
 (3)
(3)
Results
Differences in the tract systems at the group level
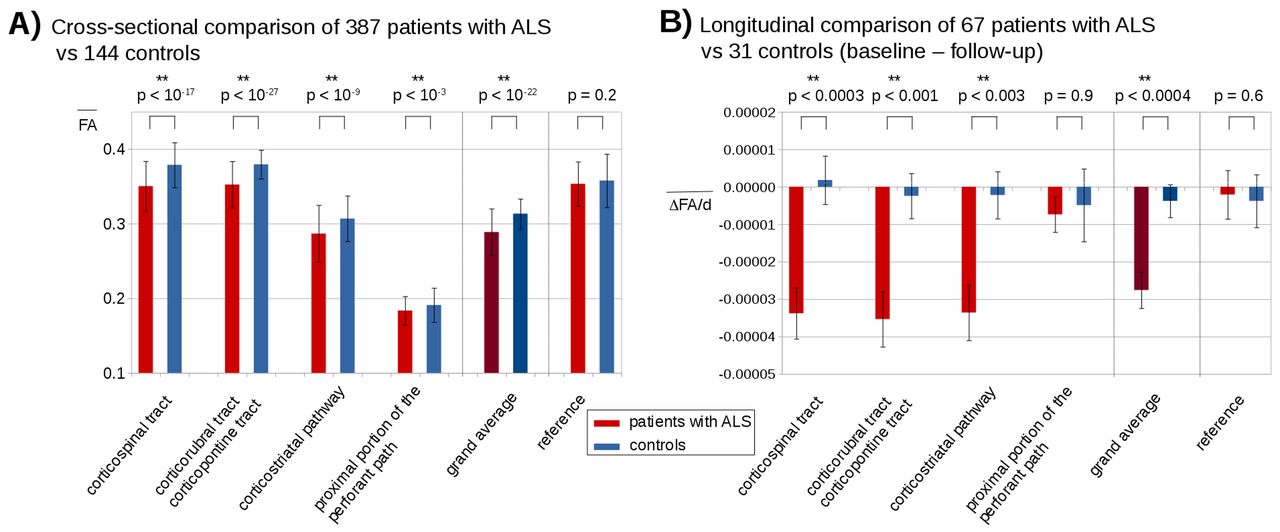
The comparison of the mean FA values for the investigated tracts obtained significant differences (p<0.0001, corrected for multiple comparisons) between patients with ALS and controls for all four tract systems, that is, the CST, the corticopontine and corticorubral tracts, the corticostriatal pathway and the proximal portion of the perforant path, and the grand average of all tract systems. No significant differences were found in the reference path (figure 2A).

Cross-sectional and longitudinal comparison of fractional anisotropy (FA) values in amyotrophic lateral sclerosis (ALS)-related tract systems. (A) Mean FA values of the baseline scans from 387 patients with ALS and 144 controls for different tract systems and p values for cross-sectional comparison. (B) Longitudinal mean FA decrease slope (ΔFA/d is the slope of FA decrease in units per day) of 67 patients with ALS and 31 controls between baseline and follow-up. Error bars are given as SE of the mean.
Whole-brain-based spatial statistics of longitudinal differences at the group level
WBSS was performed for longitudinal differences of 67 patients with ALS vs 31 controls at p<0.05, FDR corrected. Significant alterations were observed along the CST as well as in the frontal lobes (table 1). These significant longitudinal alterations were in accordance with the damage in the ALS-related TOIs (figure 3).

Whole-brain-based spatial statistics (WBSS) for longitudinal differences in patients with ALS vs controls. (A) Slice-wise representation and sagittal projectional view of significant (p<0.05, FDR corrected) longitudinal alterations of fractional anisotropy (FA) values. (B) Significant longitudinal alterations (calculated by WBSS of 67 patients with ALS vs 31 controls) and ALS-related tract structures. CST, corticospinal tract.
Cluster results of whole-brain-based spatial statistics of normed fractional anisotropy differences (thresholded at FDR corrected p<0.05). Only the main contributing areas are listed, while more anatomical structures are included in the cluster.
Longitudinal differences in the tract systems at the group level
The differences in mean FA values for the 67 patients with ALS with longitudinal data versus controls with longitudinal data were significant for the CST (p=0.00029), corticopontine and corticorubral tracts (p=0.00085), and the corticostriatal pathway (p=0.0034); the grand average of the four tract systems also reached significant at p=0.00028. No significances were found for the proximal portion of the perforant path and for the reference path (optic tract) (figure 2B).
Staging categorisation
From 144 controls' FA maps, the FA thresholds (µ–0.47σ) for the respective tracts were obtained as follows: CST: 0.365, corticopontine/corticorubral tracts: 0.370, corticostriatal pathway: 0.292 and proximal portion of the perforant path: 0.180. By applying the in vivo categorisation cascade,8 staging categorisation was performed for the baseline scans of 387 patients with ALS: 72% could be assigned to an ALS stage and were homogeneously distributed over the four stages (figure 4A).

Cross-sectional and longitudinal staging. (A) Staging distribution for 387 patients with ALS at baseline. (B) Staging distribution for 67 patients with ALS at baseline and at follow-up. Eighteen patients with ALS increased in staging categorisation during follow-up time interval. (C) Two individual examples for the longitudinal categorisation profile of patients with ALS into ALS stages based on deviations of z-transformed FA values.
Longitudinal staging was performed for 67 patients with ALS. Follow-up data allowed for a staging categorisation for 75% in which 49 patients with ALS remained stable. Of those, 16 patients with ALS were at ALS stage 4 and from the remaining 51 patients with ALS (ALS stages 1–3 or not stageable), 18 showed an increase in ALS stage (figure 4B).
Figure 4C shows exemplary individual longitudinal staging profiles for two subjects: in subject 1 the ALS stage increased from stage 1 to stage 2 within the first follow-up period of approximately 100 days; in subject 2 the ALS stage increased from stage 2 to stage 3 within the first follow-up period of approximately 100 days. Of note, it could be observed that the mean FA values for all stage-related tract systems in both individuals decreased during the follow-up periods.
Correlation of DTI staging with clinical scores
The decline of the revised ALS-FRS-R was reflected by the decline of FA values in the CST in the longitudinal observation. An example of a patient with ALS with four visits is provided in online supplementary figure 1A. For the whole baseline sample, FA values in the CST correlated with ALS-FRS-R (r=0.13, p=0.010). At baseline scan, ALS staging scores (n=272) correlated significantly with disease duration (r=0.13, p=0.032) and negatively with ALS-FRS-R (r=−0.19, p=0.0016) (see online supplementary figure 2), when the not-stageable patients (stage 0) were included, the correlation with disease duration was significant at r=0.15, p=0.0031 and the correlation with ALS-FRS-R was significant at r=−0.24, p<0.00001.
Supplementary file 1
Supplementary file 5
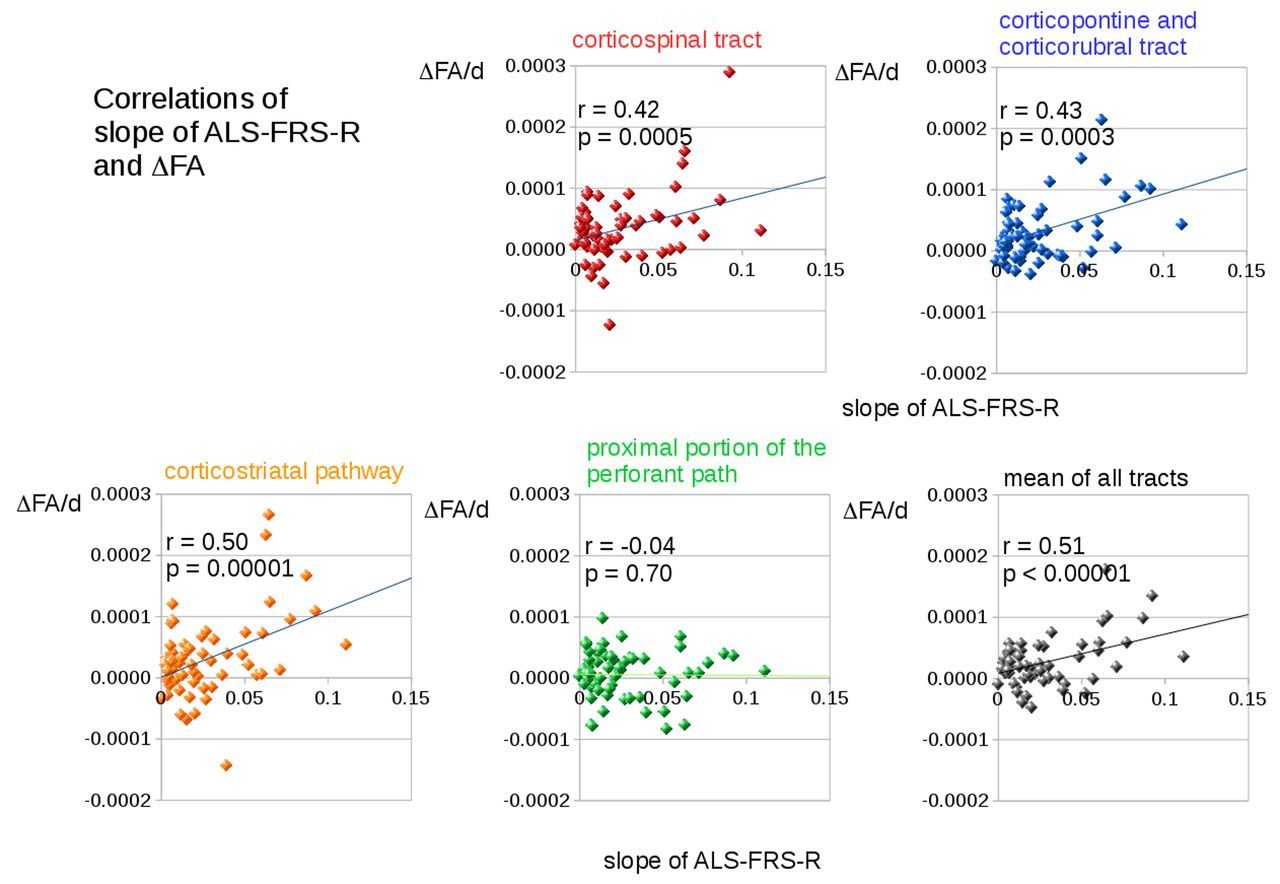
Significant correlations (corrected for multiple comparisons) between the slope of ALS-FRS-R and longitudinal changes in FA (FA decrease slope) (figure 5) were observed in the CST (related to ALS stage 1, r=0.42, p=0.00046), in the corticopontine and corticorubral tracts (related to ALS stage 2, r=0.43, p=0.00027), and in the corticostriatal pathway (related to ALS stage 3, r=0.50, p=0.000013). The mean longitudinal FA changes in all tract systems also correlated significantly with the ALS-FRS-R slope (r=0.51, p<0.00001). No significant correlations were found for the proximal portion of the perforant path (ALS stage 4) and for the reference tract.

Correlations of the slope of revised amyotrophic lateral sclerosis functional rating scale (ALS-FRS-R) and changes in fractional anisotropy (FA) in tract systems related to ALS stages. Significant correlations between the slope of ALS-FRS-R and longitudinal changes in FA (ΔFA/d is the slope of FA decrease in units per day) were found in the corticospinal tract (ALS stage 1, red), in the corticopontine and corticorubral tracts (ALS stage 2, blue), and in the corticostriatal pathway (ALS stage 3, orange). The mean longitudinal changes in FA in all tract systems also correlated significantly with the slope of ALS-FRS-R.
In addition, disease duration correlated highly significant (p<0.00001) with the mean longitudinal FA changes in all tract systems. Voxelwise correlation of FA differences (ΔFA) and ALS-FRS-R differences (ΔALS-FRS-R) was performed which demonstrated significant alterations in the CST (suupl.
Effect size calculations
The calculated effect size for FA progression in the CST was 0.70 and the calculated effect size for FA progression over all tract systems was also 0.70, while for the ALS-FRS-R progression rate, the calculated effect size was 0.84. Thus, for a 50% treatment effect, calculated sample sizes are 128 subjects per group for FA progression in the CST alone, 129 subjects per group for FA progression in all tract systems and 89 subjects per group for the ALS-FRS-R progression rate.
Discussion
This study used the DTI-based technique to investigate the brains of patients with ALS with respect to in vivo staging8 and showed that the TOI-based technique allows for individual classification in the largest study sample of patient with ALS MRI data reported to date. In this hypothesis-guided approach, the longitudinal assessment of the ALS-associated tract changes showed that it is possible to quantitatively map the DTI correlates of disease propagation in the brain. The regional sequence of four disease-related stages could be mapped in ALS with plausible results in cross-sectional design and with confirmation in longitudinal design. Both the clinical severity as assessed by the ALS-FRS-R and the disease duration correlated significantly with the resulting staging scheme.
The present study was carried out at a single centre. However, a multicentre extension is possible by harmonisation of the DTI data sets from different scanning protocols,19 as it has been shown in a previous DTI study in ALS with MRI data from eight study sites.9 In that recent multicentre study, the imaging correlates of the four neuropathologically defined patterns could also be identified using WBSS analysis of FA maps; the results confirmed the most significant alterations in the CST together with additional significant white matter tract changes in the frontal lobe, brainstem and hippocampal regions that correspond to these four postmortem neuropathological stages. In the current study, scans were obtained on two different MR scanners with different field strength so that data were harmonised. Thus, this study may also be interpreted as a pilot study for further large-scale multicentre studies. The combined analysis of data from scanners with different field strengths has been addressed in a previous study,8 in which no differences in results with regard to the field strength and scanning protocol could be observed.
Here, the longitudinal data analysis at the individual level demonstrated that a qualitative assignment to a given stage is possible and that FA changes in the respective tracts can be tracked quantitatively over time (figure 4C). It should be noted, however, that the clinical course and the clinical presentation and quality of life of patients with ALS is (and perhaps not even to a major degree) determined by the progression of the brain pathology, and by other developments, for example, progressive respiratory insufficiency. Nevertheless, although no data showing that baseline DTI is predictive of future clinical disease progression are available yet, longitudinal DTI-based in vivo staging changes in ALS are a potential candidate for individual patient stratification (with the current restrictions) by assigning an individual patient to a disease stage, and this technique potentially enlarges the spectrum of potential non-invasive biological markers in ALS. Within the context of patient care, in vivo assessment of the status quo of the cerebral propagation pattern as computer-based pathoanatomy could provide valuable information, given the significant correlation with severity of clinical symptoms (ALS-FRS-R). In addition, patient classification into a propagation pattern stage in vivo might increase awareness of clinical presentation beyond the classical motor phenotype: as one example, the assessment of the ALS-associated cerebral neurodegeneration in patients with isolated lower motor neuron presentation, would make it possible to diagnose these individuals as patients with ALS by this specific hypothesis-guided approach, as recently demonstrated in a sample of patients with the clinical presentation of lower motor neuron disease.20
These findings can be considered one way to confirm the sequential involvement of different central nervous system (CNS) regions in ALS as proposed by the human autopsy studies. Here, biomarkers are necessary that could make possible the in vivo mapping and monitoring of pathology spreading, for example, neuroimaging techniques can guide in identifying disease-specific lesion patterns and elucidating how these disorders spread across brain areas.24–26 MRI with the TOI technique could take this role, although the damage to white matter tracts can be identified per se by DTI, but cannot be identified in its nature.
To date, no disease-modifying therapy exists to interfere with propagation of proteins like TDP-43, but the template-directed replication followed by the cell-to-cell transmission of pathology-associated proteins provides a molecular pathway for the spread of neurodegenerative disease in the CNS and thus offers novel opportunities for therapeutic strategies to disrupt or delay the cascade of events.7 For future trials with such potentially disease-modifying agents, the DTI staging might allow for stratification of patient samples at the individual level with respect to disease stage, and quantitative stage-wise DTI mapping as a non-invasive tool to provide in vivo evidence for progressive expansion of white matter damage27–30 might be considered as a monitoring tool for disease progression.
This study is not without limitations. First, the DTI-based results have not been confirmed by postmortem pathology analyses, that is, the combination of the in vivo staging with postmortem classification in the same subjects was not available. Second, the patient number within the longitudinal data set was only about 20% of the cross-sectional data, which is a mirror of the progressively limited ability to perform the MRI studies in patients with ALS during the disease course. Furthermore, the sample sizes of the third and fourth follow-ups were smaller for the same reason, and this issue has an impact on the statistical power of the analysis. A further limitation of the methodology is that the tract corresponding to the fourth disease stage, that is, the proximal portion of the perforant path, is shorter than the other tracts that are involved during the first three stages. Due to the lower number of included voxels, TFAS of the perforant path includes a lower signal-to-noise-ratio of the results. A subset of approximately 25% patients with ALS could not be classified here for methodological reasons; this is technique-immanent because thresholds had to be defined for the differentiation between patients and controls in a data-driven approach, which implies that not all patients would be classifiable owing to an incomplete separation between patients with ALS and controls. For future studies as well as for longitudinal screening purposes, it is recommended to increase the number of individual follow-up scans, for example, with reduced interscan time intervals. Finally, the linear dependency of FA decline over time can only be a first approximation and could only be validated or improved by a more complex model by a frequent short-interval scanning for DTI/FA.
DTI is a truly quantitative technique and, therefore, suboptimal acquisition, processing and analysis approaches can affect the reliability of DTI-derived indices.31 32 As such, from a methodological point of view, a higher number of DTI scans for each subject would be desirable, both more than one scan (with subject repositioning) within a visit and also as many visits as possible. However, this was not possible in this large sample in order to minimise the strains of MRI scanning for the patients with ALS. For the analysis of DTI data, several techniques are possible such as tract-based spatial statistics TBSS.33 However, the present study was not intended to address advantages and limitations of various analysis techniques. Previous longitudinal MRI studies in ALS have already been applied to subject groups of heterogeneous sample size34–37; one recent longitudinal ALS-DTI-study was performed in 34 patients with ALS each with three visits and reported FA reduction in the CST.38
In conclusion, TOI-based DTI was successfully used to map the axonal loss over time in tract correlates of the spreading of pathology in ALS.5 The longitudinal data provided a progression marker by intraindividual shifts to higher stages and could assess rates of progression at the individual level and at the group level. Although imaging-based outcome measures are not yet accepted as primary end points in phase III trials, they might be of high relevance as candidates for read-out in longer efficacy studies or as secondary outcome measures in efficacy studies with a primary clinical read-out. Longitudinal ALS screening can be performed by clinical scores such as ALS-FRS-R as well as by imaging scores. The quick clinical measure ALS-FRS-R primarily reflects the motor-related condition of a patient with ALS, whereas among the imaging measures, DTI provides information about microstructural alterations. Each of the scores has limitations and advantages. Given that DTI does not provide more power in terms of effect size (and sample size) for detection of change over time compared with ALS-FRS-R, DTI-based scores may be an ’add-on' with a different target information to currently available scores for longitudinal screening. Thus, TOI-based FA mapping may be a candidate read-out for future disease-modifying strategies that target the transmission of TDP-43 in ALS.
Acknowledgments
Sonja Fuchs is thankfully acknowledged for her great help in the acquisition of MRI data.
References
Footnotes
JK and H-PM are shared first authorship.
Contributors JK and H-PM: study concept and design, data analysis and interpretation of data, study supervision, drafting of manuscript. KDT: interpretation of data, critical revision of manuscript for intellectual content. DL: data collection, interpretation of data, critical revision of manuscript for intellectual content. MG: data collection, interpretation of data, critical revision of manuscript for intellectual content. HB: interpretation of data, critical revision of manuscript for intellectual content. ACL: study supervision, interpretation of data, critical revision of manuscript for intellectual content. All authors report no disclosures.
Funding This study was supported by the German Research Foundation (Deutsche Forschungsgemeinschaft, DFG Grant Number LU 336/15-1) and the German Network for Motor Neuron Diseases (BMBF01GM1103A).
Competing interests None declared.
Patient consent Obtained.
Ethics approval All participating patients and controls provided written informed consent for the study according to institutional guidelines. The study was approved by the Ethical Committee of the University of Ulm (reference #19/12).
Provenance and peer review Not commissioned; externally peer reviewed.
Data sharing statement No additional unpublished data from the study are available.