Article Text

Abstract
Objective The 12-month (M), phase 3, double-blind, randomised TRANSFORMS study demonstrated significant benefits of fingolimod 0.5 or 1.25 mg over interferon β-1a (IFNβ-1a) in patients with relapsing–remitting multiple sclerosis. We report the results of long-term (up to 4.5 years) extension of TRANSFORMS.
Methods Patients randomised to fingolimod (0.5/1.25 mg) in the core phase continued the same dose (continuous-fingolimod) in the extension, whereas those on IFNβ-1a were re-randomised (1:1) to fingolimod (IFN-switch; IFN: 0.5/1.25 mg). Outcomes included annualised relapse rate (ARR), confirmed disability progression and MRI measures. Results are presented here for the continuous-fingolimod 0.5 mg and pooled IFN-switch groups.
Results Of the 1027 patients who entered the extension, 772 (75.2%) completed the study. From baseline to the end of the study (EOS), ARR in patients on continuous-fingolimod 0.5 mg was significantly lower than in the IFN-switch group (M0–EOS: 0.17 vs 0.27). After switching to fingolimod (M0–12 vs M13–EOS), patients initially treated with IFN had a 50% reduction in ARR (0.40 vs 0.20), reduced MRI activity and a lower rate of brain volume loss. In a post hoc analysis, the proportion of IFN-switch patients with no evidence of disease activity increased by approximately 50% in the first year after switching to fingolimod treatment (44.3% to 66.0%). The safety profile was consistent with that observed in the core phase.
Conclusions These results support a continued effect of long-term fingolimod therapy in maintaining a low rate of disease activity and sustained improved efficacy after switching from IFNβ-1a to fingolimod.
Clinical trial registration No NCT00340834.
This is an Open Access article distributed in accordance with the Creative Commons Attribution Non Commercial (CC BY-NC 4.0) license, which permits others to distribute, remix, adapt, build upon this work non-commercially, and license their derivative works on different terms, provided the original work is properly cited and the use is non-commercial. See: http://creativecommons.org/licenses/by-nc/4.0/
Statistics from Altmetric.com
Introduction
In the 12-month (M), double-blind phase of the TRANSFORMS study, fingolimod (0.5 or 1.25 mg once daily) significantly improved clinical and MRI outcomes, including brain atrophy, in comparison to an active comparator, intramuscular interferon β-1a (IFNβ-1a), in patients with relapsing–remitting multiple sclerosis (RRMS).1 Results from the first year of the TRANSFORMS extension showed sustained efficacy in patients who continued on fingolimod, whereas patients who switched from IFNβ-1a to fingolimod demonstrated improved outcomes.2 We report the full results of the TRANSFORMS extension study (EOS) comprising efficacy and safety data of up to 4.5 years of follow-up. In post hoc analyses, we compare patients who completed the study (completers) versus those who discontinued prematurely (non-completers), and explore the relation of first year clinical and MRI measures of disease activity with longer term outcomes.
Methods
Study design
The TRANSFORMS core study (ClinicalTrials.gov, number NCT00340834) was initiated in May 2006 at 172 clinical centres in 18 countries.1 A full list of sites and investigators is provided in the online supplementary material. Patients with RRMS (N=1292) were randomised to receive either 12 months of oral fingolimod treatment at a dose of 0.5 or 1.25 mg once a day, or IFNβ-1a 30 µg intramuscularly once a week.1 All patients who completed the core phase were offered participation in the extension phase (NCT00340834), which was double-blinded until the locking of the core phase, and dose-blinded until implementation of a protocol amendment in 2009, following Novartis’ decision to discontinue development of the 1.25 mg dose.2 Thereafter, all patients received open-label fingolimod 0.5 mg until the end of the extension phase (EOS), following the completion of which these patients had an option to enter a common extension study for participants of the fingolimod phase 2 and 3 programmes (LONGTERMS, NCT01281657).3 The last patient visit in the TRANSFORMS extension occurred in August 2011 when some patients had received fingolimod treatment for up to 4.5 years.
Patients
Of the 1123 patients, a total of 1027 (92%) completed the core phase and received treatment in the extension phase. Patients randomised to fingolimod in the core phase continued with the original dose (continuous-fingolimod 0.5 mg (n=356) or 1.25 mg (330) groups). Patients receiving IFNβ-1a in the core phase were re-randomised (1:1) to receive fingolimod 0.5 mg or 1.25 mg in a blinded manner (IFNβ-1a/fingolimod 0.5 mg (n=167) or IFNβ-1a/fingolimod 1.25 mg (174)). The eligibility criteria have been described previously.1 ,2 All patients provided written informed consent prior to study entry. The protocol was approved by the respective institutional review board, independent ethics committee or research ethics board of each centre. The study was conducted in accordance with the International Conference on Harmonization-Good Clinical Practice (ICH-GCP) guidelines and the principles of the Declaration of Helsinki.
Outcome measures and procedures
The methods of randomisation and masking for the core and extension phases were reported earlier.1 ,2 In the extension phase, patients were evaluated monthly until the M24 visit and every 3 months thereafter. We present the outcomes for those patients who received continuous therapy with fingolimod 0.5 mg, during both the core (M0–12) and extension (M13–EOS) phases. Owing to the low patient numbers in the IFN to fingolimod switch groups (IFN-switch 0.5 and 1.25 mg), we present pooled data for both the fingolimod doses (IFN-switch group) for efficacy outcomes. To avoid bias in data interpretation, adverse events (AEs) are presented for the continuous-fingolimod 0.5 mg and IFN-switch 0.5 mg groups. Safety outcomes of patients in the continuous-fingolimod 1.25 mg and IFN-switch 1.25 mg groups are presented in the online supplementary material.
The annualised relapse rate (ARR) was calculated based on the number of confirmed relapses (new, worsening or recurrent neurological symptoms lasting for at least 24 h in the absence of fever (<37.5°C) or infection) and total number of days in the study. Disability progression was evaluated using changes in the Expanded Disability Status Scale (EDSS) and the Multiple Sclerosis Functional Composite (MSFC) scores. Disability progression was defined as either a 1-point increase in the EDSS score for patients with an EDSS score of 0 to 5.0 or a half-point increase for patients with a baseline score of ≥5.5, which was confirmed at 3 and 6 months. MRI measures of efficacy included the number of new/newly enlarged T2 lesions, gadolinium-enhanced (Gd+) T1 lesion count and per cent brain volume change (PBVC) measured by the Structural Image Evaluation, using Normalisation, of Atrophy (SIENA) methodology. All patients underwent MRI at screening, and then annually with central reading at the Image Analysis Centre (Amsterdam, The Netherlands).
Safety assessments included recording of all AEs and serious AEs (SAEs) with monitoring of haematology, blood chemistry and urine values; physical examinations and vital signs; ECG; monitoring following first dose administration of fingolimod; ophthalmological assessments; pulmonary function tests; and dermatological examinations.
Post hoc efficacy analysis included assessment of ARR up to M48 for completers versus non-completers of the study. For non-completers, ARR was calculated up to the point of discontinuation and is reported by interval. The interval for non-completers, M0–24, summarises the aggregate ARR from M0 to M24 for patients who discontinued during the interval of M12–24. Similarly, the intervals of M0–36 and M0–48 summarise the aggregate ARR for patients who discontinued during the intervals of M24–36 and M36–48, respectively.
To assess the impact of fingolimod treatment on disease activity over time, an exploratory analysis, using a model similar to that developed by Rio et al,4 was performed. The presence (positive) or absence (negative) of measures of disease activity such as confirmed relapses, sum of active MRI lesions (defined as the sum of new/newly enlarged T2 lesions and Gd+ T1 lesions at M12 that was >2 compared with baseline) or 3-month confirmed disability progression, during the TRANSFORMS core phase, was related to clinical outcomes over the duration of the extension phase (M13–EOS). All patients were classified into four groups based on the number of positive measures for disease activity during year 1 (no positive, 1, 2 or 3 positives). Furthermore, the proportions of patients with no evidence of disease activity (NEDA, defined as no relapses, no 3-month disability progression and no MRI activity) were calculated for years 1 and 2 to evaluate the impact of fingolimod treatment 1 year after the switch from IFNβ-1a.
Odds ratios (ORs), computed by logistic regression, were generated to evaluate the association between disease status after 1 year of treatment and clinical NEDA outcomes (defined as no relapses and no 6-month disability progression) during the extension phase (M13–EOS). Firth's penalised likelihood method was used to improve the reliability of the estimates because of the small number of patients in some subgroups. Detailed definitions are presented in the online supplementary data. Data for both the fingolimod dose groups (0.5 and 1.25 mg) were pooled for this analysis.
Statistical analysis
The baseline of the extension phase was defined as the last assessment made before the administration of the first dose of study medication in the extension phase. Methods for the analysis of relapse, disability progression and MRI variables (new/newly enlarging T2 lesions, Gd+ T1 lesions, mean PBVC) have been presented elsewhere.1 ,2 Between-group analyses were performed on the core intention-to-treat population for the continuous-fingolimod 0.5 mg versus IFN-switch groups; all p values were based on the two-sided tests and statistical significance was set at the 0.05 level with no adjustment for multiplicity. Descriptive statistics were used to present baseline demographic data.
Results
The extension phase baseline patient demographics and disease characteristics are presented in table 1. Of the 1027 patients who received treatment in the TRANSFORMS extension, 772 (75.2%) completed the extension phase (figure 1). The mean (median) time-on-study for the treatment groups was: continuous-fingolimod 0.5 mg—1083 (1282) days; continuous-fingolimod 1.25 mg—1015 (1273) days; IFN-switch—1012 (1271) days. At the time of study closure, the number (%) of patients completing 24, 36 and at least 48 months were 882 (86%), 841 (82%) and 103 (10%), respectively. Such a small number of completers at the M48 time point is attributed to the transfer of patients to the umbrella extension phase or commercial availability of fingolimod past M36 of the study. The most common reasons for study discontinuation (pooled study population) were withdrawal of consent (8.2%) and AEs (6.7%).
Baseline demographics and MS disease characteristics

Patient disposition.
Clinical outcomes
Patients in the continuous-fingolimod group who received treatment for up to 4.5 years demonstrated significantly lower ARR compared with those in the IFN-switch group (M0–EOS: 0.17 vs 0.27), with an associated 35% reduction in the risk of relapse (HR=0.65; p<0.001; figure 2). Within-group comparisons in the IFN-switch group (M0–12 vs M13–EOS) showed a reduction in ARR from 0.40 to 0.20 after patients switched to fingolimod. In the continuous-fingolimod group, the low relapse rate during the extension phase (M13–EOS: 0.16) was comparable with that observed in the core phase (M0–M12: 0.19; table 2).
Between-group comparisons of clinical and MRI outcomes

Time to first confirmed relapse up to the end of the study (core intent to treat (ITT) population).
The post hoc analysis indicated that ARR of the non-completers was higher than that of the completers of the comparable intervals (figure 3), especially in the IFN-switch group. Non-completers of the continuous-fingolimod group showed lower ARR in comparison with non-completers of the IFN-switch group.

Annualised relapse rate of completers versus non-completers over time. *Number of patients who completed the study during M36–48. #Interval non-completers are patients who did not continue to the next yearly time interval. For interval non-completers, M0–24 summarises the aggregate ARR from M0 to M24 for patients who discontinued during the interval of M12–24. M0–36 summarises the aggregate ARR from M0 to M36 for patients who discontinued during the interval of M24–36. M0–48 summarises the aggregate ARR from M0 to M48 for patients who discontinued during the interval of M36–48. ARR, annualised relapse rate; IFN, interferon; M, month.
HRs for confirmed disability progression were not statistically different at EOS in the continuous-fingolimod versus the IFN-switch group (HR (CI) 3-month confirmed disability progression, 0.94 (0.71 to 1.26), p=0.687; 6-month confirmed disability progression, 1.08 (0.77 to 1.51), p=0.674). Mean (SD) change in EDSS scores or in MSFC z-scores from core baseline to EOS was 0.16 (1.09) versus 0.12 (1.07), p=0.580 and 0.07 (0.45) vs 0.08 (0.44), p=0.314 in the continuous-fingolimod versus IFN-switch group.
MRI outcomes
New/newly enlarging T2 lesion counts remained low in the continuous-fingolimod group throughout the extension phase (table 2). During M12–24 in the IFN-switch group, the T2 lesion count decreased by 63% and remained low throughout the extension phase. The percentage of patients free of new/newly enlarging T2 lesions between the groups was similar throughout the extension study (M12–EOS: continuous-fingolimod group: 42%; IFN-switch group: 45%; p=0.63).
In the IFN-switch group, the mean number of Gd+ T1 lesions decreased from 0.5 at M12 to 0.2 at M24 and was 0.4 at EOS. In the continuous-fingolimod group, the mean Gd+ T1 lesion count was 0.2 at M12 and 0.3 at EOS. Throughout the extension phase, the percentage of patients free of Gd+ T1 lesions was 75% in the continuous-fingolimod group and 77% in the IFN-switch group (p=0.508).
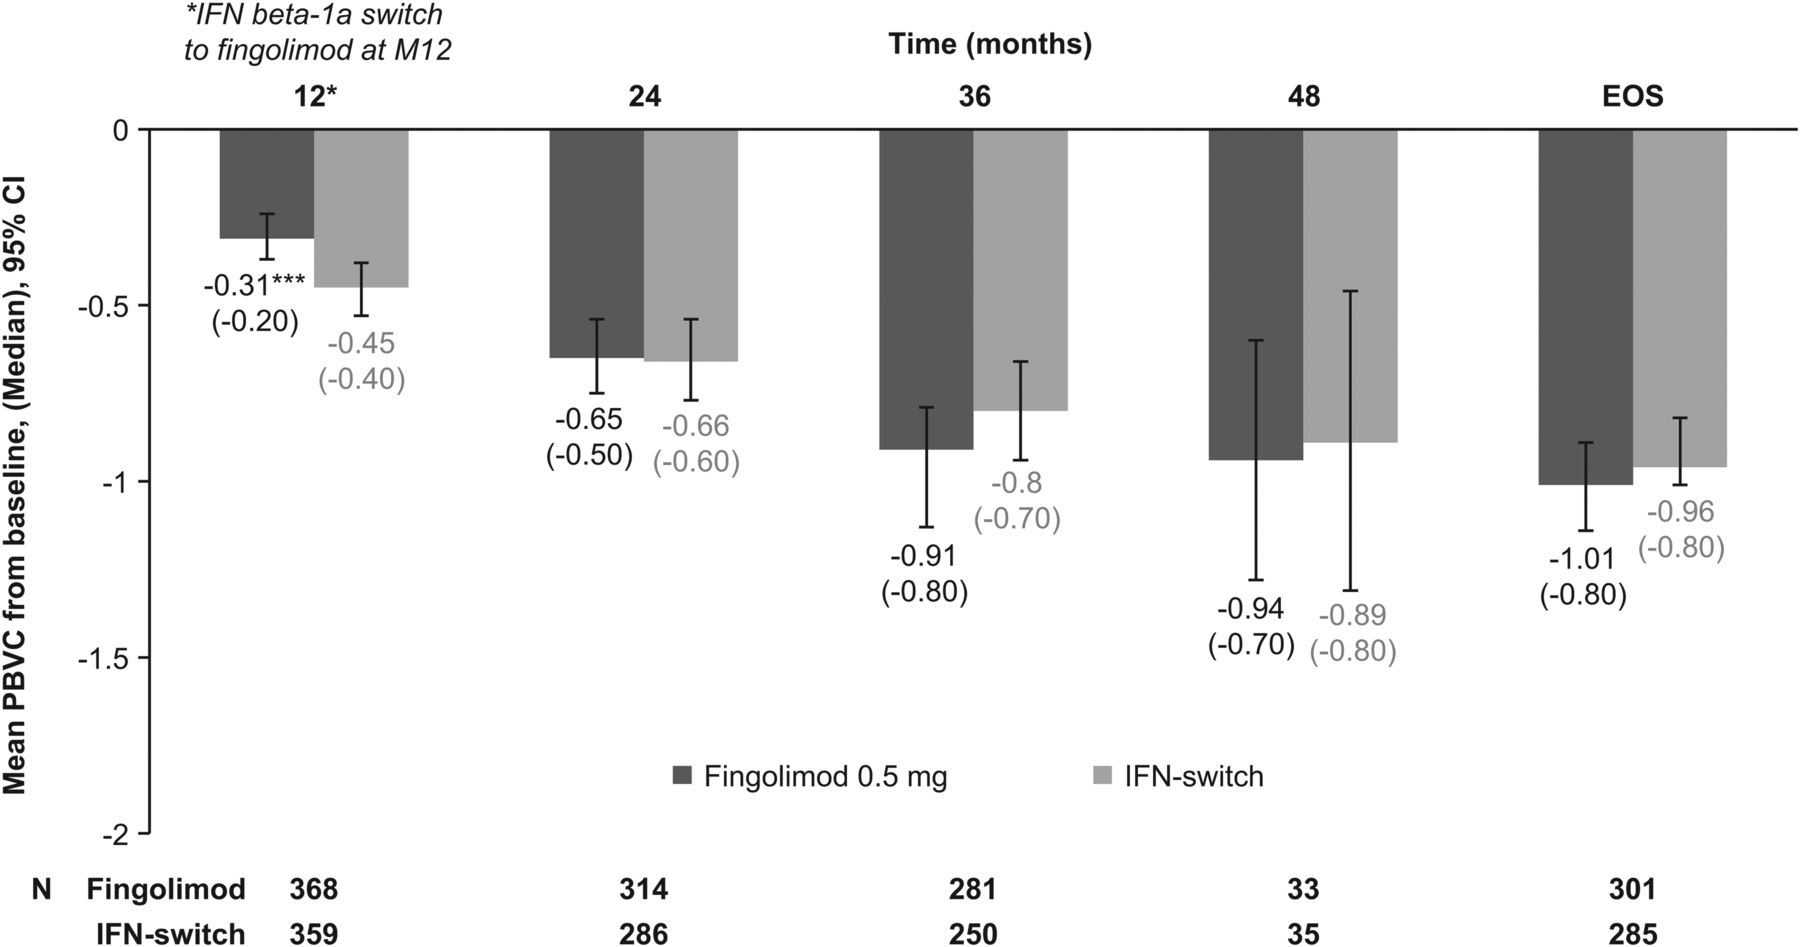
The PBVC from baseline to M12 was reduced significantly by fingolimod relative to IFNβ-1a, and the low rate was maintained through the EOS until the study completion (figure 4). Patients in the IFN-switch group experienced a slowing down in the rate of brain volume loss. Mean (median) PBVC from core baseline to EOS was −1.01% (−0.8) for continuous-fingolimod and −0.96% (−0.8); p=0.937 for the IFN-switch group.

Between-group comparison of cumulative PBVC from core baseline. ***p<0.001 for fingolimod versus IFN-switch; 2-sided statistical significance at 0.05 level. EOS, end of study; IFN, interferon; PBVC, per cent brain volume change; M, month.
Assessment of disease activity over time
Data evaluating the relation between disease activity during year 1 and clinical activity (relapses and 6-month disability progression) during the extension phase were available from 924 patients (continuous-fingolimod group (n=628, 68%) and IFN-switch group (n=296, 32%)). At the end of the 12-month core phase, 63.4% of patients treated with fingolimod 0.5 mg had NEDA compared with 44.3% of those treated with IFNβ-1a. At the end of year 2 (M24) and after a year of treatment with fingolimod, the proportion of patients showing NEDA increased in the IFN-switch group to 66% (figure 5A). In the continuous-fingolimod group, proportions of patients with NEDA did not differ at the end of year 2 versus 1 (69% vs 63.4%, figure 5B). Patients who were active on only one MS disease measure (either MRI or relapses or EDSS) in the core phase (M0–12) had the highest odds of being free of clinical disease activity in the extension phase (M13–EOS) (see online supplementary table S1).

Comparison of NEDA status in the core study and the first extension year by treatment group (A) IFN-switch group (B) Continuous-fingolimod group. Data presented here are for the pooled fingolimod 0.5 and 1.25 mg groups. N, total number of patients in the group; n, number of patients achieving NEDA; IFN, interferon; NEDA, no evidence of disease activity.
Safety outcomes
The safety population comprised 1027 patients. We compare the safety data of patients who were exposed to fingolimod 0.5 mg during the extension phase: continuous-fingolimod 0.5 mg (n=356) and IFN-switch 0.5 mg groups (n=167). Data for fingolimod 1.25 mg and the IFN-switch 1.25 mg groups are provided in the online supplementary table S2. The overall mean (±SD) duration of exposure to fingolimod (including the core phase) was 1216.5±281.2 days in the continuous-fingolimod 0.5 mg and 787.2±330.5 days in the IFN-switch 0.5 mg groups.
The most frequently reported AEs (>10% of patients) during the extension phase (M13–EOS) are summarised in table 3. The highest incidence in these groups was reported for nasopharyngitis, lymphocyte count decrease and headache. The majority of AEs (775/971, 79.8%) were mild to moderate in severity.
AEs in 10% or more patients (A), and SAEs in two or more patients (B) in the extension phase (M13–EOS)
SAEs were reported for 15.4% of patients in the continuous-fingolimod group, and for 12.6% in the IFN-switch group (table 3). The most common SAEs in both groups were basal cell carcinoma and MS relapse. Severe infection AEs were reported in 14 patients (3.9%) in the continuous-fingolimod group and six patients (3.6%) in the IFN-switch group. Herpes viral infections were reported in 36 (10.1%) patients in the continuous-fingolimod group and 25 (15%) patients in the IFN-switch group. In the IFN-switch group, one case of disseminated herpes zoster was reported on extension day 194. The patient recovered completely within 9 days following drug discontinuation and treatment with acyclovir. No confirmed cases of macular oedema were reported. One case of complete AV block occurred in a patient who switched from IFN to 1.25 mg fingolimod, and has been reported earlier.2
The proportion of patients who discontinued the study because of AEs was similar between the treatment groups (8.4% in the continuous-fingolimod group, 7.8% in the IFN-switch group), mostly due to an increase in liver enzymes by >5-fold of the upper limit of normal. Two patients formally met Hy's law criteria5 for hepatotoxicity and discontinued the study, one in the continuous-fingolimod 0.5 mg group who had a history of Gilbert syndrome and had elevated bilirubin before receiving the study medication, and the other in the IFN-switch fingolimod 1.25 mg group who developed jaundice and splenomegaly while in the study and was subsequently diagnosed with hepatitis E infection.
Basal cell carcinoma and lymphopenia (lymphocyte count below 0.2×10⁹/L or 200 cells/mm3; 9 patients each) were the other most common AEs leading to study discontinuation in the overall population. One patient in the IFN-switch fingolimod 0.5 mg group committed suicide, accounting for the one death reported in the extension phase. Apart from the seven cases of basal cell carcinoma, one case each of squamous cell carcinoma of the skin, thyroid cancer, anal neoplasm, ovarian epithelial cancer and non-melanoma skin cancer and two cases of breast cancer were reported in the continuous-fingolimod group. No malignancy was reported in the IFN-switch group other than the one case of basal cell carcinoma.
Discussion
These results from the extension phase of the TRANSFORMS study support a sustained effect of fingolimod on disease activity in patients with RRMS who received up to 4.5 years of therapy and are consistent with the findings of the core study and the first year of the extension study.1 ,2 A comparison between the originally randomised groups shows that over the entire study, a treatment difference in favour of the continuous-fingolimod group for ARR was observed over the IFN-switch group, indicating that the earlier start of fingolimod treatment had an overall stronger impact on the control of clinical disease activity. Both disability progression and MRI outcomes reflecting cumulative changes at the end of the extension phase were not significantly different between the groups, which is not surprising given that both groups received fingolimod for a considerable length of time as compared to the 1 year core study. ARR and MRI outcomes were clearly improved in the IFN group after switching to fingolimod, but due to the lack of an external control group we cannot exclude some influence of regression to the mean, as disease activity has a natural tendency to decrease over time, especially in patients with more active disease prior to baseline.6 The low rate of BVL during the extension study in the continuous-fingolimod group is in line with observations from the extension of the placebo-controlled FREEDOMS study7 and further supports a continuous effect of fingolimod on this outcome. The pronounced reduction, by approximately 50%, of BVL observed in the IFN-switch patients in the first year after the switch to fingolimod adds to the discussion about IFNβ-induced ‘pseudoatrophy’ but does not allow for definitive conclusions.2
Given the long duration of the study, it was important to evaluate if the treatment effect among the dropouts was lower, potentially introducing a responder bias. Indeed, patients who discontinued the study tended to have a higher disease activity while on study and compared with completers. However, within the subgroup of non-completers, patients who were initially randomised to fingolimod had a lower ARR than those who had been randomised to IFNβ-1a in the core study, confirming the benefits of earlier fingolimod treatment regarding relapse control.
Absence of evidence of disease activity defined by MRI and clinical measures (NEDA) is increasingly used to capture treatment benefits.8 In the 12-month TRANSFORMS core study, the proportion of patients with NEDA, defined as no evidence of new MRI lesions, relapses and 3-month confirmed disability progression, was significantly higher in the fingolimod 0.5 mg group than in the IFNβ-1a group (46% vs 34%, p<0.001).9 Persisting disease activity as depicted by such clinical and MRI outcomes in the first year of treatment has been shown to be predictive of later disease activity and worsening, especially with IFNβ treatment.4 ,10–12 Irrespective of the initial treatment allocation, in our study, patients with disease activity during the first year of therapy were more likely to have relapses and disability progression over the extension phase, and this risk increased with the number of measures indicating disease activity during year 1. Overall, our findings support the value of the NEDA criteria in the first year of treatment for the prognosis of longer term outcomes. It remains to be shown in long-term follow-up studies8 if the achievement of NEDA in the first year after switching treatment from IFNβ to fingolimod, as observed in our study, has the same positive prognostic value.
The safety profile of continuous fingolimod treatment for up to 4.5 years was consistent with the previous reports.1 ,13–17 Transient effects on heart rate at treatment initiation and effects on liver function were noted, while the absence of confirmed cases of macular oedema may be due to the small number of newly exposed patients in the extension phase (n=167). The incidence of herpes viral infections was similar across the treatment groups. We noted an imbalance in the incidence of cancer between the groups. However, in a pooled analysis comprising 3553 patients treated with fingolimod in the core and extension studies, the incidence of basal cell carcinoma with fingolimod 0.5 mg was 1.8%, and the total incidence was 1.5% (Novartis, data on file); our results show comparable frequencies of basal cell carcinoma (2% for the continuous-fingolimod 0.5 mg group) and a low incidence of other cancer types (<0.6%). These results also indicate that the safety monitoring described in the fingolimod prescribing information should be adhered to in clinical practice throughout the duration of fingolimod treatment.
Limitations for this extension study include the absence of a control arm and a potential selection bias typically seen in long-term studies, in which patients who are not doing well are more likely to drop out. Data beyond 36 months are sparse and could possibly limit meaningful conclusions to be drawn beyond this time point. The lower number of patients at the 48-month assessment is mainly driven by the transitioning of these patients into the fingolimod long-term safety and efficacy study (LONGTERMS). Despite these inherent limitations, our findings together with those from the TRANSFORMS core study1 and its 1-year extension2 further support sustained benefits of fingolimod on relapses and MRI inflammatory activity in continuously treated and IFN-switch patients.
Acknowledgments
The authors thank the patients and investigators who took part in this study. They also gratefully acknowledge Elena Korneyeva (formerly of Novartis Pharmaceuticals) for a scientific and medical review of the first draft of the manuscript; Anupama Shrinivasan for medical writing assistance in developing the first draft of the manuscript as per the authors’ directions; Uma Kundu for assistance in revising the draft as per comments received from the authors and preparing the submission package; and LeeAnne Carroll and Brigitte Weisshaar (all Medical Communications, Novartis Pharma) for coordinating the authors’ reviews.
References
Supplementary materials
Supplementary Data
This web only file has been produced by the BMJ Publishing Group from an electronic file supplied by the author(s) and has not been edited for content.
- Data supplement 1 - Online supplement
Footnotes
Contributors The steering committee (JAC, BK, FB, GC, H-PH, XM, JP and LK) collaborated with the sponsor to design the study and monitor its conduct. All authors were involved in the discussion and interpretation of the data and in the discussion and critical review of the paper.
Funding The study was funded by Novartis Pharma AG.
Competing interests JAC (EMD Serono, Genentech, Genzyme, Innate Immunotherapeutics, Novartis, Vaccinex), BK (Bayer, Biogen Idec, Caridian, Novartis, Pfizer, Serono, Teva), FB (Bayer Schering Pharma, Biogen Idec, Janssen Research, Lundbeck, Merck Serono, Novartis, Roche, Sanofi-Aventis, Serono Symposia Foundation, Synthon BV, UCB), GC (Bayer Schering Pharma, Biogen Dompé, Merck Serono International, Novartis, Sanofi-Aventis, Serono Symposia International Foundation, Teva), H-PH (Bayer Healthcare, Biogen Idec, Genzyme, Merck Serono, Novartis, Sanofi-Aventis, Teva), XM (Bayer, Schering, Biogen Idec, EMD Merck Serono, Genentech, Genzyme, Novartis, Sanofi-Aventis, Teva), JP (Bayer Schering Pharma, Biogen Idec, Merck Serono, Novartis, Sanofi-Aventis, Teva) have received payment for serving as consultants or speakers, or they or the institutions they work for have received research support from the companies indicated. TS, SR and DT are employees of Novartis Pharmaceuticals Corporation or Novartis Pharma AG and hold stock or stock options in Novartis. PvR was an employee of Novartis Pharma AG during the trial conduct, data analysis and manuscript preparation, and is currently an employee of Biogen Idec. LK no personal payments /compensation. The University Hospital Basel received in the last 3 years and used exclusively for research support: steering committee, advisory board and consultancy fees (Actelion, Addex, Bayer Health Care, Biogen, Biotica, Genzyme, Lilly, Merck, Mitsubishi, Novartis, Ono Pharma, Pfizer, Sanofi-Aventis, Santhera, Siemens, Teva, UCB, Xenoport); speaker fees (Bayer Health Care, Biogen, Merck, Novartis, Sanofi-Aventis, Teva ); support of educational activities (Bayer Health Care, Biogen, CSL Behring, Genzyme, Merck, Novartis, Sanofi, Teva); royalties (Neurostatus Systems GmbH); grants (Bayer Health Care, Biogen, Merck, Novartis, Roche, Swiss MS Society, the Swiss National Research Foundation, the European Union, Roche Research Foundations).
Patient consent Obtained.
Ethics approval The protocol was approved by the respective Institutional Review Board, Independent Ethics Committee or Research Ethics Board of each centre.
Provenance and peer review Not commissioned; externally peer reviewed.