Article Text

Abstract
Background Deep brain stimulation (DBS) can be an effective therapy for tics and comorbidities in select cases of severe, treatment-refractory Tourette syndrome (TS). Clinical responses remain variable across patients, which may be attributed to differences in the location of the neuroanatomical regions being stimulated. We evaluated active contact locations and regions of stimulation across a large cohort of patients with TS in an effort to guide future targeting.
Methods We collected retrospective clinical data and imaging from 13 international sites on 123 patients. We assessed the effects of DBS over time in 110 patients who were implanted in the centromedial (CM) thalamus (n=51), globus pallidus internus (GPi) (n=47), nucleus accumbens/anterior limb of the internal capsule (n=4) or a combination of targets (n=8). Contact locations (n=70 patients) and volumes of tissue activated (n=63 patients) were coregistered to create probabilistic stimulation atlases.
Results Tics and obsessive–compulsive behaviour (OCB) significantly improved over time (p<0.01), and there were no significant differences across brain targets (p>0.05). The median time was 13 months to reach a 40% improvement in tics, and there were no significant differences across targets (p=0.84), presence of OCB (p=0.09) or age at implantation (p=0.08). Active contacts were generally clustered near the target nuclei, with some variability that may reflect differences in targeting protocols, lead models and contact configurations. There were regions within and surrounding GPi and CM thalamus that improved tics for some patients but were ineffective for others. Regions within, superior or medial to GPi were associated with a greater improvement in OCB than regions inferior to GPi.
Conclusion The results collectively indicate that DBS may improve tics and OCB, the effects may develop over several months, and stimulation locations relative to structural anatomy alone may not predict response. This study was the first to visualise and evaluate the regions of stimulation across a large cohort of patients with TS to generate new hypotheses about potential targets for improving tics and comorbidities.
- neuromodulation
- thalamus
- globus pallidus
- tics
- obsessive-compulsive behavior
This is an open access article distributed in accordance with the Creative Commons Attribution Non Commercial (CC BY-NC 4.0) license, which permits others to distribute, remix, adapt, build upon this work non-commercially, and license their derivative works on different terms, provided the original work is properly cited, appropriate credit is given, any changes made indicated, and the use is non-commercial. See: http://creativecommons.org/licenses/by-nc/4.0/.
Statistics from Altmetric.com
Introduction
Tourette syndrome (TS) is a neurodevelopmental disorder characterised by chronic tics, which are spontaneous involuntary movements and vocalisations.1 TS symptoms typically present at 5–7 years of age, and symptoms can be detrimental to social, emotional, academic and professional development.2 3 An estimated 85.7% of patients with TS are diagnosed with one or more comorbid neuropsychiatric disorders, such as obsessive–compulsive behaviour or disorder (OCB/OCD), attention deficit hyperactivity disorder, depression and anxiety.4 5 The underlying pathophysiology of TS is unclear, but it is thought that aberrant neural activity disrupts normal corticostriatal-thalamocortical (CSTC) network function, thereby reducing the inhibition of somatosensory urges and movements.6–10 Cognitive behavioural therapies and pharmacological interventions are generally the first treatment approach and are effective in managing TS symptoms in most patients.11–14 A small proportion of patients experience severe, disabling tics that do not respond to conventional treatment and may be eligible for surgical interventions, such as deep brain stimulation (DBS).15 16 DBS has been performed in over 150 patients with TS worldwide since the first case was reported in 1999.17 18 Several open-label trials and a few randomised controlled trials collectively indicate that DBS is potentially effective in improving tics and comorbidities in select patients with severe, treatment-refractory symptoms.19–40
Several nuclei connected within the CSTC network have been explored as potential targets for TS DBS. Modulation of the CSTC network with DBS aims to restore normal function and improve TS and comorbidities. Nine different brain areas have been targeted thus far, including four located in the centromedial (CM) thalamus: the centromedian nucleus-parafascicular complex-substantia periventricularis-ventro-oralis internus (CMn-Pf-Spv-Voi) intersection,19 35 41 42 2 mm anterior to the CMn-Pf-Spv-Voi region,36 37 CMn,20 38 and the ventral anterior/ventrolateral motor regions of the thalamus.33 Other targets include the anteromedial globus pallidus internus (amGPi), the posteroventral GPi (pvGPi) and the globus pallidus externus (GPe).21–23 29 37 39 40 43–46 The nucleus accumbens and the anterior limb of the internal capsule (NA/ALIC) were first established as targets for the treatment of OCD but have also been used as targets for DBS in patients with TS.37 47–49 Finally, one patient suffering from tics and Parkinson’s disease was reported to improve following DBS of the subthalamic nucleus.50
The optimal DBS target for reducing tics and comorbidities in patients with TS is a long-standing debate in the field. Previous studies have suggested that improvement in TS severity did not significantly differ across amGPi, pvGPi, GPe and regions of the CM thalamus.18 20 38 51 However, an important distinction to make is that in each patient, the reported general target region or anatomical coordinates are not necessarily the same as the actual stimulation target. Rather, the stimulation target for each patient is formed by the unique combination of the DBS electrode placement (as identified in postoperative imaging), the parameters of the applied stimulation (active contact(s), frequency, voltage and pulse width) and the spatiotemporal effects of the stimulation on the surrounding neural structures.52–54 There has not yet been a systematic comparison of stimulation targets across a cohort of TS DBS patients in a common neuroanatomical space. As a result, it is unknown how much variability there is in the stimulation targets across patients with TS who have been implanted with DBS or if there are specific neuroanatomical regions that most effectively improve TS or its associated comorbidities. Analyses of the electrode placement and regions of stimulation are important for understanding which brain regions either maximise the benefit or produce undesired effects during DBS for TS in order to guide future targeting approaches.
A potential approach to identify anatomical regions that may predict the effects of DBS in patients with TS is to coregister patient-specific electrode locations, computational models of the volume of tissue activated (VTA) and associated clinical outcome scores into a common neuroanatomical space to create probabilistic stimulation atlases (PSAs).52 55 PSAs have been used to identify anatomical regions that may predict the therapeutic response or side effects during DBS for the treatment of Parkinson’s disease, essential tremor, epilepsy and other disorders.55–60 These methods require high-quality preoperative and postoperative imaging, stimulation settings, and pre-DBS and post-DBS clinical outcomes data for each patient. Additionally, curating a retrospective data set for PSA analyses requires careful processing and integration of heterogeneous data often from multiple clinic sites, which has not yet been undertaken for a large cohort of patients with TS receiving DBS therapy. Implementing these approaches would be an important step towards generating new hypotheses about how the current targeting methods can be improved in order to produce the best therapeutic outcomes in TS DBS patients.
The goal of this study was to create PSAs in order characterise how DBS has been applied in patients with TS so far and to investigate whether there are specific regions that are potentially effective in managing tics and comorbidities in order to better predict patient response. In collaboration with the International TS DBS Database and Registry, we have assembled the first retrospective data set on 123 patients with TS from 13 international clinic sites that includes structural imaging, stimulation settings, and pre-DBS and post-DBS clinical outcomes data. We assessed the effects of DBS on TS and OCB severity over time and identified any differences across brain targets, comorbidities and demographics. Patient-specific DBS lead locations and VTA were coregistered to a common neuroanatomical space to provide the first visualisation of active contacts and regions of stimulation across several DBS targets, studies and clinic sites. We note that the present data set was limited to mostly open-label data from multiple clinic sites that were heterogeneous in quality and completeness. Therefore, we focused this first study on analyses that leverage this unique data set to systematically compare how DBS has been delivered across patients with TS in an effort to improve our ability to predict therapeutic response and generate new hypotheses about potentially effective targets for DBS therapy in patients with treatment-refractory TS.
Methods
Patient cohort
This study included data on a subset of patients from the International TS DBS Database and Registry in coordination with the International Neuromodulation Registry at the University of Utah.18 61 Retrospective data were collected on patients receiving bilateral DBS therapy for treatment-refractory TS. Patients were selected for DBS therapy based on local evaluations in accordance with published recommendations.62 Quadripolar DBS leads were implanted bilaterally in each patient (lead models of patients with available data: Medtronic 3387 (n=44), Medtronic 3389 (n=21) and NeuroPace DL-330–3.5 (n=5)). The data collected during follow-up at each clinic site included demographics, comorbidities, brain region(s) targeted with DBS, stimulation settings, preoperative and postoperative clinical rating scale scores, and preoperative and postoperative MRI and/or CT. The primary outcome used in this study was the Yale Global Tic Severity Scale (YGTSS) total score.63 The secondary outcomes included the YGTSS subscores (motor, phonic and impairment) and the Yale-Brown Obsessive Compulsive Scale (Y-BOCS) score.64 The main inclusion criteria for patients in this study were a preoperative YGTSS total score and a minimum of one postoperative YGTSS total score. A total of 110 patients were included in the final cohort.
In order to precisely localise the DBS electrodes and perform accurate image registration, we enforced the following quality control inclusion criteria for the imaging analysis: the patient must have both preoperative T1-weighted MRI and postoperative MRI/CT or only postoperative T1-weighted MRI with a voxel size of less than 3.0×3.0×3.0 mm, discernible contrast between white matter and grey matter structures, and minimal motion or image acquisition-related artefacts. There were 70 patients (148 bilateral leads, 1 unilateral right lead) included in the cohort for active contact analysis. Patients implanted in the GPi (n=30, 60 bilateral VTA) and patients implanted in the CM thalamus (n=33, 64 bilateral VTA, 1 unilateral right VTA) were included in the PSA analyses. Patients implanted in the NA/ALIC or multiple bilateral targets were excluded from the PSA analyses due to small sample sizes.
Patient-specific models
For each patient, we identified the DBS contact locations and constructed computational models to estimate the VTA using previously described methods.52 Bilateral electrode contacts were localised using the lead artefacts in the postoperative CT or MRI. Preoperative MRI and postoperative MRI or CT volumes were aligned using BRAINSFit rigid registration65 implemented in 3D Slicer (http://www.slicer.org).66 We constructed an isotropic finite element model (FEM) of the DBS lead geometry and surrounding conductive tissue using SCIRun software (V.5.0, SCI Institute, Salt Lake City, Utah). The FEM was used to solve for the spatial electric field generated by the stimulation settings. The resulting electric field was then applied to multicompartment axon models implemented in NEURON software.67 68 The VTA was defined as the volume that encompassed the axons that fired action potentials in lockstep with the stimulation pulse. Bilateral VTA were generated for each patient using the stimulation parameters recorded at the final follow-up time point.
Coregistration to cohort atlas
An MRI cohort atlas was constructed to serve as a common coordinate space to facilitate cross-patient comparisons of the DBS electrode and VTA locations. We implemented a hierarchical approach for constructing the atlas to minimise error attributed to differences in image acquisition and quality across sites.69 70 The subset of 58 patients with high-quality preoperative MRI (approximately 1 mm3 voxels, high contrast and minimal artefacts) was further divided into 5 subgroups of 11–13 patients according to clinic site. An atlas was generated using skull-stripped preoperative MRI for each of the five subgroups using the SyN nonlinear image registration method implemented in Advanced Normalization Tools (ANTs) software.71 The final cohort atlas was generated using the subgroup atlases as the input image volumes. For patients whose preoperative MRI were not included in the cohort atlas (n=8) and patients with only postoperative MRI (n=10), nonlinear image registration using SyN in ANTs was used to warp the final MRI cohort atlas to each respective patient’s imaging. Using the resulting transformations, DBS electrode locations and VTA were coregistered to the cohort atlas. To visualise detailed segmentations of the target nuclei in cohort atlas space, we performed nonlinear image registration of the MNI ICBM 2009b Nonlinear Asymmetric atlas72 73 to our cohort atlas to coregister select atlases that were already aligned to the MNI atlas and available from the Lead-DBS software.74 The Harvard-Oxford atlas75–78 was used to obtain bilateral segmentations of the thalamus and NA/ALIC. The DBS Intrinsic Template AtLas (DISTAL) atlas79 80 was used to obtain bilateral segmentations of the GPi, GPe, CMn-Pf complex and Voi nucleus.
Probabilistic stimulation atlases
We generated PSAs in cohort atlas space to compare the brain regions stimulated across patients and analyse the relationship between stimulation location and clinical outcomes using previously reported methods.55 56 A 128×128×128 grid was created with 0.5 mm3 voxels that encompassed the coregistered VTA in cohort atlas space. Voxels of the grid that overlapped with each VTA were assigned a value of 1 and all other voxels were assigned a value of 0, generating a binary VTA for every patient. A voxel-wise sum of the binary VTA was calculated to create a map of the number of overlapping VTA at each voxel to visualise the commonly stimulated regions. PSAs of the average per cent in clinical rating scale scores (YGTSS total and Y-BOCS total scores) were created by assigning the voxels in the grid with the respective per cent change in clinical rating scale and averaging across all VTA at each voxel. A threshold was applied to visualise voxels with data from at least three patients. Finally, patients were grouped into responders (≥40% reduction in YGTSS total score) and nonresponders (<40% reduction in YGTSS total score). We chose a response threshold of 40% for two reasons: (1) two studies81 82 found that a 25%–35% improvement in YGTSS total score was the threshold to detect a clinically meaningful change in tic severity, and (2) a 40% reduction in TS symptoms is likely to be above any placebo effects, especially in a population with such severe and treatment-refractory symptoms. In the PSAs, the responders’ VTA, nonresponders’ VTA and the regions where they overlapped were visualised. We further characterised the overlap regions by mapping the ratio of nonresponder VTA and responder VTA at each voxel. PSAs were visualised as scalar overlays without interpolation using 3D Slicer software (http://www.slicer.org).66
Statistical analysis
Cohort characteristics were summarised using descriptive statistics. To assess whether TS severity changed over time compared with baseline, multilevel linear mixed effects regression models were implemented. Random intercepts were included to allow for correlation among repeat outcome measures within patients and random effects for patients nested within clinic sites. We tested for a random slope for time in the model of YGTSS total scores, but it did not significantly improve the fit (p=0.395) and therefore was not included in the models. Variations by patients and clinic site were summarised using intraclass coefficients. Models were first conducted without covariate adjustment, followed by full multivariable models including age, sex and OCB status. Patients with missing data for age, sex or OCB status were excluded from the full multivariable models. The other comorbidities (attention deficit disorder, depression and anxiety) were not included due to sample sizes. We first tested for differences in YGTSS total scores over time and then tested for brain target by time interactions. Similar models were performed for all secondary outcomes (YGTSS subscores and Y-BOCS scores). Because OCB was strongly associated with Y-BOCS scores, OCB status was not included in the Y-BOCS models. Only patients implanted in the amGPi or CM thalamus were included in the secondary outcome models due to small sample sizes in the other targets. Time was modelled continuously but shown descriptively in 6-month to 12-month intervals. It was noted that YGTSS and Y-BOCS scores were inversely associated with severity, meaning that higher scores signified more severe symptoms.
A Kaplan-Meier analysis was performed to estimate the median time to reach clinical response to DBS. Stepwise cumulative probability curves and 95% CIs were calculated to estimate the median time (in months) to response. Log-rank tests were used to compare response curves for patients implanted in the CM thalamus versus the GPi, patients with TS and OCB versus patients without OCB, and patients grouped by age at implantation (<21 years, 21–30 years, 31–40 years and >40 years). Two-sided p values less than 0.05 were considered statistically significant. All statistical analyses were performed using SAS V.9.4.
Results
Patient cohort
Retrospective data were collected from 123 patients from 13 different institutions across North America (39 patients), Europe (63 patients) and Asia (21 patients). Clinical data were available for a subset of 110 patients to be included in the statistical analysis of long-term clinical outcomes (table 1).
Baseline characteristics of patients with Tourette syndrome receiving deep brain stimulation therapy
The mean (SD, range) follow-up duration was 33.7 (24.1, 1.0–120.0) months, and the mean (SD, range) number of follow-up time points per patient was 3.8 (1.2, 1–9). Stimulation settings recorded at the final follow-up time point are reported in online supplementary table 1. Across all targets, 76 patients (69.1%) received monopolar or multiple monopolar stimulation, 32 patients (29.1%) received bipolar stimulation and 2 patients (1.8%) received monopolar stimulation in one hemisphere and bipolar in the other. There were 73 patients (66.4%) programmed with identical bilateral stimulation settings (frequency, pulse width and voltage) and symmetric contact configurations, and 10 patients (9.1%) were programmed with the identical bilateral stimulation settings but asymmetric contact configurations.
Supplemental material
Post-DBS clinical outcomes over time
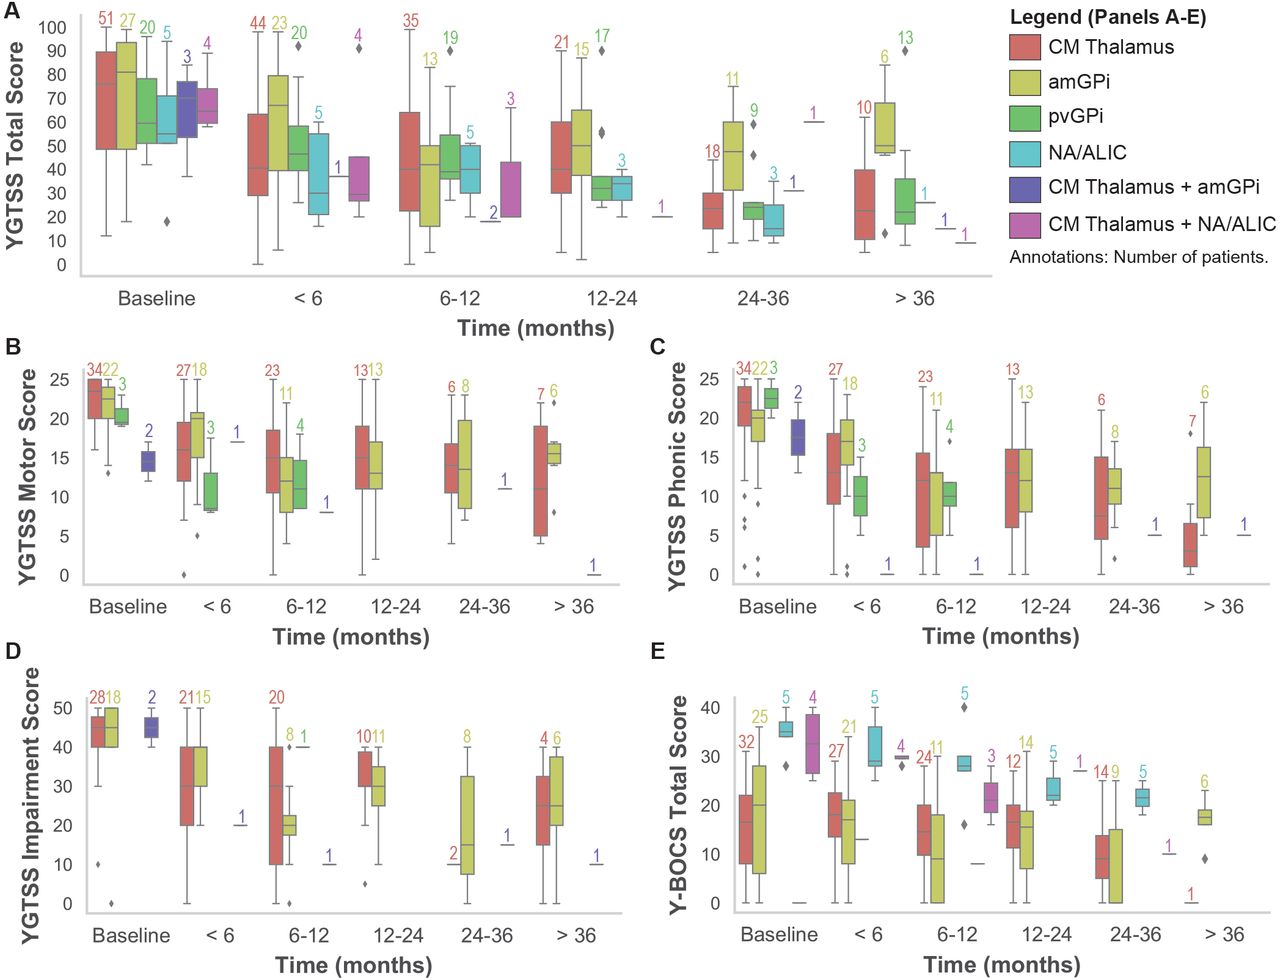
YGTSS total scores, YGTSS subscores and Y-BOCS total scores over time are shown grouped by target in figure 1. The mean (SD) improvement in YGTSS total scores at the final follow-up time point compared with baseline was 46.7% (29.7) and 21.1% (52.9) for Y-BOCS total scores across all patients. The multivariable linear mixed effects model showed that YGTSS total scores significantly decreased over time (β=−0.6, 95% CI (−0.8 to –0.4), p<0.0001). Baseline YGTSS total scores did not differ across brain targets (p=0.088). There were no significant differences in YGTSS total scores over time across brain targets (p=0.671) and scores did not vary by gender (p=0.069). Patients with OCB had significantly higher YGTSS total scores than patients without OCB (β=17.1, 95% CI (7.2 to 27.0), p=0.0008). Patients implanted at an older age had significantly lower YGTSS total scores (β=−0.6, 95% CI (−1.0 to –0.2), p=0.006). Intraclass coefficients indicated that 50.8% of the variations in YGTSS total scores were due to variations by patients and 3.8% were due to variations by clinic site. Statistical models performed for the secondary outcomes showed that YGTSS subscores also significantly decreased over time (motor: β=−0.2, 95% CI (−0.2 to −0.1), p<0.0001; phonic: β=−0.1, 95% CI (−0.2 to –0.1), p=0.0001; impairment: β=−0.3, 95% CI (−0.5 to –0.1), p=0.0008), but there were no significant differences in patients implanted in the amGPi compared with patients implanted in the CM thalamus (motor: p=0.6; phonic: p=0.56; impairment: p=0.72). Patients with OCB had significantly higher YGTSS motor scores (β=3.8, 95% CI (1.5 to 6.1), p=0.001) and YGTSS phonic scores (β=3.6, 95% CI (0.5 to 6.6), p=0.022) than patients without OCB, but there was no statistical difference in YGTSS impairment scores (β=5.1, 95% CI (−2.3 to 12.6), p=0.175). Male patients had significantly lower YGTSS phonic scores than female patients (p=0.022). Y-BOCS total scores also significantly decreased over time (β=−0.1, 95% CI (−0.2 to 0.0), p=0.002). There was no significant difference in Y-BOCS total scores across patients implanted in the amGPi compared with patients implanted in the CM thalamus (p=0.24).

Tic severity and obsessive–compulsive behaviour over time. (A) YGTSS total scores over time grouped by DBS target. (B–D) YGTSS subscores (motor, phonic and impairment) over time grouped by DBS target. (E) Y-BOCS total scores over time grouped by DBS target. YGTSS subscores and Y-BOCS scores were collected for only a subset of the targets. The number of patients in each group is annotated above each boxplot and is coloured according to the legend. ALIC, anterior limb of the internal capsule; amGPi, anteromedial globus pallidus internus; DBS, deep brain stimulation; CM, centromedial; NA, nucleus accumbens; pvGPi, posteroventral globus pallidus internus; Y-BOCS, Yale-Brown Obsessive Compulsive Scale; YGTSS, Yale Global Tic Severity Scale.
Cumulative probability curves were generated using Kaplan-Meier survival analysis to determine the median time to clinical response, which was defined as a 40% reduction in YGTSS total score (figure 2). The median time to response across all patients in the cohort was 13 months (95% CI 12 to 24), with 69.1% of patients reaching response criteria by 60 months (figure 2A). The median time to response for patients implanted in the GPi (18 months, 95% CI 12 to 24) was longer than the median time for patients implanted in the CM thalamus (12 months, 95% CI 8 to 14), but the difference was not significant (χ2=0.042, p=0.84) (figure 2B). There was no significant difference in the median time to response for patients with TS with OCB (24 months, 95% CI 12 to 24) compared with those without OCB (11 months, 95% CI 6 to 15) (χ2=2.87, p=0.09) (figure 2C). The cumulative probability curves were compared for patients grouped by age at implantation (<21 years, 21–30 years, 31–40 years and >40 years) (figure 2D). The median response time of the youngest population (<21 years) was 12 months (95% CI 8 to 18), which was the same as the oldest population (>40 years) (95% CI 6 to 24). There was no significant difference in response curves among any of the age groups (χ2=6.65, p=0.084).

Median time to response across the TS DBS cohort and subgroups. (A) Cumulative probability of response for all patients in the cohort (N=110). (B) Cumulative probability of response for patients implanted in the GPi and CM thalamus. (C) Cumulative probability of response in patients with TS and OCB and patients with TS only. (D) Cumulative probability of response in patients grouped by age at DBS implantation. The shaded regions are 95% CIs. The numbers of patients and the median times to response (in months) are listed in the legends. CM, centromedial; DBS, deep brain stimulation; GPi, globus pallidus internus; OCB, obsessive–compulsive behaviour; TS, Tourette syndrome; YGTSS, Yale Global Tic Severity Scale.
Variability of active contact locations
Bilateral active DBS contact locations for 70 patients recorded at their final follow-up time point were mapped into the cohort atlas space. The active contact locations were visualised relative to segmentations of the targeted nuclei (figure 3A) and reported in mean (SD) millimetres relative to the mid-commissural point of the cohort atlas brain (figure 3B). The targets listed in figure 3B represent the general target regions reported by the clinic site and do not necessarily indicate the anatomical structures in which the contacts were located. In general, active contacts were located near the intended targeted nuclei. In the targets with more than three patients (amGPi, pvGPi and CM thalamus), the highest SD was in the axial direction, which was likely attributed to which contact(s) on the DBS lead were selected. Among patients implanted in the amGPi, there was higher variability in active contact locations in the sagittal axis in the right hemisphere (SD=2.5 mm) than the left (SD=1.2 mm). The CM thalamus contacts in patients implanted bilaterally in both the CM thalamus and the GPi were located more posterior than the CM thalamus contacts in patients implanted bilaterally in both the CM thalamus and NA/ALIC. The GPi contacts in patients implanted bilaterally in both the CM thalamus and the GPi were located in either the amGPi (n=2) or the pvGPi (n=1).

Variability of bilateral active DBS contact locations in the cohort atlas space. (A) Three-dimensional superior view of the locations of the active contacts in the cohort atlas space for n=70 patients relative to nuclei segmentations. Each sphere represents an active DBS contact and is coloured by intended DBS target region as listed in the legend in (B). (B) Sagittal (x), coronal (y) and axial (z) coordinates in mean (SD) mm relative to the mid-commissural point of the cohort atlas. DBS, deep brain stimulation.
Probabilistic stimulation atlases
We generated a series of PSAs using the VTA and per cent change in clinical outcome scores in 30 GPi DBS patients (figure 4). Expanded panel views of these PSAs are shown in online supplementary figures 1-5. First, we found that the most commonly stimulated region was located within the amGPi and the regions inferior to the pallidum (figure 4A). The total area stimulated across patients extended laterally into the regions in GPe and medially into the internal capsule. There were multiple disjointed regions with lower average per cent tic improvement and higher average per cent improvement spanning the GPi, the GPe and the surrounding areas (figure 4B). A region located medial to the right GPi had the highest mean per cent improvement in the PSA, but the region encompassed VTA of only three patients. We also visualised the VTA of nonresponders (n=13 patients) and responders (n=17 patients) and the region where they overlapped (figure 4C). The region of overlap encompassed 51.0% of the total volume of stimulation. The regions where only nonresponders (11.2% of the total volume) and only responders (37.8% of the total volume) were stimulated included only three or fewer VTA. We further characterised the region of overlap by mapping the ratio of nonresponder VTA and responder VTA (online supplementary figure 5). In the PSA of mean per cent improvement of the Y-BOCS scores (figure 4D), we observed a gradient-like trend in mean per cent improvement in Y-BOCS total score from greater average improvement in the more superior regions to least improvement or worsening of symptoms in the regions inferior to the GPi. The VTA of patients who experienced less than 25% improvement of the Y-BOCS scores (n=4) or worsening of OCB symptoms (n=4) overlapped with a region located inferior to the GPi. Five of these patients’ VTA also overlapped with the GPi and/or the GPe. In contrast, the VTA of 12 patients who experienced greater than 25% improvement of the Y-BOCS score overlapped with the GPi, GPe or regions located superior or medial to the pallidum, but only one patient’s bilateral VTA extended into the regions below the GPi.
Supplemental material
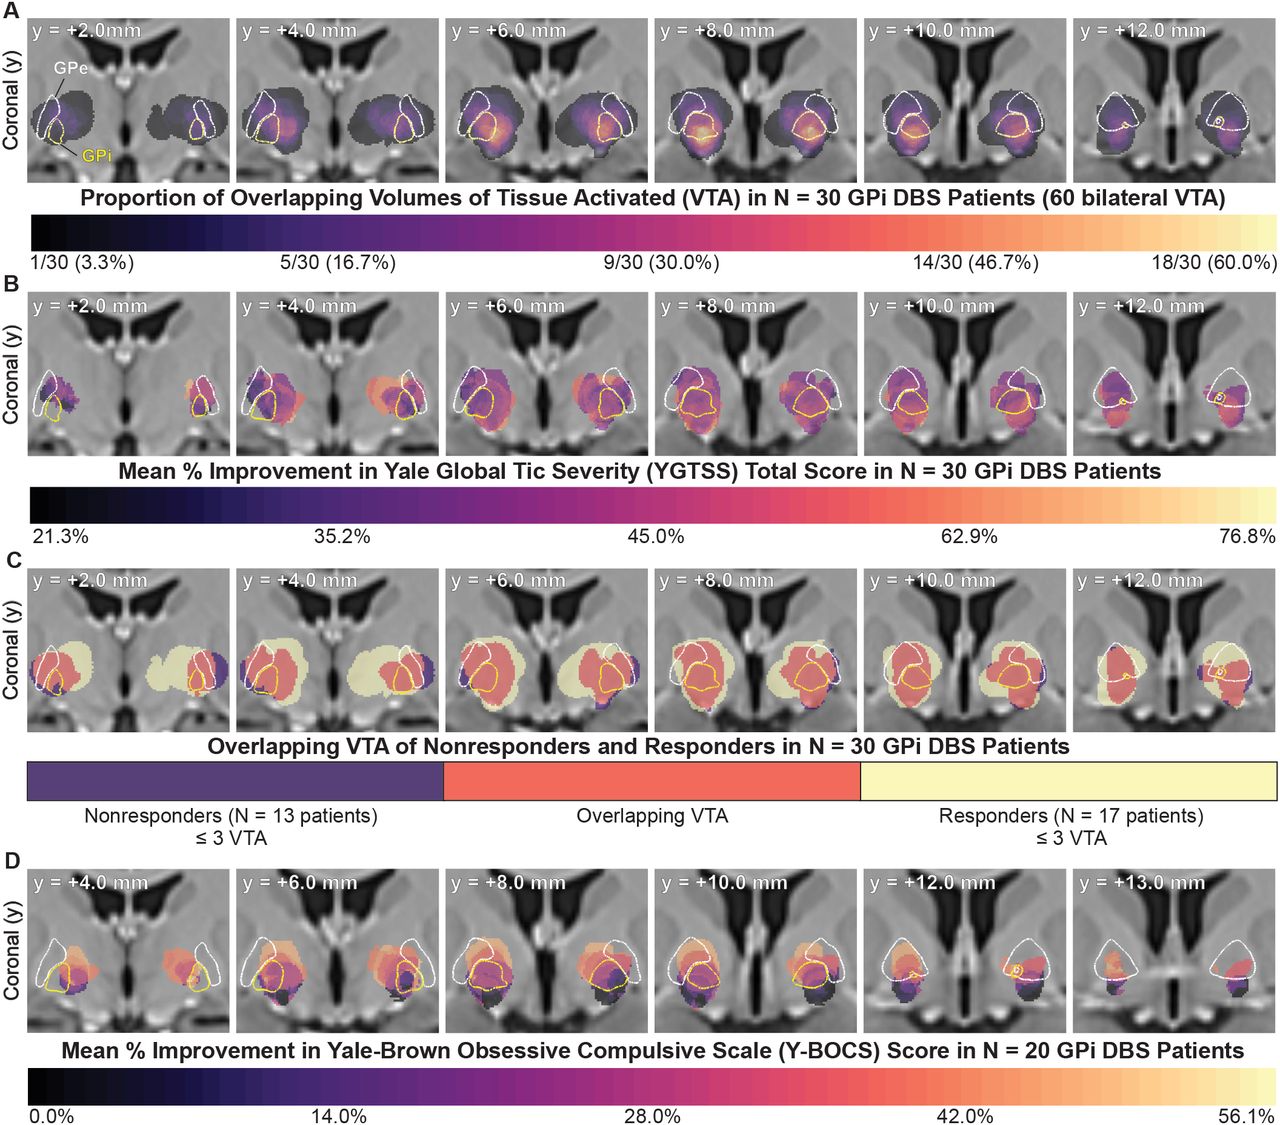
PSAs of clinical outcomes in GPi DBS patients. (A) PSA of the proportion of the total number of patients stimulated at each voxel. The region with the greatest number of overlapping VTA across GPi DBS patients was located within the amGPi and the regions inferior of the amGPi. (B) PSA of the mean per cent improvement in YGTSS total score. (C) Regions stimulated in nonresponders, responders and the regions where they overlapped. There was substantial overlap of effective regions and regions that were associated with little to no therapeutic benefit. (D) PSA of the mean per cent improvement in the Y-BOCS total score showed that the VTA of patients who did not reach a 25% improvement extended below the GPi. The VTA of patients who reached a >25% improvement were located within the pallidum and/or medial or superior to the pallidum and did not extend below the GPi. Segmentation outlines of nuclei are overlaid for reference (GPi, yellow; GPe, white). For axial and sagittal views, see online supplementary figures 1-4. amGPi, anteromedial globus pallidus internus; DBS, deep brain stimulation; GPe, globus pallidus externus; GPi, globus pallidus internus; PSA, probabilistic stimulation atlas.
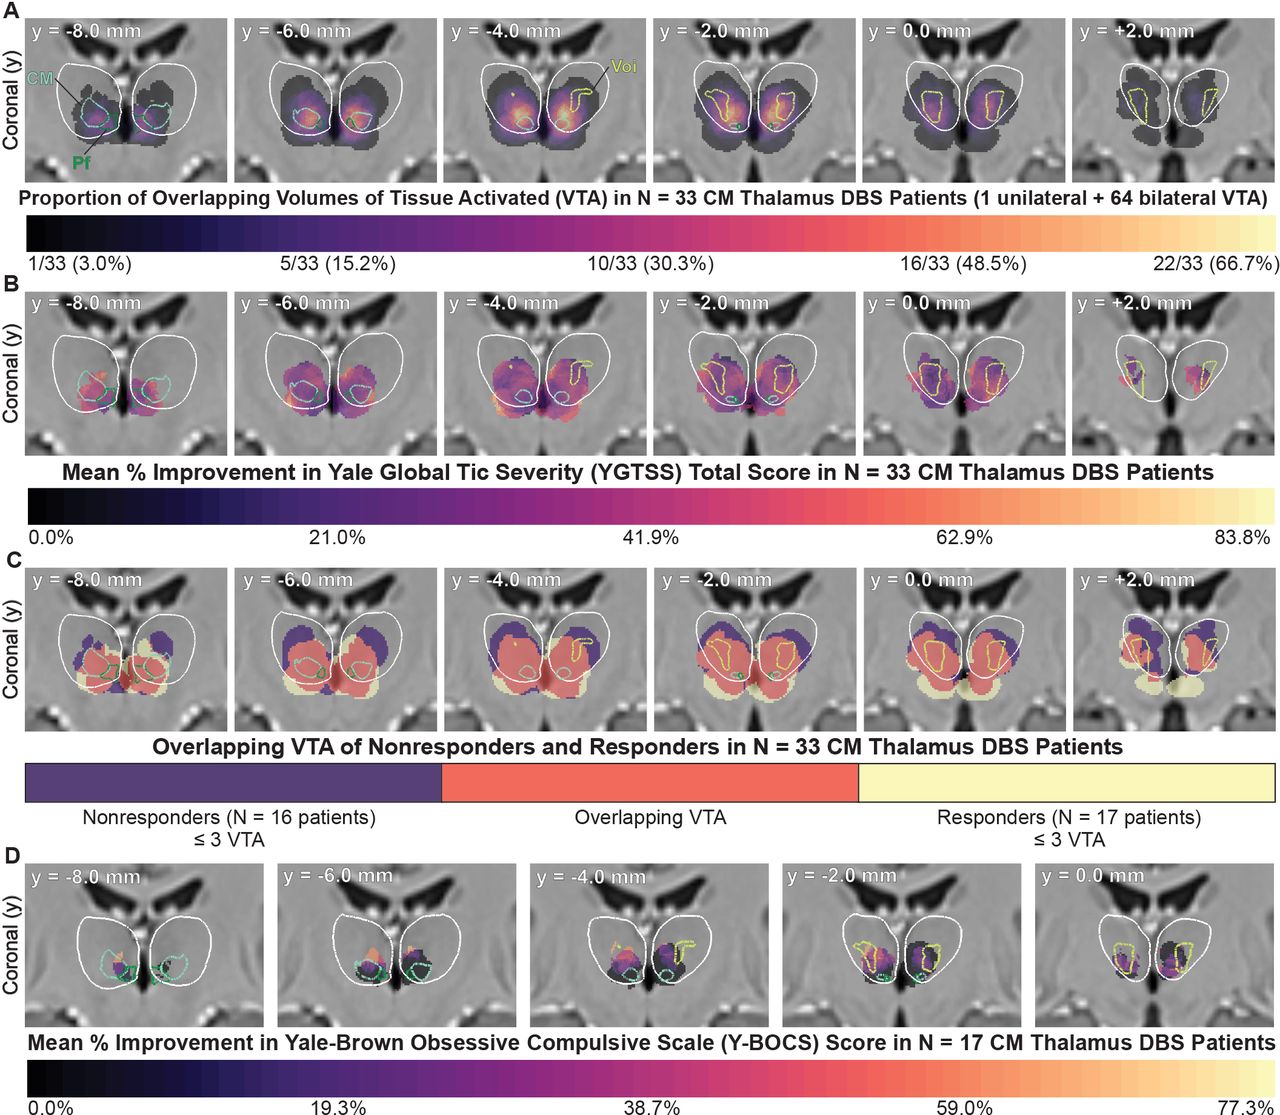
A series of PSAs were also generated using the VTA of the 33 patients implanted in the CM thalamus (figure 5). Expanded panel views of these PSAs are shown in online supplementary figures 6-10. The region with the greatest number of overlapping VTA was located at the intersection of the CMn-Pf complex-Voi (figure 5A). Regions that produced higher mean improvement were intermixed with regions that produced lower mean improvement across patients (figure 5B). The VTA of responders (n=17 patients), nonresponders (n=16 patients) and the regions where they overlapped are visualised in figure 5C. The region of overlap was 56.7% of the total volume of stimulation. Regions where only nonresponders and responders were stimulated encompassed 18.7% and 24.6%, respectively, but these regions comprised only three or fewer VTA. We also created a PSA of the ratio of nonresponder VTA and responder VTA in the overlap region (online supplementary figure 10). The regions in which there were more nonresponder VTA than responder VTA were located anterior, lateral and inferior to the CMn-Pf complex and within the Voi. The mean per cent improvement in Y-BOCS total score at the final follow-up time point for 17 CM thalamus DBS patients was overlaid in the cohort atlas space (figure 5D). In the left hemisphere, there was a gradient-like trend with lower per cent improvement located in the inferior regions of the CMn-Pf complex and greater per cent improvement located in more superior regions between the CMn-Pf complex and Voi nucleus. However, this pattern was not symmetric; one patient with a unilateral lead implanted in the right hemisphere experienced a 125% worsening of OCB symptoms.
Supplemental material
PSAs of clinical outcomes in CM thalamus DBS patients. (A) PSA of the proportion of the total number of patients stimulated at each voxel. The region with the greatest number of overlapping VTA across the CM thalamus DBS patients was located at the intersection of the CMn-Pf complex-Voi. (B) PSA of the mean per cent improvement in YGTSS total score. (C) Regions stimulated in nonresponders, responders and the regions where they overlapped. There were regions associated with improvement and overlapping regions associated with little to no therapeutic benefit. (D) PSA of the mean per cent improvement in the Y-BOCS total score. Segmentation outlines of the nuclei are overlaid for reference (thalamus, white; CM nucleus, light blue; PF complex, dark green; Voi, yellow-green). For axial and sagittal views, see online supplementary figures 6-9. CM, centromedial; CMn-Pf, centromedian nucleus-parafascicular; DBS, deep brain stimulation; PSAs, probabilistic stimulation atlases; Voi, ventro-oralis internus.
Discussion
Effects of DBS for TS over time
The long-term clinical outcomes analysis showed that the YGTSS motor, phonic, impairment and total scores and Y-BOCS total scores significantly improved over time in response to DBS, indicating that DBS may be effective in reducing tic severity and OCB (figure 1). These findings are consistent with the results previously reported by meta-analyses and the International TS DBS Database and Registry, from which the present data set includes a subset of patients.18 51 The data in this study were drawn from mostly open-label studies that were performed at multiple sites that differed in surgical techniques and treatment approaches. This may have biased the results, but our statistical analysis showed that only 3.8% of the variability in YGTSS total scores was attributed to differences across sites. Because the data were drawn from mostly open-label studies, it is also possible that the results of the clinical outcomes analysis and PSAs were influenced by placebo effects. However, randomised controlled trials have reported that tics significantly improved in patients receiving active stimulation, and there were no significant changes in symptoms in response to sham stimulation.22 34 39 Across these trials, the mean or median change in YGTSS total scores in response to sham stimulation ranged only from −7.2 points (improvement)22 to +0.9 points (worsening).39 This indicates that the placebo response to stimulation is likely to be lesser in magnitude than the therapeutic response to active stimulation, and therefore the observed improvements in tics are not likely attributed to placebo effects alone. Although our results indicate that DBS may be effective for TS, additional randomised controlled trials in large cohorts are needed to definitively conclude that DBS is effective in reducing tics and comorbidities in patients with TS.
We observed that the median time was 13 months for patients to reach a 40% reduction in tic severity across all targets (figure 2). We varied the criteria for response from 40% improvement to other thresholds, and the time to response remained on the order of multiple months. One limitation of this analysis was that this data set included follow-up time points at the resolution of months, so a detailed analysis at smaller time intervals was not possible. Our results indicate that clinicians may need to be more patient with TS DBS compared with other indications, and detailed data of any stimulation setting changes should be recorded to facilitate careful reconstruction of the acute and long-term effects of stimulation. Other studies have reported that the effects of TS DBS are often not immediate and wash-in/washout times vary.22 39 48 83 However, an important dispute is whether the observed delayed response to DBS was due to TS symptoms requiring more time to respond to DBS or if it was due to better titration of stimulation settings over time. The delayed response also may be attributed, in part, to spontaneous fluctuations in tics that were independent from the clinical response to DBS or any placebo effects.
The mechanisms of the onset of the effects of TS DBS remain unclear, but studies of DBS for other psychiatric disorders, such as OCD and treatment-resistant depression, have also reported that the time to see a significant effect is often on the order of months.49 84 85 The therapeutic response to DBS for depression or OCD is thought to be mediated by neuroplasticity that leads to local and/or network activity that restores normal function to pathological neurocircuitry.84–87 It has also been reported that the effects of DBS for dystonia develop over the course of months, with some patients experiencing improvements after 3–6 months of stimulation in the GPi, although the underlying mechanisms remain unclear.88 89 Acute effects of DBS for TS have been investigated in nonhuman primate models90 and through intraoperative microelectrode and local field potential (LFP) recordings in humans,91–93 but it is unclear whether changes in neuroplasticity underlie the long-term therapeutic effects of DBS in TS. Chronic LFP recordings in one patient with TS suggested that DBS does not induce changes in LFP oscillatory activity over the course of 12 months,94 but further research is needed to elucidate the long-term mechanisms of DBS for TS.
Comparison of clinical outcomes across brain targets
We found no significant differences in YGTSS scores or Y-BOCS scores over time among patients implanted in the CM thalamus versus amGPi, which suggests that the CM thalamus and amGPi both may be effective in improving TS symptoms and OCB. These results are in agreement with the results reported by meta-analyses and the International TS DBS Database and Registry.18 51 The finding that multiple nuclei may be effective targets for DBS has also been shown in other indications; for example, both the subthalamic nucleus and GPi have been shown to be effective DBS targets for Parkinson’s disease.95 There were also no significant differences in the median time to response among patients implanted in the CM thalamus versus GPi. It has been hypothesised that because the CM thalamus and amGPi are thought to be connected within the same CSTC network,7 96 stimulating either target may modulate pathological CSTC activity to reduce TS and comorbidities.31 97 98 A recent study showed that there is oscillatory coupling of the CM thalamus and GPi in the theta and beta frequency ranges, indicating a possible functional link between the two structures and their involvement in TS pathology.99 Several interconnected regions have also been implicated in TS as well as OCB, including thalamic regions, pallidum, other basal ganglia nuclei and cortical regions.100 101
Double-blind, sham-controlled studies on small cohorts of patients with TS implanted with DBS leads in both the CM thalamus and GPi (amGPi or pvGPi) have reported that the therapeutic effects did not greatly differ across targets; however, GPi DBS yielded better tic improvement in some patients.20 38 Although our analysis of the cohort data revealed no statistical difference across targets, there may be one target that is more effective for specific patients. It is still unclear which factors are important for determining which target is suited for any given patient; some have speculated that in select cases, DBS of the CM thalamic regions was not sufficient for alleviating severe OCB and targeting the amGPi may be more effective.37 Future studies that include patients implanted with bilateral leads in both the CM thalamus and the GPi should be carefully designed such that the effects of the two targets can be directly compared within a single patient.
Variability of active contact locations
We present the first visualisation of bilateral active contact locations across multiple patients with TS, studies, clinic sites and DBS targets (figure 3). The visualisation shows that active contact locations are variable across all of the intended target nuclei. This variability highlights the importance that future studies visualise where the electrodes were implanted relative to the surrounding anatomy in each patient to facilitate future comparisons. Open-source tools, such as Lead-DBS,74 are available to perform lead localisation in individual subjects. We speculate that the variability in contact locations may be attributed, in part, to the fact that several groups’ surgical targets differed slightly in location within nuclei. A good example of this is evident in the four different anatomical regions that have been targeted within the CM thalamus.19 33 37 38 Another potential source of variability is that not all patients were implanted with the same lead model, and contacts at different positions on the lead were often selected. We also observed some asymmetry in the contact locations across hemispheres. One hypothesis is that with bilateral implantation, brain shift occurs after implanting the first lead, and therefore the second lead may be slightly displaced despite accurate preoperative planning.102–104 There also may be slight registration errors in warping patient imaging to atlas space, and we were especially cognisant of this. Lead locations relative to structural anatomy in atlas space were carefully compared with those in native patient imaging space. Patients with inaccurate registrations were excluded from the analysis (n=8), but slight errors may still have been present.
Probabilistic stimulation atlases
Our results indicate that stimulation location relative to structural anatomy alone did not predict the effect of DBS on tic severity. There were multiple regions within the CM thalamus and GPi that substantially improved tics for some patients but induced minimal effects for others, and there were relatively large regions of overlap of responders and nonresponders in both the CM thalamus and the GPi. We varied the criteria for response from 40% to other thresholds, but this did not substantially change the responder/nonresponder PSAs for either the CM thalamus or GPi. We could not draw any definitive conclusions about specific anatomical regions to target or avoid for beneficial effects on tics. Previous studies of lesion therapy and DBS for Parkinson’s disease have also reported that there was substantial overlap in lesions and active contact locations that improved symptoms in some patients and not in others.105 106 This overlap suggests that the therapeutic effects of DBS in some indications are likely attributed to several complex factors beyond only the anatomical region of stimulation. However, we found that patients stimulated within the pallidum or medial or superior to the pallidum experienced beneficial improvement in the Y-BOCS total score, and patients stimulated in regions directly inferior to GPi experienced little to no improvement (figure 4). Although it was in only 20 patients, the observed trend suggests that stimulating regions inferior to the pallidum may be less effective in reducing OCB. This trend could potentially be tested by altering contact configurations in patients whose OCB is unresponsive to reduce the stimulation of regions inferior to the GPi. Because the data for the PSA analyses were mostly from open-label studies, it is unclear if placebo effects or natural fluctuations in tics may have affected the results. Therefore we are cautious to draw definitive conclusions about specific anatomical regions to target or avoid for improving tics or comorbidities.
One limitation of PSAs is that there is often a confined spatial distribution of electrode locations and VTA.57 58 This is a product of the location of the electrode and the stimulation parameters for each patient, as well as the spatial clustering of leads near the target. Many VTA were overlapping within the intended targets in the GPi and CM thalamus, and relatively few were located in the surrounding regions. This overlap was especially prevalent in the GPi, where contact locations were clustered together and some of the stimulation settings resulted in larger VTA, which in turn resulted in larger regions of overlap among patients (figure 4). Detailed statistical models used in other PSA studies could be applied to test whether any observed trends were statistically significant.55 57 This approach has been applied in a smaller cohort of TS DBS patients implanted in the amGPi, but no regions were found to be statistically significant after correcting for multiple comparisons.107
Stimulation parameters also likely play a role in mediating both the acute and long-term response to DBS. We observed variability in frequency, pulse width, voltages and contact configurations among patients and targets (online supplementary table 1). Controlled trials that compare pulse widths or frequencies are an important next step to determine the efficacy of different stimulation parameters. Another limitation of this study was that the regions associated with stimulation-induced side effects could not be assessed because the reported side effects were not linked to a specific set of stimulation parameters. In our PSAs, we used data from only the final time point per patient to compare VTA across the greatest number of patients. However, using data from a single time point for each patient provides only a ‘snapshot’ in time of the patient’s response to one set of stimulation parameters. Given the complex clinical time course of TS symptoms and in light of our Kaplan-Meier results, time is an important variable to be considered in future studies. Incorporating multiple VTA from several time points per patient could be a way to capture the variability in outcomes over time and investigate the relationship between stimulation regions and the long-term effects of DBS.
The data set used to generate the PSAs was limited to only patients with imaging that met the strict quality control criteria. We collected structural imaging on 123 patients, but 53 patients (43%) were excluded from the imaging-based analysis, often due to low-resolution postoperative imaging (n=24 patients). Additionally, several patients’ preoperative imaging was excluded due to low resolution and/or poor structural contrast. Acquiring high-quality preoperative and postoperative imaging is the first step in precisely localising DBS electrodes and creating accurate patient-specific models. Preoperative T1-weighted MRI should be acquired with at least 1.0 mm isotropic voxels, and the magnetization-prepared rapid acquisition with gradient echo (MP2RAGE) sequence on a 3T scanner produces high signal-to-noise ratios for accurate registration and segmentation protocols.108 For accurate localisation of the electrode contacts, postoperative imaging resolution of 1.0×1.0×1.0 mm or less is required because larger voxel sizes prevent clear visualisation of the individual electrodes.109 Postoperative CT is preferred over MRI because the distortion artefact induced by the electrode is reduced in CT imaging, which allows for more precise electrode localisation.110 111
Improving future analyses of DBS for TS
Based on our results and given the complexity of TS and its associated comorbidities, we postulate that it is unlikely there is a single most effective neuroanatomical region that improves tics and comorbidities across patients with TS. We propose that future studies should incorporate multiple types of data beyond structural imaging and be designed in such a way to learn as much as possible from each patient in order to guide future DBS therapy for TS. First, the power of this study was limited by the fact that most of the data were open-label. Future efforts should be directed towards obtaining data that are properly controlled and collected by blinded raters, which can be facilitated by using video-based assessments such as the Rush Video-Based Tic Rating Scale.16 112 113
High-quality preoperative imaging of multiple modalities (T1-weighted MRI, diffusion-weighted imaging (DWI) and resting-state functional MRI) should be acquired in each patient. Multiple imaging modalities are important for creating detailed patient-specific models that incorporate connectivity data in order to study how fibre pathways and functional networks are being modulated in a single patient with TS and how this may contribute to response. TS and its associated comorbidities are highly heterogeneous from patient to patient. Detailed patient characteristics, such as symptom profiles (tic types and comorbid behaviours), medications, time course of symptoms and severity of comorbidities, need to be collected in order to study their role in the response to DBS and to further characterise the pathology that contributes to different symptoms.114 115 Patient-specific clinical characteristics combined with high-quality multimodal preoperative imaging would give important insight into how differences in connectivity may affect response to DBS. This could lead to better stratification of patients into subtypes that could guide future treatment strategies. It would be immensely powerful to be able to select stimulation targets for individual patients based on the combination of their TS and comorbidity symptoms, structural neuroanatomy and functional connectivity. The present data set will continue to grow alongside the International TS DBS Database and Registry and will serve as an important resource for future centres to compare potential TS DBS candidates’ profiles against the predicted response rates and the reported efficacy of different DBS targets.
There are also emerging technologies that could be leveraged to improve DBS for TS. First, tics are paroxysmal, which means that closed-loop paradigms could be used as a way to address the underlying pathology of TS by triggering or adapting stimulation in response to pathological neural activity.116–119 Preliminary results showed that closed-loop DBS is effective in reducing tics.117 Additionally, closed-loop systems provide the opportunity to simultaneously record tic-related neurophysiological activity within target nuclei and identify stimulation parameters that prevent tics. Another potential avenue for improving DBS for TS is the use of novel directional leads to steer stimulation towards certain nuclei and away from others (eg, CMn-Pf complex vs Voi) to test the contributions of different nuclei to the observed response.120 Directional DBS leads could be useful for further interrogating the effects of stimulating specific CM thalamic nuclei or subregions of the pallidum and perform PSA analyses with higher spatial specificity than the PSAs in this study.
Conclusions
The present study was the first to combine structural imaging, patient-specific computational models and clinical outcomes of patients with TS receiving DBS therapy into a common atlas space to make inferences about how stimulation location affects tic severity and OCB. We provide the first visualisation of active contact locations and stimulated brain regions across multiple patients, targets and clinic sites. The PSAs in the CM thalamus and GPi showed multiple intermixed and overlapping regions associated with substantial and/or ineffective tic reduction. We believe that these findings may be attributed to relatively consistent lead placement and stimulation settings; the regions where the greatest number of patients were stimulated were located near the most commonly reported surgical targets in the CM thalamus and amGPi. The PSA of OCB improvement showed a gradient-like trend that suggests regions just inferior to the GPi may be less effective in reducing OCB as regions within the pallidum or medial or superior to the GPi. Our results collectively indicate that DBS may be an effective therapy for select cases of treatment-refractory TS, but targeting based on structural anatomy alone may not be sufficient to achieve therapeutic benefit in every future patient. Future directions for TS DBS should be towards increasing our predictive power to be able to integrate symptom profiles, neuroanatomy, functional connectivity, fibre pathway and pathological neural activity in an effort to choose targets and stimulation paradigms that most effectively reduce tics and comorbidities on a patient-specific basis. As a next step towards this goal, we plan to integrate functional connectivity and fibre tracts into the PSAs to provide insight on the network-level effects of TS DBS, identify potential novel targets that improve tics and OCB, and advance our ability to predict clinical outcomes.
Acknowledgments
The statistical analysis portion of this study was supported by the University of Utah Study Design and Biostatistics Center.
References
Footnotes
Contributors KAJ executed the data analysis and prepared the first manuscript draft. PTF provided guidance on image registration methods. CRB provided the computational resources necessary for the completion of the project. MSO and CRB provided project guidance. All authors except for KAJ, PTF and CRB contributed retrospective patient data to the study, and all authors participated in the critical review of the manuscript.
Funding KAJ is supported by the NSF Graduate Research Fellowship Program (1747505). KAJ and CRB are supported by NIH P41 Center for Integrative Biomedical Computing (CIBC) (GM103545). The Tourette Association of America provided an International TS Registry Grant to support this project (PI: MSO). The University of Utah Study Design and Biostatistics Center is funded in part by the National Center for Research Resources and the National Center for Advancing Translational Sciences, National Institutes of Health, through Grant 8UL1TR000105 (formerly UL1RR025764).
Competing interests JLO has received research grant support from the Michael J Fox Foundation, Boston Scientific, Cala Health, NIH, DARPA, PCORI and Biogen, and she has also received training grant support from Boston Scientific and Medtronic, and has served as a consultant for Acadia Pharmaceuticals and Medtronic. AL serves as a consultant for Boston Scientific and holds intellectual property in the field of DBS. JK has received financial support for investigator-initiated trials from Medtronic and grants from the German Research Foundation (KU2665/1-2) and the Marga and Walter Boll Foundation. CZ has received honoraria and travel expenses from the deep brain stimulation industry (Medtronic, PINS, SceneRay). MSO serves as a consultant for the National Parkinson Foundation, and has received research grants from NIH, NPF, the Michael J Fox Foundation, the Parkinson Alliance, Smallwood Foundation, the Bachmann-Strauss Foundation, the Tourette Syndrome Association, and the UF Foundation. MSO DBS research is supported by R01 NR014852 and R01NS096008. MSO has previously received honoraria, but in the past >60 months has received no support from the industry. MSO has received royalties for publications with Demos, Manson, Amazon, Smashwords, Books4Patients and Cambridge (movement disorders books). MSO is an associate editor for New England Journal of Medicine Journal Watch Neurology. MSO has participated in CME and educational activities on movement disorders (in the last 36 months) sponsored by PeerView, Prime, QuantiaMD, WebMD, Medicus, MedNet, Henry Stewart and by Vanderbilt University. The institution and not MSO receives grants from Medtronic, AbbVie, Allergan and ANS/St Jude, and the PI has no financial interest in these grants. MSO has participated as a site PI and/or co-I for several NIH, foundation and industry sponsored trials over the years but has not received honoraria. CRB has served as a consultant for NeuroPace, Advanced Bionics, Boston Scientific, Intelect Medical, St Jude Medical and Functional Neuromodulation, and he holds intellectual property related to DBS.
Patient consent for publication Not required.
Ethics approval Written informed consent was obtained from each patient according to the respective institution’s procedures and the Declaration of Helsinki. Retrospective analysis of the data was approved by the University of Utah Institutional Review Board.
Provenance and peer review Not commissioned; externally peer reviewed.
Data availability statement Data are available upon reasonable request.
Linked Articles
- Editorial commentary