Article Text

Abstract
The brain is in a constant state of dynamic change, for example switching between cognitive and behavioural tasks, and between wakefulness and sleep. The brains of people with epilepsy have additional features to their dynamic repertoire, particularly the paroxysmal occurrence of seizures. Substantial effort over decades has produced a detailed description of many human epilepsies and of specific seizure types; in some instances there are known causes, sometimes highly specific such as single gene mutations, but the mechanisms of seizure onset and termination are not known. A large number of in vivo animal models and in vitro models based on animal tissues can generate seizures and seizure-like phenomena. Although in some instances there is much known about the mechanism of seizure onset and termination, across the range of models there is a bewildering range of mechanisms. There is a pressing need to bridge the gap between microscale mechanisms in experimental models and mechanisms of human epilepsies. Computational models of epilepsy have advanced rapidly, allowing dynamic mechanisms to be revealed in a computer model that can then be tested in biological systems. These models are typically simplified, leaving a need to scale up these models to the large scale brain networks in which seizures become manifest. The emerging science of connectomics provides an approach to understanding the large scale brain networks in which normal and abnormal brain functions operate. The stage is now set to couple dynamics with connectomics, to reveal the abnormal dynamics of brain networks which allow seizures to occur.
Statistics from Altmetric.com
It seems likely that our current understanding of epilepsy will radically change in the next decade. Conventional clinical concepts in epilepsy are still founded on a scheme developed 30 years ago.1 ,2 Seizure types were assigned to two major categories: focal or generalised. Despite the clarity of this classification, even in the original description its unsatisfactory nature was recognised by the additional category of ‘unclassifiable’ seizures. Likewise, the disorders causing epilepsy were classified into presumed localised brain disturbances and those with a presumed generalised disturbance; nonetheless, some epilepsies defied this dichotomy and were labelled ‘unclassifiable’. Given ever expanding knowledge about epilepsy, the need to re-examine these approaches to classification has been clear for several years. In particular, the identification of widespread and often bilateral phenomena in supposedly focal epilepsies3 ,4 and the finding of focal features in supposedly generalised epilepsy syndromes—best exemplified by the finding of a localised cortical focus which drives absence seizures in a rat model5–7—suggest that even the focal/generalised dichotomy is not clearcut. Unfortunately, the wide range of gene mutations coupled with the vast array of experimental manipulations that can give rise to seizures results in a bewildering picture: unifying epilepsy mechanisms do not seem to have emerged yet. In this context, a new proposal for a classification of the epilepsies8 has not developed easily.
The difficulty reaching a new approach to epilepsy classification stems from the paucity of data to link clinical phenomenology with underlying mechanisms. The science which could join together microscale mechanisms with clinical phenomenology (systems neuroscience) has not yet emerged as the leading explanatory paradigm in epilepsy. The purpose of this review is to introduce concepts from systems neuroscience, in particular to show how description and dynamic modelling of brain networks will be an especially fruitful approach. Three key points should be emphasised:
-
Seizures emerge rapidly from normal brain states and usually self-terminate; the time scale of onset and offset of a seizure is orders of magnitude faster than any possible change in the numbers of neurons, axons, dendrites or synapses, and many other neuronal mechanisms. Therefore, the neuronal machinery causing seizures is the same machinery present in the brain interictally during normal function. This suggests that epilepsy is a problem emerging from dynamic properties of the brain.
-
The clinical expression of seizures necessarily requires the involvement of large scale brain networks to create behavioural output and/or to allow subjective experience of the seizure; without behavioural or subjective features, there is no epilepsy. A very wide range of mechanisms gives rise to a relatively small range of seizure types; and patients who appear to have seizure onset from different brain regions can produce seizures that appear identical. These observations suggest that although there may be many different microscale mechanisms of seizure onset, common pathways of seizure evolution and expression at the large scale emerge from these divergent microscale mechanisms; these common pathways necessarily involve large-scale brain networks.
-
The concept of a ‘seizure focus’ is much less clearcut than it might seem; it is much more likely that ‘focal’ seizures arise from a network, and that in some cases removal of a crucial network node (the ‘seizure onset zone’) will stop seizures. Even in operated epilepsy surgery cases, the correlation between removal of the ‘seizure onset zone’ and epilepsy cure is not simple: in a large recent study,9 22% of patients considered to have good postsurgical outcomes were in fact continuing to have simple partial seizures despite removal of the ‘seizure onset zone’; 31% of all operated patients had a complex pattern of remission and relapse; and 5% of all operated patients had a remission or relapse directly related to a drug change following surgery.9 These observations strongly suggest that in many patients (maybe all) there is no single focal region which drives seizure onset, but rather a complex network, the dynamics of which can be helpfully altered in many cases through epilepsy surgery, targeting a specific network node, which currently is termed the seizure onset zone.
Therefore, the underlying thesis of this contribution is that describing and understanding the dynamic mechanisms operating in large scale human brain networks is likely to produce key insights into human epilepsy, and new approaches to treatment.
Neuroimaging evidence for brain networks underlying epilepsy
EEG evidence supporting large scale brain network involvement in focal seizures has been described previously,3 although some controversy was generated.10 Intracranial EEG evidence suggests that in some instances, in the same patient, different seizures might start in different anatomical regions, but rapidly engage the same network, giving rise to identical seizures; conversely, in some instances, seizures with onset in the same region may engage different networks in different seizures, producing seizures with different semiological manifestations.3 Intracranial EEG necessarily has very limited coverage of different brain areas, and would not typically record from certain structures (eg, the thalamus) and so can provide only limited data on large scale brain networks in epilepsy. Neuroimaging in epilepsy provides very substantial evidence for the involvement of a widespread set of specific brain regions in specific epilepsy syndromes and seizure types.4
Neuroimaging reveals brain network abnormalities in mTLE
Mesial temporal lobe epilepsy (mTLE) is the best studied focal onset epilepsy (see figure 1). Structural MRI shows atrophy of the anterior hippocampus in addition to other mesial temporal lobe regions (entorhinal cortex, perirhinal cortex, piriform cortex, amygdala), and also consistently loss of grey matter is seen in the striatum, frontal and parietal neocortex and bilateral thalamus.11–17 These abnormalities tend to be more pronounced after a longer duration of epilepsy, or in those with generalised seizures, suggesting a mechanism related to chronic unremitting seizures. Using diffusion tensor imaging (DTI), which captures the direction and integrity of white matter tracts, the tracts between some of these regions have been found to be abnormal, particularly within the limbic system and transcallosal white matter.18–20 These structural abnormalities have parallels in functional abnormality. 18Fluorodeoxyglucose-positron emission tomography typically identifies interictal regions of reduced glucose metabolism in the mesial temporal lobe and adjacent neocortex21 ,22 and also in the insular cortex, putamen and thalamus.23–25 Ictal single photon emission computed tomography in mTLE often shows not only hyperperfusion during seizures in the temporal lobe but also hyperperfusion in the thalamus, striatum and insula, usually ipsilateral, and correlated with ictal dystonia of the contralateral upper limb.26–30 In simple partial seizures, there may be no widespread cortical perfusion changes but during complex partial seizures, there is increasing involvement of the bilateral thalamus as the seizure progresses.31 Loss of consciousness in mesial temporal lobe seizures has been linked with hyperperfusion in the mediodorsal thalamus and hypoperfusion in the frontal association cortices.31 Secondary generalisation may involve widespread contralateral hypoperfusion.32
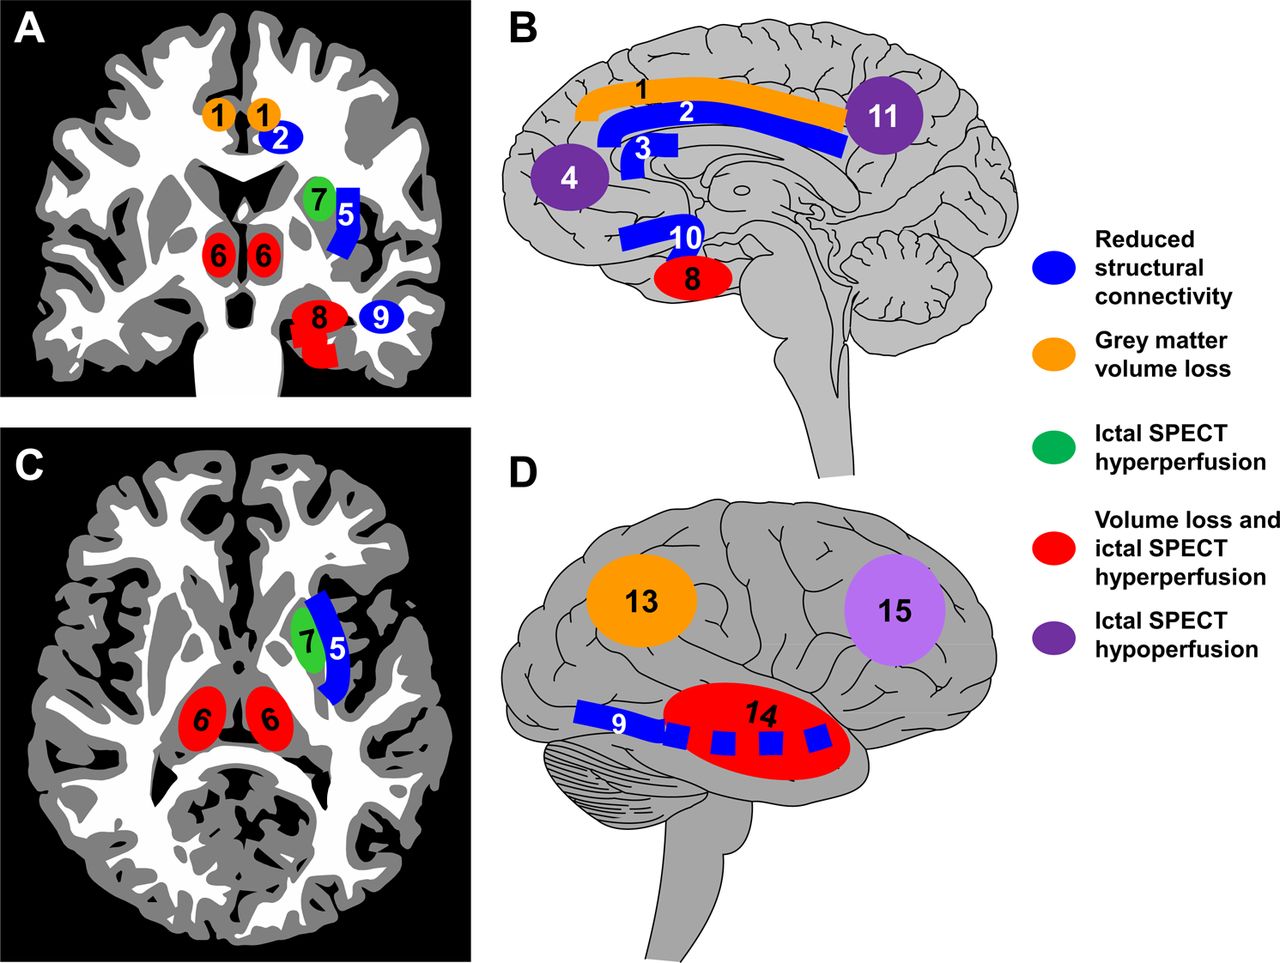
A schematic summary of the brain network abnormalities seen in neuroimaging studies of patients with mesial temporal lobe epilepsy. This summary is based on substantial evidence. (A) Coronal section; (B) medial view of the ipsilateral right hemisphere; (C) axial section; (D) lateral view of the ipsilateral right hemisphere. Neuroimaging evidence suggests a wide range of structural and functional network abnormalities. There is grey matter atrophy in the ipsilateral mesial temporal lobe (8), ipsilateral lateral temporal neocortex (14), ipsilateral parietal neocortex (13), bilateral thalamus (6) and bilateral cingulate gyrus (1). There is loss of white matter connectivity in the ipsilateral cingulum bundle (2), ipsilateral external capsule (5), ipsilateral inferior longitudinal fasciculus (9), bilateral uncinate fasciculus (10) and anterior corpus callosum (3). During seizures captured with ictal single photon emission computed tomography (SPECT), increased perfusion is seen in the ipsilateral mesial temporal lobe (8), lateral temporal lobe (14), striatum (7) and bilateral thalamus (6). Decreased perfusion during ictal SPECT is seen in the lateral frontal cortex (15), mesial frontal cortex (4) and precuneus (11).
Interictal epileptiform discharges (IEDs) are a characteristic feature of epilepsy, and may be captured during functional MRI (fMRI) studies with simultaneous scalp EEG; focal IEDs typically reveal focal blood flow change, coupled with a network of haemodynamic changes in other brain regions,33–35 including thalamic activation during focal discharges.36 Averaging across a group of subjects with mTLE, simultaneous EEG–fMRI showed activation correlated with IEDs in the mesial temporal lobe, insula and putamen, with deactivation in the posterior cingulate.37
Therefore, in mTLE, which may be regarded as an ‘archetypal’ focal epilepsy, there is a specific large scale brain network implicated interictally, which appears to be directly involved in generating the seizure; moreover, the pattern of network involvement correlates with the clinical pattern of the seizure. These brain networks prominently involve the thalamus and striatum as well as the mesial temporal and cortical regions.
Neuroimaging reveals brain network abnormalities in IGE
Idiopathic generalised epilepsies (IGE) are similarly ‘archetypal’ generalised epilepsies. Neuroimaging evidence suggests that a specific localised network is implicated in these epilepsies, rather than a generalised effect (see figure 2). Despite conventional wisdom that imaging is normal in IGE, structural abnormalities of the thalamus and frontal cortex have been found, although the nature of the abnormality has been variable: volume has been found increased38 or decreased39 ,40 in IGE with absences; in juvenile myoclonic epilepsy (JME) there may be thalamic atrophy41 ,42 and also abnormality of thalamic shape43; in IGE with generalised tonic–clonic seizures only, bilateral thalamic atrophy has been found.44 Frontal lobe cortical volume changes in JME have been found in several studies, but inconsistently: increased grey matter in mesial frontal regions42 ,45 or frontobasal regions,46 or decreased grey matter in mesial frontal regions47 or no change.48 Loss of transcallosal white matter connectivity has also been found using DTI,47 as well as increased structural and functional connectivity with motor and premotor regions.49 ,50 In IGE with generalised tonic–clonic seizures only, bilateral cortical atrophy in frontocentral areas has been found.44 Bilateral putamen atrophy has been found in IGE.51

A schematic summary of the brain network abnormalities seen in neuroimaging studies of patients with juvenile myoclonic epilepsy. This summary is based on considerably less evidence than available to construct figure 1 regarding mesial temporal lobe epilepsy. (A) Coronal section; (B) medial view of the left hemisphere; (C) axial section; (D) lateral view of the left hemisphere. Neuroimaging evidence again suggests a wide range of structural and functional network abnormalities. There is grey matter atrophy in the bilateral medial frontal cortex (1), bilateral medial parietal cortex (7) and bilateral striatum (4). There is loss of white matter connectivity in the anterior (3) and posterior (9) corpus callosum. The left hemisphere shows loss of connectivity between the anterior supplementary motor area (SMA) and anterior medial frontal cortex (13), loss of connectivity between the posterior SMA and primary motor cortex (12), gain of connectivity between the anterior SMA and primary motor cortex (6), gain of connectivity in the pyramidal tract (2) and gain of connectivity between the posterior SMA and occipital (10) and temporal (11) cortices; these findings have only been explored in the left hemisphere and it is not known if these abnormalities may be bilateral. During generalised EEG spike wave discharges captured during simultaneous EEG–functional MRI (fMRI), increased activity is seen in the bilateral thalamus (5), and decreased activity is seen in a number of regions, including the precuneus (7), medial frontal cortex (8), lateral parietal cortex (15) and lateral frontal cortex (14). BOLD, blood oxygen level dependent.
Simultaneous EEG–fMRI in patients with generalised spike wave discharges has revealed a pattern of thalamic activation and cortical deactivation,52 ,53 particularly posterior cingulate deactivation.54 Involvement of the caudate may also be seen.53 In both focal epilepsy and IGE, the so-called ‘default mode network’ (of which more below) is typically deactivated during discharges.34 ,35 ,55–57
Although the structural imaging evidence is less clearcut than in mTLE, evidence again points to the involvement of a specific cortico-striato-thalamic network in IGE.
Resting state fMRI reveals functional networks in the normal brain
So-called resting state fMRI is a major contributor to the new science of brain networks. fMRI has typically been used to detect blood oxygen level dependent (BOLD) signal change, reflecting localised blood flow changes, occurring during particular task conditions in behavioural fMRI studies. Increasingly, fMRI is being used in a task free ‘resting state’, with the aim of detecting brain regions which show spontaneous correlated activities, based on the assumption that functionally connected brain networks will show similar profiles of activity over time; a particularly fruitful approach has been to use independent components analysis to detect brain regions which share variance (ie, networks with similar profiles of activity over time). Typically, in adults, this approach reveals a small set of typical brain networks active during a task free ‘resting’ state, consisting of brain networks involved in motor function, visual processing, attention, auditory processing, memory and the so-called default mode network. The default mode network had previously been identified in task related fMRI as a set of brain regions active when tasks were not being performed.58 These networks are highly reproducible but differ with ageing and between genders.59 The set of spontaneously active networks seen in the ‘resting’ state corresponds extremely well to the networks revealed in a very large number of task related behavioural fMRI studies,60 suggesting that the apparently spontaneous brain activity reflects continuous operation of segregated brain networks responsible for various classes of sensory and behavioural tasks. Concurrent resting state fMRI and microelectrode recording in monkeys show a correlation between the slow fluctuations in BOLD (∼0.1 Hz) and slow fluctuations in neuronal firing rates and gamma band local field potentials,61 suggesting that resting state fMRI is related to physiologically relevant underlying neuronal processes.
Resting state fMRI functional networks are abnormal in epilepsy
In mTLE, functional connectivity in fMRI resting state networks seems to be abnormal, even in the interictal state. Decreased resting fMRI functional connectivity was found between mesial temporal lobe subregions in the ipsilateral mesial temporal lobe; relatively increased connectivity was seen in the contralateral mesial temporal lobe.62 Decreased functional connectivity was seen in the auditory and sensorimotor resting state networks whereas increased functional connectivity was seen in primary visual regions63 and decreased connectivity with dorsal attention network.64 In particular, there may be reduced functional connectivity between the default mode network and the mesial temporal region.65 ,66 In IGE, functional connectivity within fMRI resting state networks also seems to be abnormal. Most resting state networks show reduced connectivity compared with normals.67–69 One resting state network, involving motor regions and basal ganglia, showed increased functional connectivity compared with normals, and connectivity with caudate nuclei particularly increased during generalised spike wave discharges. Increased functional connectivity has been noted between the frontal lobes in absence epilepsy70; interestingly, in a rat model of absence, DTI shows reduced connectivity across the anterior corpus callosum,71 and an identical finding has been made in human JME.72 Reconciling these differences in functional versus structural connectivity is difficult, but in a different disease, amyotrophic lateral sclerosis, increased functional connectivity between hemispheres correlated with reduced structural connectivity.73
Models of the brain: explanatory and predictive power
The observations described above imply the involvement of large scale brain networks in epilepsy but do not provide any evidence of mechanisms; hypotheses arising from these observations need to be tested in models. An especially promising avenue is to use increasingly sophisticated computational brain models. A model is a way of structuring knowledge in order to provide a level of explanation that is not evident by simply examining data, and in order to create novel predictions that can then be tested empirically by new data collection. The necessity for computational modelling is that the brain is an exceptionally complex dynamic system. Generally, dynamic models attempt to isolate and simplify a system of the brain, aiming to explain dynamic mechanisms at a particular spatial and temporal scale. Static models aim to describe the structures and networks of the brain in which these dynamic processes operate; typically such models aim to localise brain functions and to identify and quantify connections between brain components. Static models of brain structures and their connections are typically used as the foundation of dynamic models. In particular, computational models enable observations made at one scale (eg, neuronal properties) to be explored at a different scale where observation would be difficult (eg, network behaviour of large numbers of connected neurons). Crucial to all approaches to modelling is the collection of high quality relevant data in experimental systems, on which computational models can be based, and in which hypotheses emerging from models can be tested.
Models of the brain inevitably are gross simplifications; if all of the details were known to construct a perfectly detailed model, then a model would not be necessary because the details would already be known. Fundamental decisions prior to constructing models include: considering the scale (eg, neurons versus whole brain networks); whether to include large numbers of parameters related to ionic conductances, cell types, etc, or to ‘lump’ many parameters together; and at what temporal scale to model (anywhere from the millisecond scale of action potentials up to years for seizure occurrence models).
Models of brain connections may examine anatomical connectivity (structural connections between brain regions), functional connectivity (correlations between measures from different brain regions which do not necessarily imply causation) and effective connectivity (directed effects of one region on another, which do imply causation)74; effective connectivity (such as dynamic causal modelling in fMRI) is an example of a dynamic model being explicitly based on a static model of brain connections. Bringing our understanding of epilepsy into the framework of brain networks is especially timely, given the current emergence of a new science of brain networks (‘connectomics’).75 It seems likely that the dynamic network nature of epilepsy is particularly well suited to exploration through a modelling approach that combines dynamic modelling and connectomics.
However, all models have limitations, and theoretical models are no exception. A model is only useful if its predictions are shown in real biological data to be correct. The aim of all modelling studies, whether experimental or theoretical modelling, is to explain underlying mechanisms and to suggest possible therapeutic modalities. It is not sufficient for a theoretical model simply to reproduce observed physiology—it must be able to inspire novel predictions and hypotheses which can then be tested in living systems. As with experimental models, a crucial limitation of theoretical models is uncertainty about their biological relevance, especially for human epilepsies (biological relevance might be regarded as ‘model validity’ although this is a difficult idea to define). It could be argued that it is extremely difficult to construct a theoretical brain model of seizure generation because so many parameters related to normal and pathophysiological mechanisms are unknown or difficult to measure, hence any theoretical model is bound to be inaccurate, incomplete and to contain incorrect assumptions. As a result, irrelevant mechanisms might be inferred from studying the model; conversely, physiologically important mechanisms might not be revealed. It is important to point out, however, that all of these criticisms apply equally to even relatively well understood experimental models of epilepsy.
Even if the particular theoretical model is able to provide testable predictions (regarding mechanisms, or diagnosis, prognosis and treatment response) the complexity of the theoretical model may be sufficiently challenging that the particular mechanisms producing the useful (predictive) model output may be difficult to understand. Nonetheless, theoretical models are often amendable to detailed exploration, which may reveal useful insights.
A substantial book summarising computational modelling approaches in epilepsy will provide the reader with a comprehensive account of this field76; brief accessible reviews provide helpful summaries.77–79
Modelling the dynamics of epilepsy
Theoretical models relevant to epilepsy often can generate a synthetic time series, which is created from a set of explicit equations governed by parameters that can be varied; such a model may be used to simulate the generation of EEG, for example. Models may be created to examine different spatial scales of a system (such as single channels or receptors, single neurons, neuronal networks or larger scale models of interactions between brain regions) and over a range of time scales—from milliseconds, relevant to neuronal networks, to years, relevant to patterns of occurrence of seizures and remission. Parameters of the equations governing these models reflect movements of ions through channels, action potential firing, synaptic phenomena and conduction delays between different regions; the model is often formulated as a set of differential equations coupled with time delays. Ideally, the parameters should be based on experimental data relevant to the epilepsy being modelled. Broadly, models may be very detailed, incorporating multiple neurons each with multiple ion conductances, synapses and connections to other neurons80–83 or, alternatively, models may assume that populations of neurons behave similarly, and hence many parameters can be lumped together.84–88 Detailed models can often be used to simulate EEG, and the ability to capture essential EEG phenomena (eg, detailed patterns of seizure onset and offset similar to real data) may be seen as evidence that aspects of the model are correct; ‘lumped’ models can often be explored in much more detail, especially to examine the full range of behaviours the model can generate with fixed parameters and the consequences of altering parameters of the system.
Such an approach can motivate specific hypotheses regarding the dynamics of the change in brain state that causes seizure onset. An analogy might be to imagine the patterns of a horse's locomotion when moving at different speeds. If a single parameter is gradually varied (speed), the horse will show a walking pattern at lowest speeds, trotting at slightly faster speeds, then as speed continues to increase will switch to canter and then gallop at the fastest speeds. These are qualitative and abrupt changes in the pattern of locomotion dependent on a control parameter (speed). At certain speeds, the horse might be able to switch between patterns of locomotion (for example, ‘trot’ and ‘walk’ might both be possible at a certain speed)—this would be an example of a bistable system, in which two states are possible without a change in parameters. In an analogous sense, there may be hidden subtleties in the way seizures could start, which exploration of the dynamics would reveal. It is possible that seizure onset is driven entirely by a change in a control parameter, which creates a change in dynamics from ‘normal state’ to ‘seizure’; a second possibility is that a change in a control parameter moves the brain from a normal state to a bistable state, in which both normal and seizure states can exist without any parameter change; a third possibility is that the brain exists constantly in a bistable state89; parameter changes and switching between the two states might be driven by external or endogenous factors, such as changes in the sleep–wake cycle or external sensory stimulation, such as photic stimulation.
Childhood absence epilepsy and TLE have been the subject of many modelling studies, largely because experimental animal systems provide much evidence to define model parameters,78 particularly the thalamocortical network which gives rise to 3 Hz spike wave discharges90–93 and the medial temporal structures associated with seizure onset in experimental animals with TLE. However, in TLE, it is not explained how activity apparently emerging in the mesial temporal lobe engages other brain regions to cause a clinically symptomatic seizure, although there is some evidence that normal sleep related phenomena coupling the hippocampus with the neocortex may be taken over by the abnormal synchronous discharges of temporal lobe seizures.94
Detailed computational models of generalised spike wave discharges include influential studies,82 ,95 suggesting the mechanism of initiation is in thalamocortical cells, although this may not fit more recent experimental evidence suggesting in a rodent experimental model that initiation is in the cortex.5 A ‘lumped’ model, incorporating three homogenous cell populations (thalamocortical neurons, thalamic reticular neurons and cortex) based on known connections between the thalamus and cortex96 was able to generate spike wave discharges following a change in system parameters,97 suggesting that an underlying slow change in brain state was required for seizure initiation. This is in contrast with an alternative model which suggests that in absence epilepsy, the brain exists in a bistable state, able to generate both normal activity and seizure discharges without any underlying change in parameters.98 Although it might appear that these are mutually exclusive explanations for seizure onset, our modelling work showed that both possible mechanisms for transition to seizure could exist in the same model.99 Although such models might seem arcane, understanding the mechanisms of transition to seizure is crucial: a treatment which prevents one route to seizure initiation might not prevent a different pathway to seizure initiation. Patients with epilepsies which seem identical might have different underlying dynamic mechanisms99 and hence require different treatment.
We have explored in detail a lumped model of corticothalamic interactions100 (see figure 3) and shown that in the model more than one mechanism of dynamic transition to seizures is possible: it may occur through a change in system parameters, or emerge from a bistable state.99 Subsequently, we showed that such a model could generate the range of spike wave shapes (including polyspike waves) often seen even in the same generalised spike wave discharge.101 Subsequently, we devised a method to fit the model to real EEG data, which provides a new opportunity to understand how system parameters change before, during and at the termination of a real seizure in a person with epilepsy.102 We showed that different seizures from the same subject tended to show very similar parameter evolution at the onset, during and at the termination of the seizure, and that these changes differed between subjects—this has the potential to classify epilepsies based on underlying mechanisms and to identify parameters that indicate treatment responsiveness. We have recently developed a novel approach to fit a model of temporal lobe seizures to intracranial EEG derived from patients with mTLE,103 thus allowing both IGE and focal epilepsies to be explored in similar ways.

An example of how theoretical models may enable data from different scales and different species to be integrated, in order to cast light on clinical data. (1) Experimental studies in rats with generalised spike wave discharges have allowed detailed electrophysiological data to be obtained from brain network regions involved in generating the seizure, including the cortex, thalamic reticular nucleus and thalamic specific nucleus. These data may be used to infer mechanisms, firing patterns and parameters of neurons and their connections which allow seizures to arise. (2) The pattern of connectivity, and various parameters from the experimental data, are used to create a theoretical dynamic model. This particular model (see Rodrigues and colleagues100 and Marten and colleagues101 for full details and explanation of the abbreviations) describes neuronal activity in terms of population level activity in the relevant brain regions, coupled according to known anatomy, and governed by parameters drawn from experimental data. (3) The model can be explored in detail, to understand its dynamics and the patterns of activity that can be generated—in this instance, a range of patterns of spike wave and polyspike wave EEG activity closely resembling seizures. (4) In order to cast light on the mechanisms of human spike wave discharges, real EEG data from patients can be fitted to the model, which allows specific parameters of the model to be identified which may play a role in the generation of the ictal discharge (see Nevado-Holgado and colleagues102 for more detail).
Graph theory: emerging technique to understand brain networks
Graph theory is a well established method for describing the global and local properties of networks, which has recently become a leading approach to investigating the brain,104 ,105 aided by a widely used suite of analysis tools, the Brain Connectivity Toolbox.106 A network consists of nodes (often termed vertices) which interact via connections (termed edges). In the case of the brain, networks can be constructed based on structural connections or functional connections. Brain networks may be examined at many spatial scales: nodes may be single neurons or brain regions; structural connections may be individual axons and synapses or larger scale white matter tracts; functional connections can be examined in terms of a multitude of interdependencies between electrical phenomena measured in different regions. Because it is based on the study of multiple interactions between many brain regions, graph theory has the potential to provide entirely novel information about brain function and dysfunction. A key concept in graph theory is the idea of ‘small world’, in which certain patterns of network allow any node of a network to be reached from any other node via a path which traverses very few edges and nodes but at the same time local connections between neighbouring nodes are strong. This combination of highly ordered local segregation of brain regions connected by relatively sparse long distance connections is typical of the brain, reflecting both functional segregation in specialised brain regions and functional integration at higher levels of brain function. Global network measures include clustering coefficient, a measure of the tendency for the network to form locally connected ‘cliques’; characteristic path length, which measures how many nodes must on average be passed through to travel from any one node to any other; and their ratio, the Small World Index. Small world networks are highly clustered but with short path lengths (ie, there are a small number of long distance direct connections between local clusters); randomly connected networks have short path lengths but little clustering; whereas a regular lattice (like a fishing net) is relatively highly clustered and has long path length (see figure 4). Patterns of connectivity can also be examined in terms of the modules or ‘community’ structure of the networks.107 Local measures of the network can identify nodes which are well connected (have high degree) as well as characterising the role of individual nodes in information flow in the network, through measures which characterise the role of nodes as crucial network hubs (such as betweeness centrality).

Graph theory enables global and local characteristics of networks to be identified and described. In (A), a set of network nodes (grey circles) are randomly connected (black lines). This pattern of connectivity is highly unlike the normal brain. Graph theory analysis shows that information could move quickly through the network from one node to many distant nodes, because there are many long range connections across the network. A commonly used graph theory metric ‘path length’ is used to describe how many network nodes need to be traversed on average to travel from a particular node to any other node in the network. A randomly connected network has many long range connections, hence a short average path length. On the other hand, there is very little clustering in this network—that is, neighbouring nodes tend not to be connected to each other. Local information processing in a network requires neighbouring nodes to be clustered together. In (B), the same set of network nodes is connected using the same total number of connections as in (A), but in this instance the connections construct a regular lattice. In this instance, average path length is long—to travel between any pair of nodes, typically many other nodes would have to be traversed because there are no long range connections. A lattice has high clustering and high path length. In (C), a few connections between neighbouring nodes have been re-connected to a randomly chosen node (connections indicated in red). This produces a network with high local connectivity (highly clustered) but short path length—the small number of long range connections provides short cuts between local clusters of nodes. This pattern is termed ‘small world network’ and is typical of the brain and many other naturally occurring networks.
A rapidly expanding literature is developing in this field, showing abnormalities of brain networks in various brain diseases. Of particular note is that in a study of monozygotic and dizygotic twins, network properties were shown to be genetically determined.108
Any network consists of nodes and edges (connections), therefore the initial challenge is to define nodes and connections in brain networks. Here I will confine attention to methods available for human brain studies. No ideal method exists to define the nodes for constructing brain networks. Most studies to date have either defined nodes anatomically using structural MRI and one of several automated anatomical labelling software, or have used the ‘peaks’ of brain activity in fMRI data. Some studies have divided grey matter randomly into multiple equal sized volumes distributed through the brain.109 EEG and magnetoencephalographic (MEG) studies often define the network in terms of electrodes or sensors, creating a network in sensor space rather than in brain space. Widely used graph theory metrics such as degree, centrality, small worldness, clustering coefficient and characteristic path length are dependent on the number of nodes and connections,110 ,111 so it is crucial to define these similarly across subjects being compared.
Defining connections or edges within a brain network is similarly challenging. Structural networks are typically modelled using DTI data. Connections between two regions can be quantified as the number of connections or probability of connection using probabilistic tractography,112 or in terms of diffusion parameters along a known connection. In groups of subjects, pairwise correlations between thicknesses of cortex in different brain regions may be estimated, and these pairwise correlations between all available pairs of regions used to create a network; such networks may be compared with random networks or compared between groups, to detect abnormalities.113 Functional connectivity, using data from fMRI, EEG or MEG, may be measured using essentially any measure of interdependence between each pair of nodes, such as correlation, coherence and so on.
Modelling the networks of epilepsy
A few studies have begun to apply these highly promising graph theory methods in epilepsy, although these earliest studies are far from reaching a consensus description of brain networks in epilepsy.
In a study of patients with IGE and generalised tonic–clonic seizures, networks of structural (DTI) and functional (resting fMRI) connections showed reduced small worldness and reduced network clustering compared with normal subjects, and abnormal hub nodes, especially in the thalamus, mesial frontal cortex, putamen and regions of the default mode network.114 These observations suggest that global characteristics of brain networks in IGE are abnormal, and that specific highly connected brain regions have abnormal connectivity patterns in IGE. Using MEG, patients with absence seizures showed increased clustering and node strength during interictal periods, compared with normals, in the alpha band.115 Graph theory methods can be applied to EEG from seizures, and compared with interictal periods. EEG networks become more lattice-like (increased clustering and path lengths) during absence seizures,116 suggesting that the normal patterns of connectivity in the brain are grossly altered during a seizure.
In TLE, brain network graphs were constructed from correlations between measures of cortical thickness in multiple brain regions.117 Compared with controls, patients showed increased path length and clustering and altered distribution of network hubs.117 Also in TLE, networks constructed from resting fMRI data showed increased connectivity, especially involving the temporal lobes, and more generally reduced clustering and shorter characteristic path lengths.118 In patients with TLE, interictal intracranial EEG showed reduced clustering and small worldness in patients with a longer duration of epilepsy.119 These observations suggest that global characteristics of brain networks in TLE are abnormal and that specific highly connected brain regions have abnormal connectivity patterns in TLE, reflecting similar observations in IGE described above.
In patients with neocortical focal seizure onsets studied with intracranial EEG, the seizure onset zone in the interictal period showed decreased connectivity with surrounding brain regions120; this is in contrast with other studies which found increased connectivity in and around the seizure onset zone.121 ,122 Ictally, there is evidence that synchronisation around the seizure onset zone decreases prior to focal onset seizures.123–125 Using graph theory approaches, EEG networks become more lattice-like (increased clustering and path lengths) during and focal onset seizures,125 ,126 suggesting that the normal patterns of connectivity in the brain are grossly altered during a seizure, as also seen in IGE.
Modelling brain dynamics in brain networks based on real data
Although describing the global and local patterns of connectivity in models of brain networks might be interesting, its relevance to understanding the mechanisms of epilepsy is not immediately apparent. A potentially fruitful direction will be to couple dynamic models to network models in order to ‘bring the network to life’ and understand how the pattern of functional interactions determines the dynamics emerging from the network, particularly to understand how seizures emerge from the network. In principle, this might provide a way to understand how and whether seizures can emerge as a result of focal abnormality in a grey matter region, or as a result of an abnormality of white matter connections, or both.
Modelling the dynamics of brain networks causing epilepsy has been successfully undertaken at the small spatial scale. Detailed modelling of networks of neurons, which generate phenomena very similar to electrocorticography, has explored how parameter changes give rise to abrupt dynamic transitions, particularly parameter changes related to connectivity between neurons.127 Using a detailed model of networks of neurons and their connections, it has been found that there is a set of conditions under which seizure-like activity emerges, dependent on the relative proportion of long range connections between neurons, and subsequent patterns of clustering, path length and small worldness128; relatively small alterations in these patterns of connectivity moved the system from ‘normal’ behaviour to ‘seizing’. Although the results emerging from these detailed models are specific to the systems modelled, the underlying approach—to combine explicit dynamic models with information about network structure from real data—can readily be applied to large scale brain networks.
Dynamic network models have been little applied to neuroimaging in epilepsy. In a single mTLE case, EEG–fMRI identified BOLD signal corresponding to interictal discharges in temporal and occipital regions. Dynamic causal modelling, which combines a biophysical model of how BOLD fMRI signal is generated from neuronal activity with a statistical method to select likely connectivity patterns, revealed that the temporal lobe region drove activity in the remote occipital region, and using DTI a specific anatomical connection between these regions was identified.129 A similar approach was taken to the network of brain regions showing BOLD activity during generalised spike wave discharges in IGE.130 Dynamic causal modelling suggested that a region of medial parietal cortex drives generalised spike wave onset.130 This finding has parallels with EEG and MEG source localisation techniques, which have shown the origin of generalised spike wave in the medial cortex although usually more anteriorly.131–133
We have recently combined brain networks derived from real EEG data of patients with IGE and normal subjects with a dynamic model which incorporates a bistable state (allowing normal activity and seizure-like activity). We showed that the network structure based on IGE patient data displayed an abnormal tendency to become rapidly synchronised, generating seizure-like synchronised activity throughout the network.134
The future
Clinical studies and experimental research in epilepsy have produced a substantial description of a set of human epilepsy disorders and a range of experimental epilepsies, some of which may be directly relevant to human epilepsy. Nonetheless, we are far from a full mechanistic description of any epilepsy disorder. Substantial evidence points to the involvement of specific brain circuits in epilepsy, and that these circuits or networks are not just local microscale phenomena but are large scale networks involving brain regions at a distance from one another (including specific cortical regions, thalamus, striatum) and their connections. Sufficient data exist to motivate the creation of biologically inspired dynamic models, and to explore these models for unexpected emergent properties in a way that is not feasible in biological systems, and to understand the mechanisms that allow seizures to emerge in the model. Sufficient data also exist to motivate creation of simplified models of brain connections, and to describe the properties of the networks globally and locally.
Although in principle any brain disease could be studied in this way, epilepsy seems the most compelling choice—the brain in epilepsy moves dynamically between seizure and normal states, hence dynamic modelling is highly appropriate; and seizures have their clinical expression through their emergence in large networks, therefore establishing the epilepsy specific properties of such networks is crucial. Combining dynamic models of specific brain regions and connecting these regions according to the appropriate network structure will be an important step towards a more comprehensive mechanistic explanation of epilepsy.
What could such models provide that we do not already have? An important step forward would be to identify the common pathways and mechanisms that exist in epilepsies that seem to have a different basis genetically or in experimental models. For example, why does one particular patient with hippocampal sclerosis have seizures identical to a different patient with a small tumour in the mesial temporal lobe? The microscale disturbances of neuronal function and connections related directly to the cause are certainly different between these different patients, but these different mechanisms converge on a common pathway. This common pathway might be very difficult to identify without constructing a model that could encompass the differing microscale mechanisms of seizure onset, and allow common emergent mechanisms at a different scale to be seen. The existence of antiepileptic drugs which treat epilepsies of many different causes is evidence of some common mechanisms across different causes of epilepsy, but these are little understood currently. A second important step would be to provide a basis for classifying epilepsies through description of mechanisms revealed in the model—for example, epilepsies might be classifiable based on the dynamic mechanisms of seizure onset or by the mechanism which allows a localised onset to engage large scale brain circuits. A third important step would be to explore in the model the effects of treatment, or even to design new treatments based on investigation of the model. To take one example, deep brain stimulation is a potential new treatment for epilepsy, but there is no consensus about the optimal site, intensity and frequency of stimulation; a well constructed model would allow a very wide range of stimulation parameters to be explored, in a manner unfeasible in a clinical trial. Another example would be to improve epilepsy surgery, perhaps identifying in some patients that cutting a specific connection or making a minimal local resection in a crucial network node would be sufficient to stop seizures. A fourth step would be to introduce a way to predict drug treatment response: if a specific mechanism were identifiable in a model this might predict responsiveness to a specific drug, and fitting parameters to data from a patient might show that certain key parameters had or had not changed in response to a new treatment, which could indicate whether the new treatment is affecting the therapeutic mechanism as expected.
Well developed computational dynamic models of epilepsy exist already, and are constantly being further developed; the tools of brain connectomics are rapidly developing, and this new science is making new insights into brain function and dysfunction. The marriage of dynamic models and connectomics models in the investigation of epilepsy mechanisms will be productive.
References
Supplementary materials
Mark Richardson discusses his ideas in the JNNP podcast.
Footnotes
-
Competing interests None.
-
Provenance and peer review Commissioned; externally peer reviewed.