Article Text

Abstract
Background Neighbourhood deprivation has been shown to be inversely associated with mortality 1 month after stroke. Whether this disadvantage begins while patients are still receiving acute care is unclear. We aimed to study mortality after stroke specifically in the period while patients are under acute care and the ensuing period when they are discharged to home or other care settings.
Methods Our sample includes 1760 incident strokes (mean age 75, 48% men, 86% ischaemic) identified between 1998 and 2010 by the population-based stroke registry of Dijon (France). We used Cox regression to study all-cause mortality up to 90 days after stroke occurrence.
Results Overall, 284 (16.1%) patients died during the 90 days following stroke. Prior to stroke, risk factors prevalence (eg, high blood pressure and diabetes) and acute care management did not vary across deprivation levels. There was no association between deprivation and mortality while patients were in acute care (HR comparing the highest to the lowest tertiles of deprivation: 1.01, 95% CI 0.71 to 1.43). After discharge, however, age and gender adjusted mortality gradually increased with deprivation (HR 2.08, 95% CI 1.07 to 4.02). This association was not modified when stroke type and severity were accounted for.
Conclusions The gradient of higher poststroke mortality with increasing neighbourhood deprivation was noticeable only after acute hospital discharge. Quality of postacute care and social support are potential determinants of these variations.
Statistics from Altmetric.com
Introduction
Interest has recently grown on the influence of socioeconomic status (SES) on poststroke mortality. Early work by Kapral et al1 in Canada has shown that stroke patients living in deprived neighbourhoods experienced a bad outcome. Most (but not all2–5) other studies using individual,6–8 neighborhood9–12 or both13 SES indicators have confirmed such associations. Variations in design, setting and SES indicator may explain these discrepancies. For instance, some studies were not able to adjust for initial stroke severity, an important predictor of survival which has been shown to vary according to SES.14 Although conventionally used in this field of research, 28-day case fatality has the limit of amalgamating an initial period of time spent in acute care and, after discharge, time spent at home or in other care settings. Mortality is higher soon after stroke occurrence and consequently most stroke related deaths occur while patients are in acute care. Since some determinants of the SES stroke case fatality association may be related to the appropriateness of acute or of postacute care, studying mortality specifically in each setting seems appropriate.
France provides universal access to primary and hospital care. We have previously demonstrated an inverse SES stroke incidence gradient based on the analysis of the stroke registry set in the urban area of Dijon.15 Using this source of information, we investigated whether stroke severity, process of acute care, mortality in acute care and mortality postdischarge up to 90 days after stroke varied across SES levels.
Material and method
Case ascertainment and follow-up
Our study population comes from the longstanding stroke registry set in the city of Dijon (151 000 population), north east France. The present study involved only first-ever stroke occurring among residents aged 40 years or more during 1 January 1998 to 31 December 2010. The Dijon Stroke Registry is a population-based study that strictly complies with the criteria for the ‘ideal’ stroke incidence studies.16 Case ascertainment has been described elsewhere.17 ,18 Briefly, the procedure relies on multiple overlapping sources of information to identify fatal and non-fatal stroke in hospitalised and non-hospitalised patients. These sources include computerised and medical records from the university hospital and from the three private hospitals located in Dijon; collaboration with general practitioners and private radiological and Doppler ultrasound centres; and regular checking of death certificates at the Regional Health Agency. Stroke is defined according to WHO diagnostic criteria.19 Regular adjudication meetings are held in order to decide on cases with incomplete or conflicting information. The Dijon Stroke Registry complies with the requirements regarding data protection and has received approval from the French Institute for Public Health Surveillance (INVS).
Vital status of all cases entered in the Registry is regularly ascertained by study investigators using several overlapping sources of information: monthly review of the list of inhospital deaths from the university hospital; monthly review of all death certificates obtained from the Regional Health Agency; annual review of the national register of death; and annual check of town council death registry. For this study, survival up to 90 days was considered.
Demographic and clinical covariables
Demographics and clinical features recorded at stroke onset include age, gender, hypertension (history of high blood pressure or antihypertensive treatment), diabetes mellitus (glucose level ≥7.8 mmol/L or insulin or oral hypoglycaemic treatment), hypercholesterolaemia (total cholesterol level ≥5.7 mmol/L or lipid-lowering therapy), smoking status (current vs not) and alcohol intake (≥3 units a day in men and ≥2 in women). Patients with former myocardial infarction, angina, peripheral vascular disease or heart failure were classified as having history of cardiovascular disease. For all hospitalised patients, the records also include information on admission in neurology, brain imaging and other investigations, length of stay in acute care, Rankin score at discharge and destination following discharge.
Assessment of stroke severity
Since systematic recording of the NIH stroke score was only introduced in 2006, we constructed an alternative severity score by combining three variables: consciousness (0 for normal, 1 for altered and 2 for comatose), motor deficit (1 if present) and aphasia (1 if present). This alternative severity score was correlated with the NIH score (correlation coefficient=0.57). It also showed a fair discriminating power for death in the first week, as indicated by Harrell's c statistic, which corresponds to the area under the receiver operating curve (c=0.77, 95% CI 0.72 to 0.81).
Neighbourhood SES
Because we relied on area of residence to indicate SES, we excluded patients who had moved in a nursing home prior to stroke onset. All remaining cases addresses were matched to one of 61 neighbourhoods within the town of Dijon. These neighbourhoods correspond to IRISs (Ilots Regroupés pour l'Information Statistique), the smallest geographical aggregate (average population ∼2500) used by the French National Statistical Office. We used the Townsend deprivation score to determine the socioeconomic level of each neighbourhood. The Townsend score is an established measure based on four census-based variables: percentages of unemployed, non-car ownership, non-home ownership and overcrowded household.20 Because the physical and social environment was likely to have evolved during the 13-year study period (1998–2010), Townsend scores were derived for each neighbourhood using data from the two available population censuses (1999 and 2006). We first calculated the 1999 and 2006 scores for each neighbourhood and then combined them into a single score using a weighting of 5/13 and 8/13, respectively. The final scores thus reflect an average deprivation level giving more weight to the 2006 estimate because of its proximity to the midpoint of the study period.
Statistical analysis
We first described neighbourhoods and patients characteristics and tested for trend across the three tertiles of neighbourhood deprivation. These tertiles were also used to compare Kaplan–Meier cumulative mortality estimates. We then used Cox proportional hazards regression to estimate hazard ratios (HRs) and 95% CIs for all-cause mortality according to neighbourhood SES. To account for the grouping of patients in neighbourhoods, we first fitted shared frailty models with a random effect at IRIS level. Since these models showed no significant within group correlation, we carried the analysis using simple Cox models with a robust variance estimator accounting for the clustering of participants living in the same neighbourhoods. We tested the proportional hazards assumptions using Schoenfeld residuals. In some models, the assumption was violated for gender and stroke type (coded as ischaemic vs non-ischaemic) and these variables were therefore adjusted for via stratification. We first analysed survival over the whole follow-up time and then carried out separate analysis for deaths occurring while patients were in acute care and for deaths occurring in the period following acute care. In the latter models, we kept the starting point of analysis time as the date of stroke occurrence in order to better account for varying lengths of stay in acute care.21 We fitted models with age and gender as covariates, and then added stroke type and severity. In models involving less than 50 events, severity was entered as a binary variable (severity >2 vs 2 or less) so as to avoid over-parameterisation. Analyses were performed with STATA (V.11.2). All p values are two tailed.
Results
There were 1847 incident stroke cases who were living at home recorded in the database for the period 1998–2010. We excluded those aged under 40 (n=61) and 15 cases (<1%) whose addresses could not be geocoded. A further 11 cases whose homes were located in two non-residential IRIS within Dijon were excluded since the SES level of these neighbourhoods cannot be estimated. This left a total of 1760 incident stroke cases distributed in 61 neighbourhoods.
Mean age of cases was 75 years; 849 were men (48%) and 1511 (86%) had an ischaemic stroke. The demographic, risk factors, stroke and care profiles of these patients are shown in table 1. There were no significant variations across tertiles of deprivation in prevalence of risk factors, stroke severity, stroke type, admission in acute care and destination after discharge. However, increasing level of deprivation was associated with younger age and longer stay in acute care. Other available indicators of process of care, such as brain imaging, echocardiography or ultrasound Doppler of the cervical arteries while in acute stay did not vary across deprivation groups (not shown). The same applied to thrombolytic therapy administered to 42 out of 475 (8.8%) ischaemic stroke patients admitted in acute care between 2007 and 2010.
Main characteristics of incident stroke cases in the city of Dijon (France) during 1998–2010, according to level of deprivation of the neighbourhood of residence
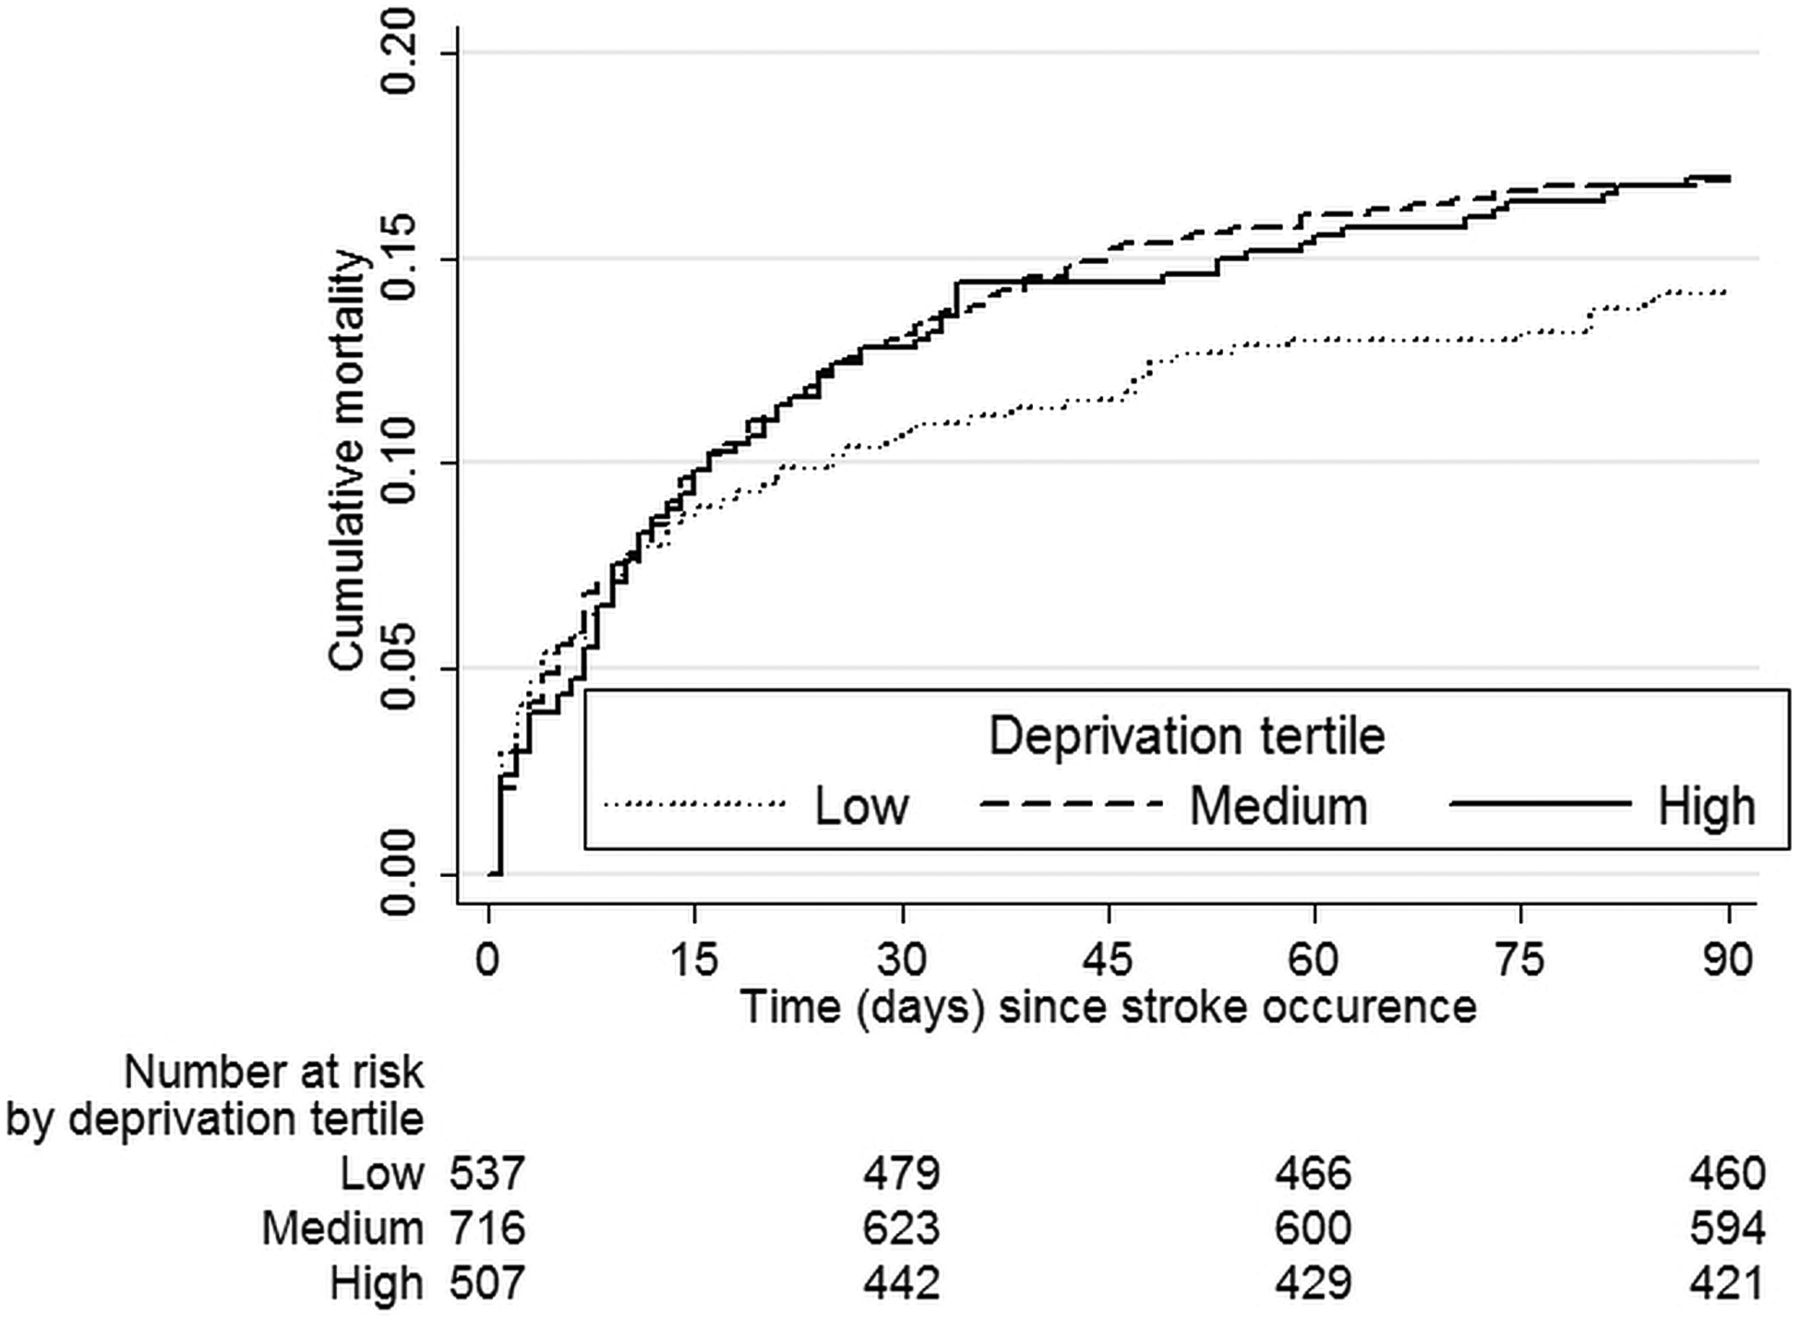
Follow-up was virtually complete since only two patients discharged alive from acute care were censored due to unknown vital status afterwards. Overall, 284 patients (16.1%) died during the 90-day period following stroke, most of them while in acute care (221, 77.8%). The Kaplan–Meier cumulative mortality curves increased sharply for all patients in the 2 weeks after stroke occurrence, slowed down afterwards and particularly so for patients living in the lowest tertile of deprivation (figure 1). Although the failure curves of the medium and highest deprivation groups overlap, mortality risk adjusted for age suggested a continuous increase across tertiles of deprivation (figure 2).

Mortality following incident stroke according to deprivation level of the area of residence. Dijon Stroke Registry, 1998–2010.

Age adjusted risk of death within 90 days after stroke according to deprivation level of the area of residence. Dijon Stroke Registry, 1998–2010.
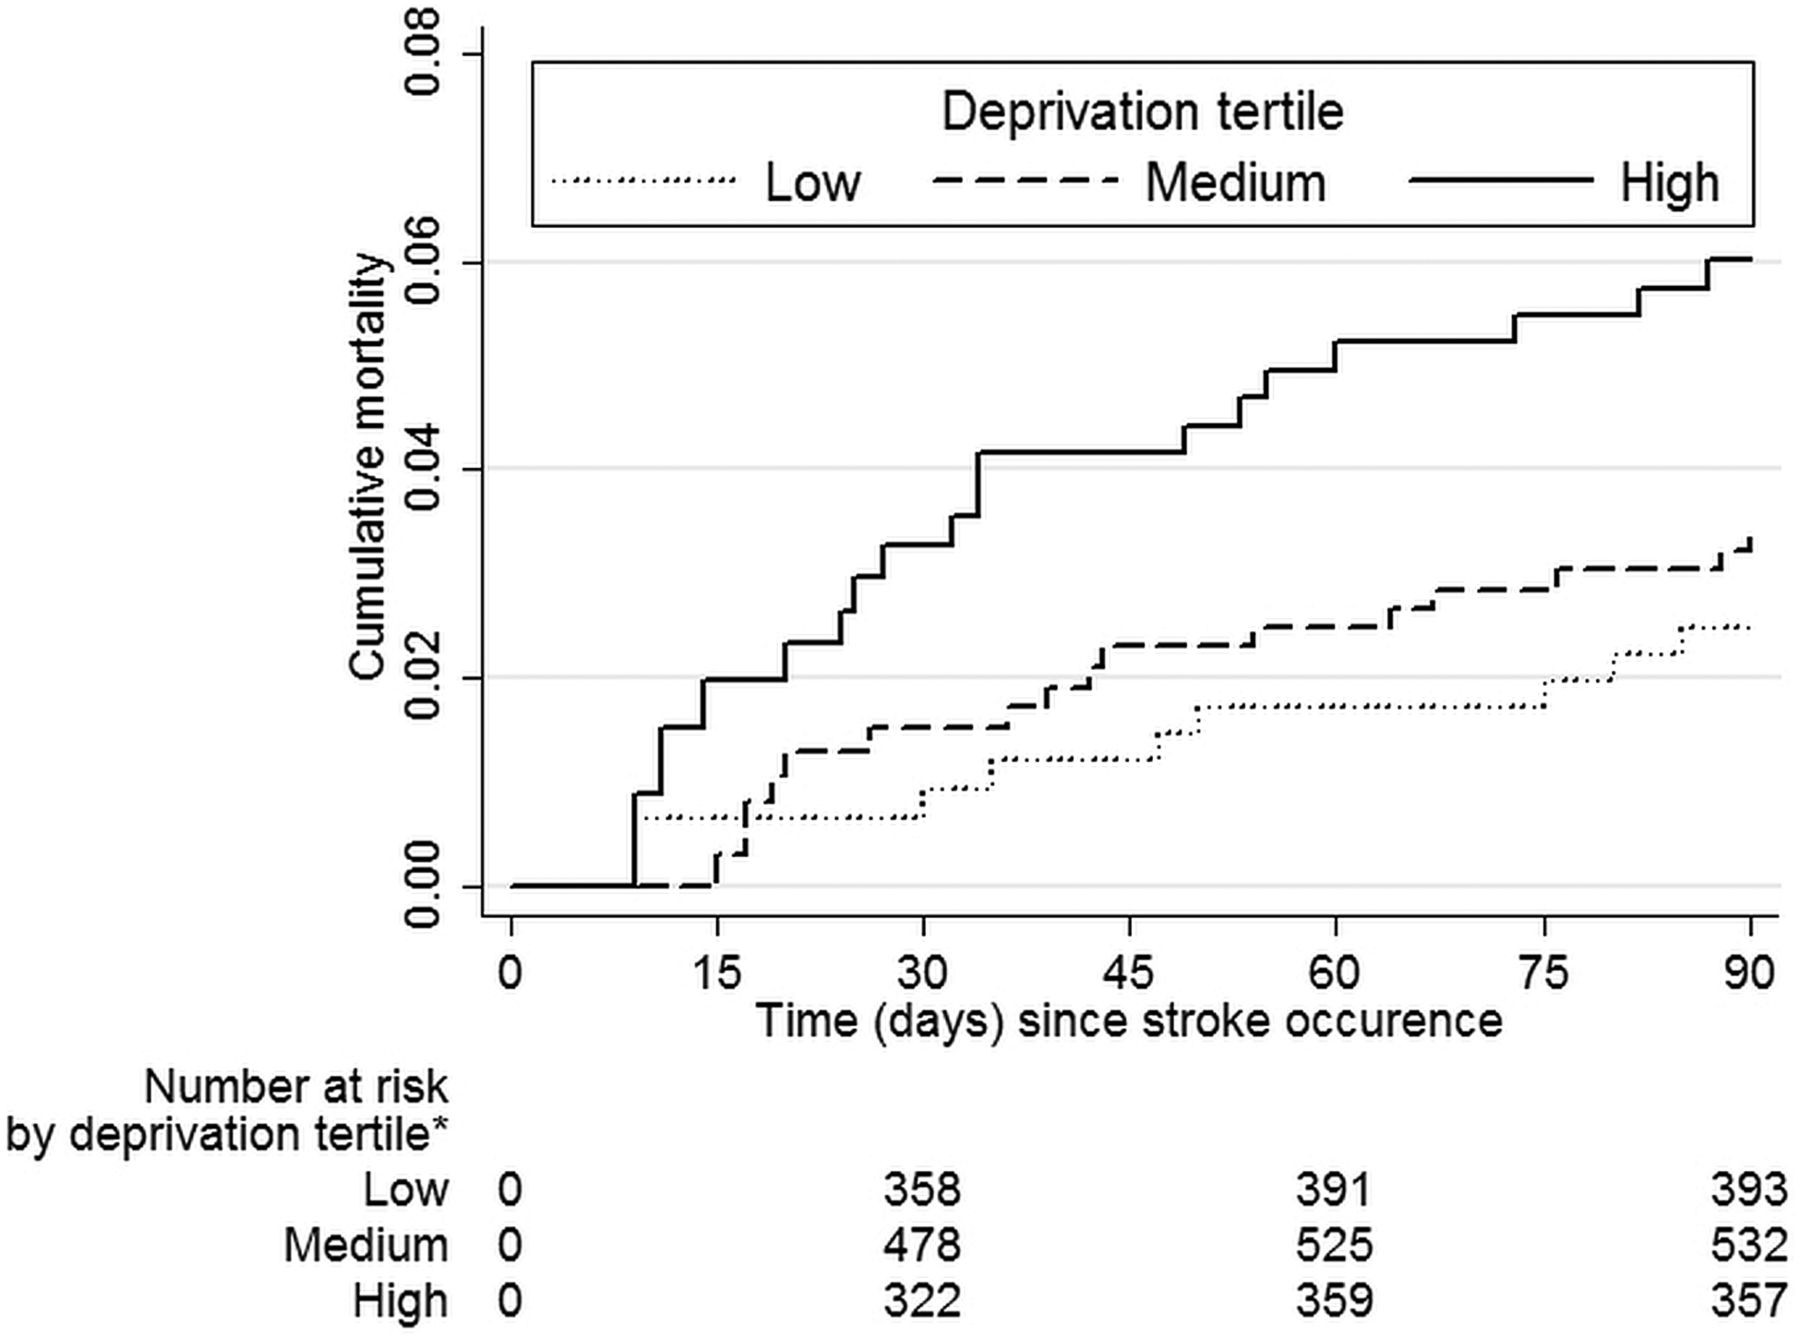
For ease of interpretation, results from the multivariable analysis in table 2 are presented as risk of death in the highest relative to risk of death in the lowest tertile of deprivation (ie, a 6.6 unit increase of the deprivation score corresponding to the difference of average scores shown in table 1). Thus, based on all follow-up time, moving from an average lowest third neighbourhood to an average one in the highest third was associated with a 32% (95% CI 0 to 73%) increase in age and gender adjusted risk of poststroke mortality. The association was more pronounced when stroke type and severity were accounted for (43% increase; 95% CI 7% to 89%). There was no discernible association however regarding risk of death while under acute care. In contrast, the risk of death in neighbourhoods of the highest compared with those in the lowest tertile of deprivation more than doubled in the period following discharge from acute care (see also Kaplan–Meier cumulative mortality estimates across deprivation tertiles in figure 3). Accounting for stroke type and severity did not modify this association. Results were not significantly modified when adjusting for risk factors (HR adjusted for risk factors shown in table 1: 2.17; 95% CI 1.08 to 4.37) or when the analysis was restricted to ischaemic stroke (HR 2.46; 95% CI 1.18 to 5.16). None of the patients who received thrombolysis and were discharged from acute care deceased in the ensuing follow-up period.
Associations between neighborhood deprivation and mortality up to 90 days following incident stroke. Dijon stroke registry, period 1998–2010.

Poststroke mortality following discharge from acute care according to deprivation level of the area of residence. Dijon Stroke Registry, 1998–2010. *Numbers at risk increase with time since increasing numbers of patients are discharged from acute care.
Among the 1324 patients discharged from acute care, most deaths (26/41 or 63%) occurred in the group of 269 patients sent in nursing homes or convalescent hospitals. Being discharged to these settings as opposed to home or rehabilitative care was strongly associated with a higher risk of death (age adjusted HR=6.60, 95% CI 3.41 to 12.78). The positive association between neighbourhood deprivation and postacute care mortality did not vary according to discharge destination (p for interaction=0.37).
Discussion
Other studies have shown that low neighbourhood SES is associated with higher mortality 1 month after stroke.1 ,7 ,8 However, for most patients, the first month following stroke amalgamates a 1–2-week period in acute care followed by a period at home or in other care settings. The original contribution of our study is that, at least in Dijon, the low neighbourhood SES disadvantage is evident only in the latter period. After discharge from acute care, mortality risk more than doubled in poorer compared with most affluent neighbourhoods. These variations are likely to result from a complex mix of determinants which we will discuss under the three following categories: patient related, care related and contextual determinants.
Among the patient related characteristics, age is the only one that varied significantly across neighbourhood SES in our sample. Younger age of stroke patients in disadvantaged neighbourhoods is the mere reflection of the higher stroke incidence in these areas, as was previously shown.15 Since our models adjusted for age, our results should not be affected by this difference which would have otherwise ‘favoured’ patients residing in deprived neighbourhoods. Other patients’ characteristics such as risk factor prevalence or stroke initial severity did not vary across neighbourhood SES, suggesting that they are unlikely to determine the mortality gradient observed in Dijon. Although this result is in line with that of Kapral et al,11 stroke severity has been shown to vary across neighbourhood SES in a large study from the USA14 and therefore cannot be ruled out as a contributing factor to the neighbourhood SES mortality gradient. It is also possible that other unmeasured individual characteristics, such as other than cardiovascular comorbidities or more generally frailty of older stroke victims, vary across SES. Frailty has been shown to affect about 25%–40% of those aged 80 years or older and is inversely associated with education.22 ,23
Variations in access and quality of care could also determine the SES gradient. Unfortunately, our dataset is limited for exploring this hypothesis. From available information, we could not see differences in access to neurology ward, uses of MRI scan or other investigations across neighbourhood SES, as would be expected in the context of the French universal healthcare system. However, this does not exclude more subtle differences regarding access to specialised care and timeliness of investigations or interventions. Between 1983 and 1992 in Finland, patients with higher income or education were more often taken care of in a university hospital and more likely to undergo CT or MRI scan.8 More recently, patients from Ontario residing in high income neighbourhoods arrived faster to hospitals, were more likely to be admitted in a stroke unit,24 to have a neurologist as the most responsible physician11 and to receive inhospital physiotherapy.1 Less optimal acute care for lower SES patients was identified in Denmark.7 It is likely that this pattern also applies to postacute care. Such differences may explain part of, but probably not all, the SES gradient in stroke outcome.11 Because highly specialised care and novel effective interventions are often rare commodities, some level of choice or of selection of patients is bound to happen. Attention should be given to the reasons why this process seems to generate social inequalities in countries with universal access healthcare systems. Residential proximity of high SES patients to specialised care may be one of them, but is unlikely to have applied within the medium size city of Dijon.
The third category of determinants that we labelled as ‘contextual’ encompasses a large array of characteristics. Given the ecological design of our analysis, the associations that we identified may reflect a combined effect of the patients and care factors discussed above, as well as specific effects of the physical and social environments where patients lived and worked. Based on a cohort study and using both individual and contextual level variables, findings from Brown et al support the hypothesis that adverse contextual conditions are specifically detrimental to long term (1 year) mortality after stroke.13 Although we could not adjust for individual level variables (such as education), our results provide an interesting insight in as much as the SES gradient seems to apply whether patients were discharged to home or rehabilitative care or nursing home following acute care. Therefore, the physical and social aspects of the home environment cannot be blamed alone for the excess mortality identified among patients living in poorer neighbourhoods. This argument strengthens the case for an influence of other factors such as presence, access and support from family members, friends and health professionals, all of which could reach higher levels for patients residing in richer neighbourhoods.
Limits of our study include absence of data on individual level SES since education, income and employment status have been shown to be associated with stroke outcomes.6–8 However, because a group level SES variable necessarily represents the average of a range of individual and contextual socioeconomic circumstances, our findings are likely to underestimate the strengths of association between stroke outcome and specific SES indicator (eg, individual education or income). Residual confounding due to imprecise adjustment for severity is also possible. If, as shown in another study, strokes were more severe in poorer neighbourhoods of Dijon, our results would again underestimate the association between SES and stroke outcome. The major strengths of this study are the continuous prospective ascertainment of all stroke cases in a geographically defined population and active tracing of vital status with virtually complete follow-up to 90 days. By concentrating on a fairly homogenous population, mostly taken care of in one hospital, we avoided other sources of variations that are present in studies based on large databases.
It is worthwhile setting our results in the wider perspective of poststroke outcomes. Because it applies to a period when mortality has peaked off, the high relative risk that we identified in the postacute care period translates into a modest absolute risk: 18 deaths would have been prevented during the study period if mortality rates of the lowest deprivation group applied to all neighbourhoods. Although this may seem a small absolute benefit, it still represents nearly half of deaths occurring after discharge from acute care (18/41 or 44%). Other stroke outcomes such as disability, dependency and handicap have been shown to be worse in patients with lower SES.6 ,12 ,25 ,26 If a similar gradient that we have identified for mortality also applies to other more frequent outcomes, significant health benefits could accrue from reducing these inequalities.
Stroke represents an iconic example of a chronic disease whose management demands reactivity and coordination of the entire health system. Primary, secondary and tertiary healthcare as well as social services and informal carers are, to variable extents, involved in the management of chronic diseases. High individual performance as well as good coordination are required from all these components of the care pathway in order to guarantee best possible outcome to all patients whatever their clinical and social circumstances. Regarding stroke, our results suggest that specific attention should be given to the transition from acute to rehabilitative and social care by those responsible for planning and delivering care.
References
Footnotes
-
Contributors OG, YB and MG formulated the study objectives. OG and EL designed and implemented the analysis plan. JD extracted the data from the Dijon Registry and geocoded the information. RA and BL prepared the socioeconomic area indicators and carried out initial analysis of the data. OG performed the final analysis and drafted the manuscript. EL, YB and MG reviewed and commented on successive versions of the manuscript. All authors have approved the final version of the manuscript. OG is the guarantor of the study.
-
Funding The Dijon Stroke Registry is funded by the University Hospital and the Faculty of Medicine of Dijon, the Burgundy Health Agency, Burgundy Regional Council and University of Burgundy, Inserm, and the Institut de Veille Sanitaire. There was no involvement of the Dijon Registry sponsors at any stage of this study.
-
Competing interests None.
-
Provenance and peer review Not commissioned; externally peer reviewed.