Article Text

Abstract
Background Awareness to neurocognitive issues after mild traumatic brain injury (mTBI) is increasing, but currently no imaging markers are available for mTBI. Advanced structural imaging recently showed microstructural tissue changes and axonal injury, mild but likely sufficient to lead to functional deficits. Magnetoencephalography (MEG) has high temporal and spatial resolution, combining structural and electrophysiological information, and can be used to examine brain activation patterns of regions involved with specific tasks.
Methods 16 adults with mTBI and 16 matched controls were submitted to neuropsychological testing (Wechsler Abbreviated Scale of Intelligence (WASI); Conners; Alcohol Use Disorders Identification Test (AUDIT); Generalised Anxiety Disorder Seven-item Scale (GAD-7); Patient Health Questionnaire (PHQ-9); Symptom Checklist and Symptom Severity Score (SCAT2)) and MEG while tested for mental flexibility (Intra-Extra Dimensional set-shifting tasks). Three-dimensional maps were generated using synthetic aperture magnetometry beamforming analyses to identify differences in regional activation and activation times. Reaction times and accuracy between groups were compared using 2×2 mixed analysis of variance.
Findings While accuracy was similar, patients with mTBI reaction time was delayed and sequence of activation of brain regions disorganised, with involvement of extra regions such as the occipital lobes, not used by controls. Examination of activation time showed significant delays in the right insula and left posterior parietal cortex in patients with mTBI.
Conclusions Patients with mTBI showed significant delays in the activation of important areas involved in executive function. Also, more regions of the brain are involved in an apparent compensatory effort. Our study suggests that MEG can detect subtle neural changes associated with cognitive dysfunction and thus, may eventually be useful for capturing and tracking the onset and course of cognitive symptoms associated with mTBI.
- BRAIN MAPPING
- HEAD INJURY
- COGNITIVE ELECTROPHYSIOLOGY
This is an Open Access article distributed in accordance with the Creative Commons Attribution Non Commercial (CC BY-NC 4.0) license, which permits others to distribute, remix, adapt, build upon this work non-commercially, and license their derivative works on different terms, provided the original work is properly cited and the use is non-commercial. See: http://creativecommons.org/licenses/by-nc/4.0/
Statistics from Altmetric.com
Introduction
Mild traumatic brain injury (mTBI) represents up to 90% of all brain injuries.1 Although the majority of patients recover well, up to 30% will suffer with persistent neurocognitive, affective and psychological symptoms.2 The pathophysiological processes behind these symptoms are not clear, and the heterogeneity of this condition has made it a challenge for diagnosis, assessment and treatment. Management is further complicated by lack of objectivity in assessing initial damage, association with litigation/compensation issues, occasionally malingering, unclear treatment options and effects.3
Despite symptoms, routine imaging (CT and MRI) is frequently normal or non-specific.4 Although structural abnormalities can be seen in a small percentage of patients with mTBI (mostly small subdural haematomas and/or subarachnoid haemorrhage), these observations are non-specific and do not correlate with symptoms.2 Advances in neuroimaging, especially MRI techniques, allowed identification of a subgroup of patients with mTBI with morphological changes at a microscopic level,5–7 suggesting that neural dysfunction experienced after an apparently mild injury is related to more than just transient disruption.
Diffusion tensor imaging (DTI) is the best-established MRI technique in mTBI research, measuring axon integrity by analysing water diffusion.8–10 Although the use of functional imaging might increase sensitivity for detecting abnormalities11 and could help to predict outcome in patients with mTBI,12 none of these methods have shown to correlate well with neurocognitive deficits postinjury.2
Magnetoencephalography (MEG) is an advanced imaging modality dedicated to the detection of magnetic fields produced by brain activity. Briefly, the development of superconductors in the late 60s allowed the development of highly sensitive magnetic detectors, SQUIDS (superconducting quantum interference device), capable of measuring the extremely small magnetic signal generated by neuronal firing, while handling environmental noise.13 MEG combines high spatial and temporal resolution of functional MRI (fMRI) and electrophysiological measurements (EEG) and it has been used in few series of patients with TBI.14–17 Huang et al,14 in a small series of mild TBI patients submitted to resting state MEG, suggested an anatomical and functional correlation between abnormal slow waves and mild axonal injury identified with DTI. Tarapore et al16 in a heterogeneous series (mild, moderate and severe TBI) suggested that resting state MEG can detect abnormal connectivity after TBI, even in patients with milder degrees and normal MRI findings.
Patients with mTBI might have multiple symptoms, including a variety of physical, emotional and neurocognitive issues such as headache, irritability, anxiety, depression, insomnia, fatigue and difficulty concentrating, dizziness and sleep disturbances, memory and attention deficits.18 Often, individuals with previous mTBI report difficulties when required to shift from one task to another. This is an important cognitive ability that underlies mental flexibility, that is, the capacity of adaptation of cognitive plan to a changing environment, one of the core features of executive functioning. This ability is related primarily to the frontal lobes but fMRI demonstrated activation of brain areas in prefrontal, frontal and posterior cortical regions during execution of this task.19–21
Mental flexibility can be tested with set-shifting tasks, being the classic example the Wisconsin Card Sort Task (WCST).22 However, it is difficult to separate neural activation related purely to set-shifting task from other cognitive processes involved in the WCST, for example, memory, inhibition, decision-making, and reasoning.20
An alternative to the WCST is the attentional set-shifting Intra-Extra Dimensional (IED) Set Shift Test (Cambridge Neuropsychological Test Automated Battery—CANTAB, Cambridge Cognition),23 a less complex task requiring fewer cognitive processes. The IED has been used in different clinical populations including Alzheimer's disease and schizophrenia.24–26 This task has recently been optimised for MEG such that feedback is not required and the intradimensional and extradimensional switches can be randomly interspersed.27
We tested a group of adults with a recent mTBI using IED and MEG to compare the spatiotemporal progression of activation during the task with a matched cohort of controls to investigate if MEG could capture differences in brain activity that could be the basis for the subtle functional deficits often reported in mTBI.
Materials and methods
The Research Ethics Board of both institutions involved approved the study. Sixteen adult males with ages between 20 and 40 years and a recent mTBI (<2 months) and 16 matched controls were recruited. Mild TBI was defined as loss of consciousness <30 min; post-traumatic amnesia <24 h; alterations of consciousness, dazed, confused <24 h; Glasgow Coma Scale (GCS) ≥13 in the first 24 h after injury. Individuals unable to undergo MRI, with an abnormal CT scan, history of neurological, psychological and psychiatric disorders or history of concussions in the last year were excluded. Controls were recruited through flyers and advertisements in the community. All participants gave informed consent.
All participants completed a short battery of neuropsychological tests and clinical assessments. The neuropsychological tests included the Wechsler Abbreviated Scale of Intelligence (WASI) and the Conners Third Edition to identify attention deficit hyperactivity disorder (ADHD) and comorbid disorders. The clinical assessments included the Alcohol Use Disorders Identification Test (AUDIT), the Generalised Anxiety Disorder 7-item Scale (GAD-7), Patient Health Questionnaire (PHQ-9) and Symptom Checklist and Symptom Severity Score (SCAT2).
Stimuli and task
Paticipants completed the IED Set Shift Test adapted for MEG27 while MEG data were acquired. Briefly, the participant sees a sequence of screens containing three images: two on top and one on the bottom, and has to match one of the two images on the top with the bottom image, the ‘target,’ by pressing the left or right button to indicate whether the left or right top image matched the bottom image. Images can change in colour and shape, with 6 possible colours (red, blue, yellow, cyan, green, magenta) and 6 possible shapes (circle, triangle, diamond, star, cross, pentagon), combined into 36 possible two-dimensional images (eg, red circle, red triangle, blue circle, blue triangle, etc). After several trials where the match parameter was the same (eg, the colour ‘yellow’), the match parameter shifted. There were two types of shifts: intradimensional and extradimensional. Intradimensional shifts were easier and within the same dimension, that is, shift from colour-to-colour or shape-to-shape. Extradimensional shifts were between dimensions, that is, from colour-to-shape or shape-to-colour. An example of the task is shown in figure 1

Example of the set-shifting task. For this task, participants are presented with a sequence of screens. On each screen are three images, two on top and one on the bottom. The task is to match the bottom image with one of the top images and indicate the match with a right or left button press. The stimuli are designed so that the bottom image matches one of the top images on the dimensions of either colour or shape. Participants will experience a few trials where the dimension is consistent, and then they will be required to ‘shift’. If the shift is within a dimension (eg, from one colour to another colour), then it is an intradimensional shift, which is easier to complete. If the shift is between dimensions (eg, from a colour to a shape), this is termed an extradimensional shift, which is slightly more cognitively difficult.
Three hundred and seventy sets of stimuli were presented using Presentation software (Neurobehavioral Systems, Inc, Berkeley California, USA) via a back projection screen placed 78 cm from the participants’ eyes, with 50 requiring intradimensional shifts and 50 requiring extradimensional shifts. The stimuli were foveal and subtended 13° of arc (6.5° on either side of mid-line). The task was self-paced and each set was presented until a response was recorded, to a maximum of 4 s. The stimulus was followed by a white fixation cross with a duration that was randomly jittered between 0.8 and 1.2 s. The entire test required a maximum of 30 min if each response takes 4 s; however, the average testing time was under 10 min.
MEG data acquisition
Prior to entering the MEG-shielded room, paticipants were trained on the task. Three fiducial coils were placed on each participant's nasion and left and right preauricular points to allow head position to be tracked in the MEG and replaced with vitamin E capsules to allow co-registration of MEG data with structural MRI. Participants were tested supine and MEG data were recorded continuously on a 151-channel whole-head MEG (CTF Omega, MEG International Services Ltd, Coquitlam, Canada) with a 600 Hz sampling rate, 0–100 Hz band pass and third-order spatial gradient noise cancellation. Data were processed off-line. Head movement was monitored before and after each run. Runs with >5 mm head movement would have been repeated although this was not required for any of the participants in this study. After completion of MEG, structural MRI (T1-weighted, three-dimensional sagittal MPRAGE, TR/TE/FA=2300 ms/2.96 ms/90°, GRAPPA=2; FOV=28.8×19.2 cm, 256×256 matrix, 192 slices, slice thickness=1.0 mm isotropic voxels) was obtained on a 3 T scanner (Magnetom Tim Trio, Siemens AG, Erlangen, Germany) with a 12-channel head coil.
MEG data analysis
Continuous data for each participant were epoched into trials by time-locking to stimulus onset and creating a trial length from 200 ms prestimulus to 1100 ms poststimulus onset. The trials were sorted into intradimensional and extradimensional shifts, and correct trials for each shift type were selected for further analyses. Data were band pass filtered from 1 to 40 Hz (fourth-order Butterworth filter) and global field power (GFP) plots (root mean squared power) were calculated across all MEG sensors for each group and shift condition. Examination of the latency and duration of the GFP peaks informed the selection of parameters for source analyses. A non-overlapping, sliding window approach was taken with six 100 ms duration windows from 75–675 ms (75–175, 175–275, 275–375, 375–475, 475–575, 575–675 ms) and submitted to synthetic aperture magnetometry beamforming13 to localise neural sources active in each of these windows. The results for each participant were normalised into stereotaxic space using SPM8 (http://www.fil.ion.ucl.ac.uk/spm/software/spm8) and averaged across participants by conditions. Image contrasts for each time window were computed between participants and subjected to non-parametric permutation testing. We used a single-threshold maximal statistic permutation test adapted for MEG28 ,29 where group membership of the contrast images were shuffled (2946 permutations) to create a null distribution against which the original images were compared. This type of approach controls for family-wise type I errors.30 Direct comparisons of the areas activated were also submitted to a 2 (group) by 2 (condition) analysis of variance (ANOVA) using the pseudo-z values of the MEG activity at the sources found in the beamformer analyses.
Regions in the brain showing significant differences in activation between groups in the contrast testing were identified and coordinates recorded for reconstruction of the time course of activation at each of these coordinates. Time courses of activation were reconstructed by unwarping the Talairach coordinates of the specific location of interest back into each participant's brain space, calculating the course of the pseudo-z value for each time point, which is represented as a single column vector in the beamformer matrix, then rectifying and averaging the resultant data across the group and representing it as a waveform. The differences between the control and mTBI groups at each time point in the time courses were permuted and tested for significance. Latencies where the difference in MEG field strength remained significant after correction for multiple comparisons were marked on the time course, indicating regions where brain activations were significantly different between the control and mTBI groups.
Statistical analysis
Two-sample t tests were used to compare results of neurocognitive tests and age between groups. Two-by-two mixed factorial ANOVA having group as the between variable and condition as the within variable was used to compare reaction times and accuracy for the set-shifting task (mTBI and control groups) for the intradimensional and extradimensional shifts.
Results
Behavioural results
Age and neurocognitive test results (means and SD) are shown in table 1. Significant differences between controls and mTBI on the Patient Health Questionnaire, the Symptom Checklist, and Symptom Severity Measure were seen. There was no difference in scores for other neurocognitive measures.
Patient demographics and neurocognitive tests average results
Testing occurred a mean of 32.6±17.5 days after injury. The absolute range was 7–62 days post-TBI. There was no significant difference on average reaction time between controls (611.8 ms±19.05 SEM) and mTBI (635.3±13.6 SEM), but mTBI affected reaction time (F (1,60)=4.73, p=0.034) in extradimensional shifts, with patients with mTBI requiring longer times (648.4 ms±15.2 SEM) for extradimensional shifts than intradimensional shifts (598.6 ms±16.9 SEM). Interestingly, accuracy was similar in both groups (controls: 88.2%±11.6 SD; mTBI: 87.6%±9.2 SD). Overall accuracy for extradimensional and intradimensional shifting was 85.6%±10.5 SD and 90.2%±10.0 SD, respectively.
Regional activation analyses
Talairach coordinates, anatomical labels and Brodmann area (BA) labels for brain locations identified by synthetic aperture magnetometry for each of the time windows in the intradimensional (easier task) and extradimensional (more difficult task) shifts are shown in table 2. To facilitate visualisation of the regions involved in set-shifting, a colour code was used to identify different brain areas. The sequence of activations and brain areas involved were significantly different between the groups.
Regions activated by intradimensional (A) and extradimensional (B) shifting in control and mTBI groups. Frontal, parietal and occipital lobe activations are colour-coded
For intradimensional shifting (easier condition), the control group followed a sequence of neural activations from bilateral insulae (BA13) to bilateral dorsolateral frontal areas (BA10, 46, 45) to bilateral posterior parietal regions (BA7, 40) followed by reactivation of bilateral frontal regions. Patients with mTBI, while still activating dorsolateral frontal cortex and the insula, showed activity primarily in the left hemisphere and followed a more disorganised sequence. The majority of activations in the mTBI group were in posterior parietal areas (BA39, 40) and regions in the visual ventral processing stream (BA18, 19), not activated by controls.
Interestingly, for the extradimensional shift, the control group activated the same areas, in the same sequence, as for the intradimensional shift, but additionally, recruited posterior parietal cortex (left BA40). The mTBI group showed a very different pattern, relying primarily on the left hemisphere and regions in the ventral visual processing stream (BA18, 19, 39).
Visual inspection of table 2B suggests that the list of regions reaching a significant level of activation was sparse and the frontal lobes were prominently absent in mTBI; however, with a less stringent threshold for significance, the list of activated regions in the mTBI group shows activations in frontal areas, suggesting a weaker MEG signal in these regions. Source localisation results were submitted to an image contrast and significant differences (p<0.01) during intradimensional and extradimensional shifting were identified. The results are shown in figures 2 and 3 for intradimensional and extradimensional shifting, respectively, and listed in table 3.
Time of measurements (milliseconds) and location for regions showing significant differences in activation during set-shifting task between mTBI and controls for (A) intradimensional and (B) extradimensional shifts

Brain regions showing significant differences between control and mTBI groups on the intradimensional shift condition. The global field power plot is shown on the top with grand-averaged responses for the control (blue) and mTBI (red) groups. Sliding non-overlapping time windows of 100 ms from 75 to 675 ms were selected for source localisation with synthetic aperture magnetometry. Brain images show regions in each time window that were significant (p<0.01, corrected) after a between-groups image contrast. mTBI, mild traumatic brain injury; BA, Brodmann area.

Brain regions showing significant differences between control and mTBI groups on the extradimensional shift condition. The global field power plot is shown on the top with grand-averaged responses for the control (blue) and mTBI (red) groups. Sliding non-overlapping time windows of 100 ms from 75 to 675 ms were selected for source localisation with synthetic aperture magnetometry. Brain images show regions in each time window that were significant (p<0.01, corrected) after a between-groups image contrast. Windows without a corresponding brain image did not show any significant differences between groups. mTBI, mild traumatic brain injury; BA, Brodmann area.
The contrasts indicate that predominant differences between control and mTBI groups are in right frontal (BA13 and 8) and bilateral parietal (BA 40 and 7) regions for intradimensional shifting; and right frontal (BA13 and 9) and left parietal (BA 40 and 7) regions for extradimensional shifting.
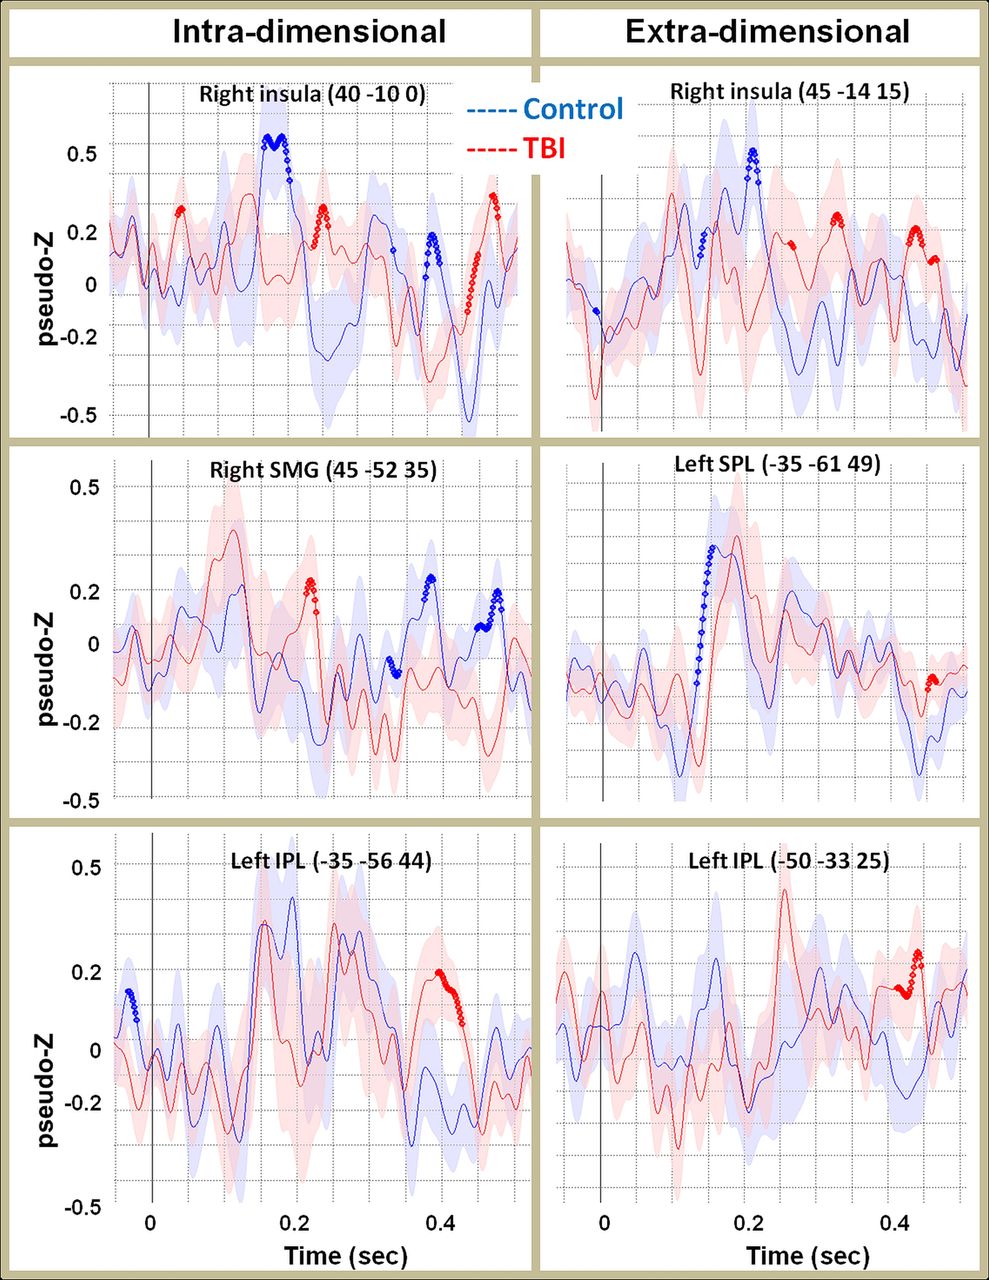
To confirm these differences, the timing of activation in the right insula (BA 13) and posterior parietal lobules was reconstructed (figure 4). Blue dots indicate latencies when activation in the selected region was significantly greater (p<0.05, corrected) in controls than mTBI, while red dots indicate latencies when activation in the selected region was significantly greater (p<0.05, corrected) in mTBI than controls. It is clear that activation in right insula is delayed in mTBI for both intradimensional and extradimensional shifts. Further, while the control group showed clear peaks in the right insula, the peaks seen in the mTBI were of lower amplitude and less well defined.

Reconstructed time courses from locations that were significantly different between groups, as identified by image contrasts. These locations were in right insula for both types of shifting; bilateral posterior parietal cortex for intradimensional shifts and left posterior parietal cortex for extradimensional shifts. Blue dots indicate latencies where the controls showed significantly greater activation (p<0.05, corrected) than mTBI. Red dots show latencies where the mTBI group showed significantly greater activation than controls. Shading indicates standard errors of the mean. mTBI, mild traumatic brain injury.
In the parietal areas, for intradimensional shift, while controls seemed to use right supramarginal gyrus (BA 40) in the 350–450 ms time window, mTBI recruited the homologous area in the contralateral hemisphere, using left inferior parietal lobule (BA 40) in this time window. Further, mTBI showed a significantly early activation (around 200 ms) in right supramarginal gyrus. This early, isolated activation suggests disorganised activation of neural regions in mTBI.
In parietal areas, for extradimensional shift, while both groups show a clear peak of activation in the 150–200 ms time window, mTBI showed significant delay (approximately 50 ms) and an unusual late peak, sustained and clear, in left inferior parietal lobule (BA 40).
Discussion
In this study, we used MEG to examine timing and sequence of neural activation during a set-shifting task to identify differences in brain activations between mTBI participants and matched controls. Our most important finding refers to the disorganised pattern of activation showed in mTBI and the involvement of areas not recruited by healthy controls for the same tasks, such as the occipital lobe.
Controls showed an organised pattern of activation for both easy and difficult tasks. For the easy (intradimensional) shift task, this pattern progressed from bilateral frontal to bilateral parietal, re-entering bilateral frontal areas. For more difficult, extradimensional shift task, the controls showed left frontal-parietal activation progressing to bilateral insulae and left frontal-temporal areas, and returning to left frontal and bilateral insulae. This pattern of activation is consistent with fMRI and MEG studies showing involvement of these regions in set-shifting tasks.37 ,38
Our MEG data add new information on the timing of the activation in these brain regions during set-shifting, showing the interplay between the right insula, known as a hub for monitoring and switching,39 ,40 and the frontal lobes, functionally connected to the right anterior insula and critical for executive functions. Activation of the insula in mental flexibility testing has been shown before37 ,41 but we show that the right insula is activated before the frontal lobes, at the 75–175 ms window for the easy shifts and 175–275 ms for the harder shifts, confirming that the insula leads the processing during these set-shifting tasks, with later reactivation following frontal and parietal involvement.
Interestingly, patients with mTBI performed as well as controls in terms of accuracy although requiring more time and recruiting more brain regions for each task. A possible underlying reason for this ineffectiveness is the disorganised activation of the neuronal circuits involved. As seen in table 2, the mTBI group does not show the typical spatiotemporal progression used by controls to succeed at the task within the average time, showing less involvement of the frontal lobes in the early stages.
However, when our initially high threshold for significance was lowered, activation of frontal and parietal areas could be seen. To understand this seemingly conflicting result, it is important to remember that neurophysiological data reflect synchronous neuronal firing—the more synchronous, the larger and clearer the signal. Thus, our observation of subthreshold frontal activity in mTBI may reflect asynchronous neural activity; that is, while the neurons are able to fire, they are disorganised and not able to fire in synchrony—resulting in a waveform with a lower amplitude and less well-delineated morphology, that is, lower MEG signal.
Our hypothesis of disorganised and less effective activity is further supported by the reconstructed time course. Activation times obtained from the right insula and left parietal lobule clearly demonstrate delayed activation of these areas in mTBI. Further, the magnetic fields generated from these areas were of lower amplitude, and activations were scattered and disorganised. These findings are in line with previous studies reporting decreased connectivity measured with fMRI,42 and improved attention14 and lower incidence of post-traumatic stress disorder43 after neurofeedback training.
Also, Turner and Levine44 used fMRI to show that after moderate and severe TBI and diffuse axonal injury (DAI), patients had an equivalent performance compared with controls, but required greater recruitment in regions of prefrontal and posterior cortices. The authors suggested that normal behavioural performance and increased functional recruitment could be a neural marker of ‘capacity or efficiency limits’ after DAI.
As expected, patients with mTBI performance on most neuropsychological tests was normal despite significant differences on questionnaires of self-reported symptoms and well-being (ie, depression as measured by the PHQ9). While individuals with mTBI are able to complete tasks as accurately as controls, as evident by the behavioural data, significant differences in neural activation required for the execution of the tasks can be seen between groups.
It seems that increased disorganisation and recruiting in order to maintain performance in tasks detected here using MEG may have the same implications in mTBI as similar findings in fMRI,44 serving as an indicator of ‘inefficiency’ of the neuronal networks involved. In line with Turner and Levine's44 work, our data suggest that affected individuals can maintain and compensate for performance, but may be working closer to their limit capacity, and increasing challenging tasks might reveal the subtle underlying dysfunction. Presumably, with increasingly difficult tasks, the ability to compensate of recognised regions involved in mental flexibility and executive function, for example, the insula and bilateral posterior parietal regions will plateau and performance will begin to deteriorate. This could be the mechanism that underlies the symptoms expressed by patients with mTBI of difficulties with mental flexibility, and explains the often seen failure to perform when these individuals return to work.
Since the neuronal damage caused by blunt brain trauma (without focal lesions) lies on the mildest end of a continuum of a pathophysiological process based on DAI, it makes sense that a more sensitive method would be required to detect the very mild degrees of injury, not seen in standard structural imaging such as CT or MRI. Recent publications using advanced MRI techniques showed an increase in cerebral microbleeds and microstructural alterations in white matter in hockey players, examined before and after the playing season,5–7 offering a possible anatomical substrate to the functional findings on fMRI and MEG. Although in our study we could not correlate the locations of poor MEG activation with DTI findings, the structural findings above and the work of Huang et al14 support our assumption that these findings reflect disorganised and asynchronous neuronal firing after injury.
Our study has limitations. All mTBI participants were tested within 2 months of their injury. More acute testing would be of interest but logistically difficult. The strict age limits in our inclusion criteria precludes the extrapolation of our findings to older populations, another segment often affected by mild and moderate TBI. Also, we only tested males, so no comments can be made regarding gender differences. The majority of our patients had at least some complaint related to the injury, therefore no attempt was made to include postconcussive symptoms in the analysis, and we cannot comment on the relationship between MEG results and symptoms. Longer term follow-up of such a cohort would be invaluable in determining the natural progression of the cognitive difficulties and the associated MEG findings.
Conclusion
We found significant differences in regional brain activation and timing of activation in patients with mTBI using MEG, when tasks appropriate for the reported cognitive dysfunction are used. These findings may be the functional consequences of the recently demonstrated microstructural damage after seemingly mild injuries. Further investigation is required to determine the relationship of these findings and specific patient symptoms, and evolution of symptoms over time. These results appear promising and suggest that MEG may be an objective way of identifying subtle brain dysfunction after mTBI. Based on these results, we believe MEG can be developed into a useful tool to objectively evaluate patients with mTBI.
Acknowledgments
The authors would like to thank Marc Lalancette for assistance with data collection and Dr Sandro Rizoli for his collaboration and support during our efforts to initiate this project.
References
Footnotes
Contributors LdC supervised the project at the Sunnybrook site and co-wrote the manuscript. AR and AB were responsible for participant recruitment and data collection at the Hospital for Sick Children and Sunnybrook Hospital sites, respectively. MJM analysed the data. PNS, MJT and EWP conceived and designed the project. MJT and EWP co-supervised all aspects of the study. EWP co-wrote the paper. All authors contributed to revisions of the manuscript and approved the final version for submission.
Competing interests This work was supported by funding from Defence Research and Development Canada (Contract #: W7719-135182/001/TOR) to MJT and EWPang.
Patient consent Obtained.
Ethics approval Research Ethics Board Sunnybrook Health Sciences Centre and REB The Hospital for Sick Children.
Provenance and peer review Not commissioned; externally peer reviewed.