Article Text

Abstract
OBJECTIVE White matter hypoperfusion may play a part in the pathogenesis of ischaemic leukoaraiosis, but demonstration of this requires a high resolution quantitative method of cerebral blood flow (CBF) measurement. Initial exogenous contrast based MRI methods only allowed measurement of relative cerebral blood volume (CBV) values, but more recently a mathematical approach has been developed which enables absolute regional CBF and CBV to be determined. This technique was applied to patients with ischaemic leukoaraiosis to determine whether reduced white matter CBF in this patient group could be demonstrated.
METHODS Eight patients with ischaemic leukoaraiosis (radiological leukoaraiosis and clinical lacunar stroke), and nine age matched controls were studied. A spin echo echoplanar image sequence was used on a 1.5 Tesla MR system. An arterial input function was obtained from voxels placed over the middle cerebral arteries. Cerebral blood flow, CBV, and mean transit (MTT) maps were derived. Regions of interest were placed at standard positions in the white and grey matter and mean values of CBF, CBV, and MTT were compared between the two groups.
RESULTS Mean (SD) white matter CBF was significantly reduced in patients by 38% (13.40 (4.87) v 21.74 (3.53) ml/min/ 100 g, p=0.002). Significant reductions in CBF were seen in all white matter regions. By contrast there was no reduction in CBF in any grey matter region. There was no significant difference in white matter CBV between cases and controls; mean values were lower in all white matter regions for patients but this did not reach significance for any region. By contrast mean grey matter CBV was significantly higher in patients than in controls. Mean MTT values were higher in all regions of grey and white matter in the patient group, but this only achieved significance for the superior white matter.
CONCLUSION A quantitative MR perfusion method showed reduced white matter CBF in patients with ischaemic leukoaraiosis, but normal grey matter CBF. This is consistent with hypoperfusion playing a part in the pathogenesis of ischaemic leukoaraiosis. The absolute values of white matter and grey matter CBF obtained in the patient groups were very similar to those in previous PET studies, providing further evidence for the validity of the regional CBF measurements obtained using this quantitative MR perfusion technique. The high spatial resolution and lack of radioactive administration makes such techniques ideal for longitudinal studies in this condition.
- magnetic resonance imaging
- cerebrovascular circulation
- stroke
- cerebral blood flow.
Statistics from Altmetric.com
Stroke is the third most common cause of mortality and the major cause of disability in western countries. Up to 25% of strokes are caused by lacunar infarction which results from ischaemia in the territory of the small perforating intracerebal arteries. A subgroup of these patients may have multiple lacunar infarcts which, in addition to recurrent lacunar stroke, may present with gait disturbance, a subcortical dementia, and a parkinsonian syndrome.1 In addition to focal lacunar infarction, subcortical vascular disease may result in diffuse white matter changes characterised by neuronal loss, demyelination, and gliosis. Its radiological appearance is termed leukoaraiosis,2 in view of the periventricular lucency seen on CT and a corresponding high signal on T2 MRI. Postmortem studies show that severe leukoaraiosis is almost always accompanied by multiple lacunar infarcts, and the small perforating arteries seem abnormal with hyalinisation and thickening of the vessel wall.3
Some features suggest that leukoaraiosis results from chronic ischaemic damage. A striking feature is that the white matter changes spare the subcortical U fibres. This is consistent with the pathology being maximal in the regions of terminal supply of the penetrating arterioles—namely, the periventricular regions and the centrum semiovale. These areas, where perfusion pressure will be lowest, are likely to be particularly vulnerable to periods of relative hypoperfusion.4
For these reasons investigators have attempted to show reduced perfusion or cerebral blood flow (CBF) in the white matter in patients with ischaemic leukoaraiosis. Such studies require a quantitative estimate of cerebral blood flow, as the disease process is diffuse and may affect multiple brain regions. Semiquantitative techniques such as single photon emission computed tomography (SPECT) have been used,5 but these can only give ratios of perfusion between different brain regions, and cannot demonstrate a reduction in absolute regional CBF. Quantitative xenon-CT and PET have shown reduced cerebral blood flow in patients with ischaemic leukoaraiosis,6-8but such techniques require exposure to radiation, making them unsuitable for serial imaging studies.
Recent advances in ultrafast MRI now offer the potential of combining high resolution structural imaging of the white matter with perfusion imaging. Perfusion can be determined with MRI by the use of bolus tracking dynamic imaging methods with exogenous paramagnetic contrast agents. Initial perfusion studies only allowed measurement of relative CBV values,9 but more recently, a mathematical approach has been developed to also yield relative CBF.9 After dose normalisation of the gadolinium contrast agent, and introduction of a proportionality constant derived from studies in a pig model and in humans, absolute regional CBF can be calculated from MRI with a signal to noise and spatial resolution equal or better than that obtained with PET.10 In comparisons between MRI and PET, performed both in pigs10 and in healthy humans,11 a close correlation was found between CBF measurements calculated using the two methods.
In this study we examined the hypothesis that reduced white matter perfusion could be shown in patients with ischaemic leukoaraiosis using quantitative exogenous contrast based perfusion MRI. We determined whether the absolute values of CBF obtained were similar to those from previous studies using PET. We also compared regional cerebral blood volume (CBV) and mean transit time (MTT) between patients and age matched controls.
Subjects and methods
SUBJECTS
We studied eight patients (seven men) presenting to a specialised cerebrovascular neurology clinic with ischaemic leukoaraiosis. This was defined as extensive confluent areas of hyperintensity in white matter on T2 weighted images, in combination with a history of lacunar stroke. All patients were studied at least 3 months after their last stroke to reduce an influence on cerebral perfusion patterns from diaschesis after an acute event. Mean time since last presentation was 2.9 years (range 1–7 years). Treated hypertension was present in six and five were ex-smokers or current smokers. None had diabetes. Five had evidence of mild cognitive impairment on routine neuropsychological testing. Three had had only single clinical lacunar strokes and the remainder had experienced recurrent events. Carotid stenosis (>30%) was excluded in all by duplex ultrasound. In addition, we studied nine age matched normal controls (eight men) of whom two had treated hypertension, but none had diabetes. These were recruited from a community volunteer database from the same geographical region as the patients. Patients with a history of stroke, transient ischaemic attack, or cognitive impairment were excluded but patients with vascular risk factors were included. Six were current or ex-smokers. Mean (SD) age was 63.3 (12.3) in patients and 68.7 (7.3) in controls (p=0.300). All patients gave informed signed consent and the study was approved by the local hospital ethics committee.
MR IMAGING
A 1.5T GE Signa (GE Medical Systems, Milwaukee, WI, USA) system fitted with Advanced NMR (Wilmington, MA, USA) hardware and software was used. Before subjects were placed in the magnet in the supine position a 16 gauge cannula was inserted into an anticubital vein. In six patients and all controls end tidal carbon dioxide monitoring was performed throughout the procedure; a nose clip was fitted to ensure that the inhaled gas was derived solely from a mouthpiece which was in place throughout the scan, and was fitted with a one way valve to separate inspired and expired gases.
An 11 slice SPGR sagittal localiser image was acquired (TR=150 ms, TE=42 ms, α=90°, Δx=Δy=0.94 mm, slice thickness=5.0 mm, slice gap=2.5 mm). The localiser image was displayed and used to prescribe image planes for the perfusion study. Five axial slices were prescribed though the region of interest, with the centre of the second uppermost slice aligned with the superior aspect of the corpus callosum. Two additional near axial oblique slices were prescribed to ensure that one intersected the middle cerebral arteries (MCAs). To check that one of the lower slices intersected at least one of the MCAs, a single seven plane spin echo (SE) echoplanar image (EPI) was acquired, (TR=1.52 ms, TE=90 ms, α=90°, Δx=Δy=1.6 mm, field of view 400×200 mm, slice thickness=5.0 mm, slice gap=2.0 mm). This procedure was repeated if necessary, with the two oblique slices repositioned, until the MCAs were clearly seen within one of the slices.
Next, the subject was asked to close his or her eyes, and a series of 70 consecutive multiplanar SE-EPIs were acquired (dummy scans=4, TR=1.52 ms, TE=90 ms, α=90°, Δx=Δy=1.6 mm, slice thickness=5.0 mm, slice gap=2.0 mm) with the subject breathing air. During image acquisition, end tidal CO2 measurements were recorded. Contrast agent (Omiscan, Nycomed Imaging) at a dose of 0.1 mmol kg-1 was delivered at a rate of 5 ml/s using a MR compatible power injector (Doltron), commencing on the 20th image in the series. Contrast agent administration was followed with a 10–20 ml saline flush, depending on the weight of the subject.
The image containing the MCAs was displayed as a ΔR2 map, with ΔR2 calculated using the first image in the series as a reference. Voxels in the vicinity of both MCAs, with large signal change and rapid bolus passage, were selected to produce a mean arterial input function (AIF). After spatial smoothing with a uniform 3×3 convolution filter the tissue ΔR2 time curve was deconvolved with the AIF. Maps of CBF were derived from the height of the deconvolved impulse response, and absolute CBF was calculated by normalisation to the injected dose multiplied by an empirical constant factor. Deconvolution was performed between the AIF arrival time, and the point at which the AIF ΔR2 time curve returned to the noise level. The CBV was calculated pixel by pixel as the time integral of the tissue ΔR2 time curve. Integration was performed numerically between the arrival time of the AIF, and the time the ΔR2 time curve returned close to baseline levels, but before tracer recirculation became apparent. Maps of MTT derived using the central volume theorem from MTT=CBV/CBF. No correction for the effect of delay in arrival time in successively acquired slices or due to acquisition order was made as previous simulations have shown such errors to be small at the flow values measured in this study.9
A T2 weighted image was created from the mean of the precontrast SE-EPI images. Regions of interest (ROIs) were defined separately for the left and right hemispheres in the five superior slices for the following brain regions: frontal cortex, parietal cortex, occipital cortex, basal ganglia, anterior periventricular white matter; posterior periventricular white matter; and the white matter superior to the ventricles. The ROIs were hand drawn on the EPI T2 weighted images (mean of the prebolus images) by an experienced observer. The ROIs were transferred to the CBF images for analysis. Standard brain regions, as outlined above, which had previously been drawn on a normal MR template image were used. After the ROIs were transferred to the CBF images, they were hand edited to eliminate any voxels within the vicinity of large vessels, which show up as regions of extremely high intensity on the CBF maps. Weighted mean CBF, CBV, and MTT values were calculated from the ROIs, for each brain structure separately as

where P is each of CBF, CBV, and MTT.Ai is the area of region,Ii its mean intensity, andk is a predetermined empirical constant to convert flow to absolute units of ml/100 g/min and CBV to absolute units of ml/g. The value of k, after correction for the difference in field strength in our study and that of the previous work from which it was derived,10 was 1.344 for the CBF and CBV calculations, and 1.0 for the MTT calculations. The conversion factor10was extrapolated to 1.5 T by assuming a linear dependence of the magnitude of susceptibility contrast upon field strength.12
DATA ANALYSIS
There were no significant left to right differences and therefore values from left and right regions of interest were pooled. Mean grey and white matter values were obtained by averaging values from the frontal, parietal, and occipital cortical regions and the three white matter regions respectively. Data for the frontal and occipital grey matter were pooled, as were the data from the periventricular white matter, and the same comparisons made as for the individual ROIs. Mean values were compared between patients and controls using an unpaired two tailed student's t test. In view of the multiple comparisons made a significance level of p=0.01 was used.
Two potential problems which could invalidate the CBF measurements were blood-brain barrier breakdown and a ΔR2 time curve is delayed relative to the arterial input curve in some patient subgroups. Therefore data analysis was also performed to determine whether there was any evidence of white matter blood-brain barrier leakage in this condition which would invalidate the assumptions made in CBF estimation. These assume that the tracer remains in the intravascular compartment. The postcontrast–precontrast ΔR2 difference was used to indicate leakage. If vascular leakage does not occur, the signal will return to its precontrast level after the bolus injection, or in the presence of tracer recirculation, the postbolus signal will be lower than the prebolus intensity. If vascular leakage occurs, the postbolus signal may be increased relative to the prebolus signal. Once the signal-time curve has been converted to ΔR2 values, recirculation would result in positive ΔR2, whereas tracer leakage would then show up as negative postcontrast ΔR2.
One possible criticism of the singular value decomposition technique used to deconvolve the arterial input curve from the tissue ΔR2 time curve is its susceptibility to give erroneous flow values where the ΔR2 time curve is delayed relative to the arterial input curve, and if there is increased dispersion of the contrast agent bolus before it reaches the tissue.
To investigate these two potential problems in cases and controls mean tissue signal-times were calculated for two ROIs placed in the periventricular white matter of the left and right hemispheres. The mean arterial input curve was also calculated. The signal-time curves were converted into ΔR2 time curves for analysis. For each ROI, the mean ΔR2 was calculated for the precontrast time points, and for the postcontrast time points. The postcontrast–precontrast difference in ΔR2 (diff ΔR2) was calculated as an index of vascular leakage. The mean grey matter and white matter diff ΔR2 values were then calculated for each subject. The diff ΔR2 were compared between the patients and control group using an unpairedt test. Tracer arrival time for the AICs and the tissue ΔR2 time curves was determined as the point before ΔR2 rose above 2×SD of the ΔR2 of the first 20 time points. The difference in arrival time (delay) for each region of interest relative to the AIC was determined, corrected for delays due to the slice acquisition order of the multislice echo planar imaging sequence.
Results
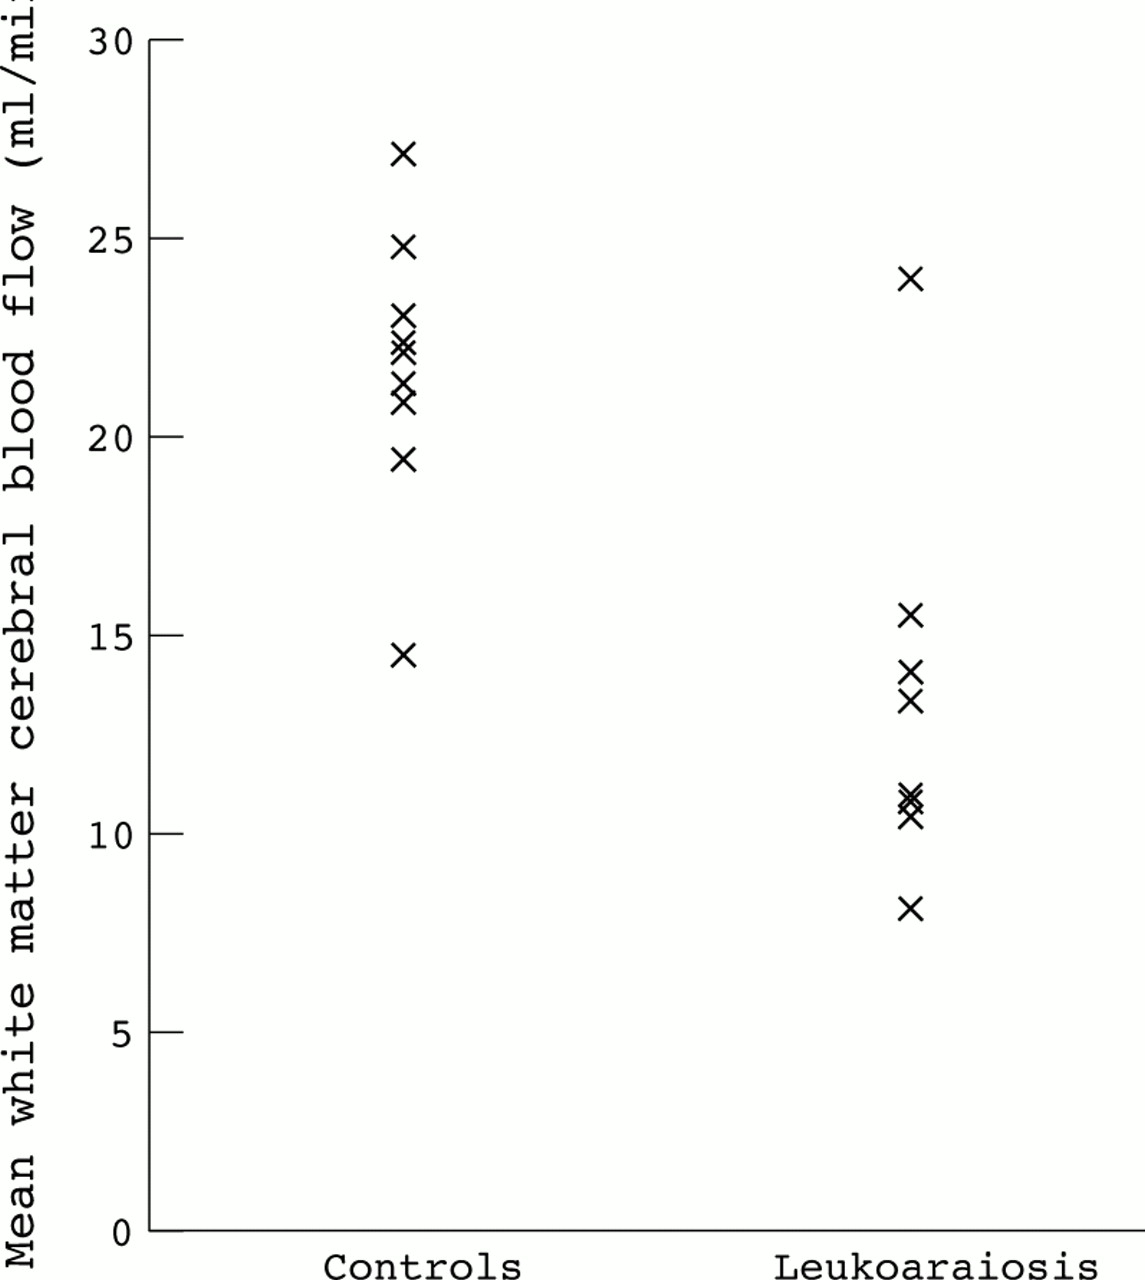
Mean CBF measurements are shown in table 1. The controls did not have white matter abnormalities on T2 weighted images. Typical images from a control and a patient with leukoaraiosis are shown in figure 1. Mean white matter CBF was significantly reduced in patients by 38% (13.40 (SD 4.87) v 21.74 (SD 3.53) ml/min/100 g, p=0.002). Significant reductions in CBF were seen in all white matter regions; 34% in the anterior, 40% in the superior, and 41% in the posterior white matter. By contrast there was no reduction in mean grey matter CBF. There was no significant reduction in CBF in any grey matter region. There was a wide range of CBF values among the different patients with leukoaraiosis (figure 2). There was no difference in end tidal carbon dioxide concentrations between patients and controls during the acquisition phase of the perfusion imaging (mean (SD) 4.97 (0.51) v 4.97 (0.71) kPa p=0.994).
Mean (SD) CBF values (ml/min/100 g) in the two groups
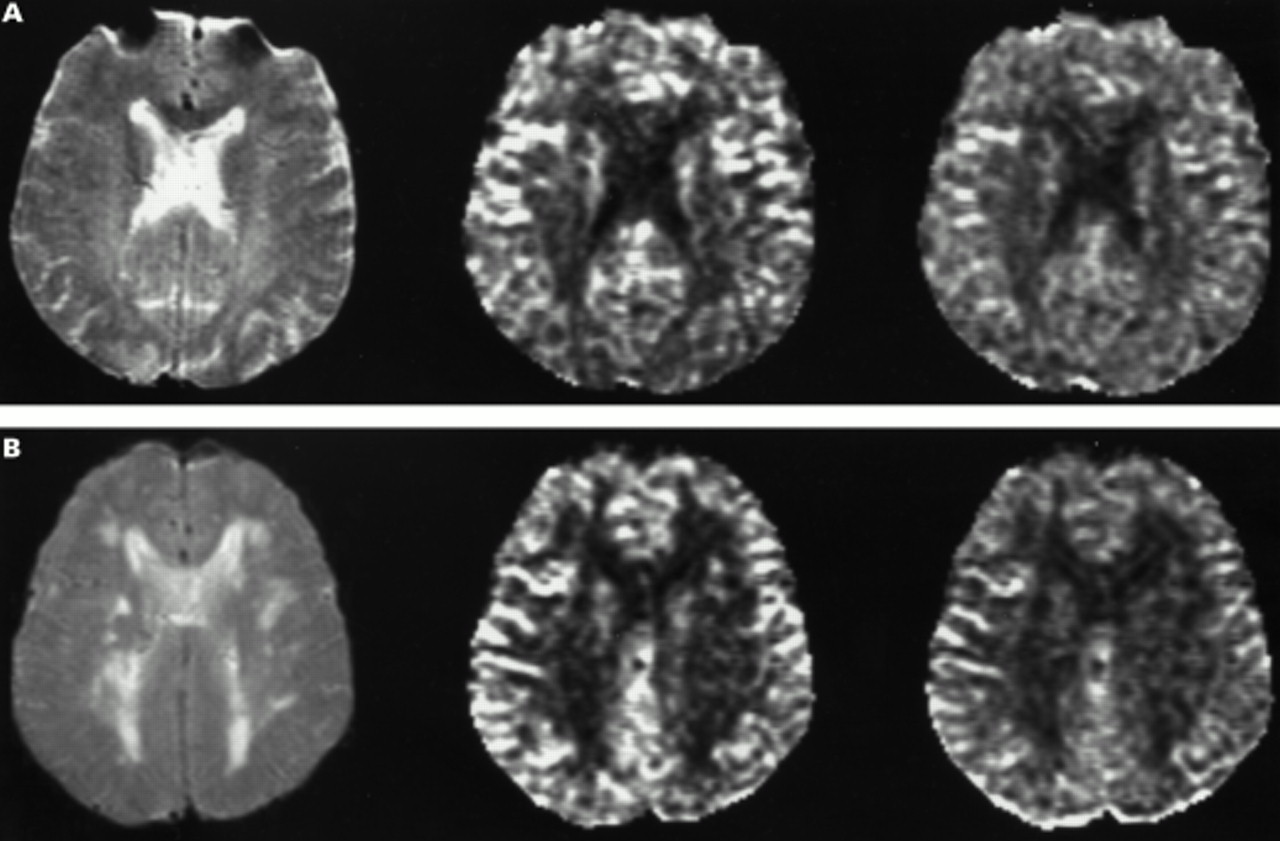
Typical images from a control (A, upper panel ) and from a patient (B, lower panel). In each case the first image is the fast SE T2 weighted image, the second image is the cerebral blood flow map, and the third image the cerebral blood volume map, for the same slice.

Mean white matter CBF values in controls and patients with ischaemic leukoaraiosis.
There was no significant difference in white matter CBV between cases and controls (table 2); mean values were lower in all white matter regions for cases but this did not reach significance for any region. By contrast, mean grey matter CBV was significantly higher in patients than in controls; in each individual region mean values were higher in patients but this only achieved significance for the occipital cortex.
Mean (SD) CBV values (ml/100 g) in the two groups
Mean MTT values were higher in all regions of grey and white matter in the patient group, but this only achieved significance for the superior white matter and basal ganglia (table3).
Mean (SD) MTT values (s) in the two groups
There was no difference in white matter diff ΔR2 values in patients versus controls (0.010 (SD 0.07) v 0.08 (SD 0.01) s-1, p=0.7). There was no significant delay in tracer arrival time in the white matter of patients compared with controls (2.77 (SD 1.34) v 2.83 (SD 1.63) s, p=0.94).
Discussion
Using a quantitative MR perfusion method we have shown reduced white matter CBF in patients with ischaemic leukoaraiosis, but normal grey matter CBF. The absolute values of CBF we obtained in the patient groups were very similar to those in previous PET studies in which both white and grey matter flow have been determined.7 8 13 14 This provides further evidence for the validity of the rCBF measurements using this quantitative MR perfusion technique.
We found no significant difference in white matter CBV between the two groups although mean values were non-significantly lower for all white matter regions in the leukoaraiosis group. However, our study was not sufficiently powered to determine if this is a real difference. Power calculations derived using the SD from the control group in this study showed that a sample size of about 100 would be needed to show a significant difference of this magnitude. The results we obtained were very similar to those in a previous PET study when white matter CBV was 1.7 ml/100 ml in patients and 2.0 ml/100 ml in controls.13By contrast grey matter CBV was significantly increased in the leukoaraiosis group. The reason for this is uncertain and we can find no previous reports of cortical grey matter CBV measurements in ischaemic leukoaraiosis. Studies with PET have suggested that the metabolic rate is abnormal in the cortical grey matter as well as the white matter, despite its normal appearance on structural MRI.7 This may represent a functional depression due to “disconnection” of white matter tracts. Alternatively it may indicate that the disease process is not confined to the subcortical regions and that there is some disease of the cortical vasculature. This could merely reflect the increased hypertension in the patient group and arterial damage secondary to this. This presence of a more diffuse disease process is supported by the changes in mean transit time in our study. The MTT was increased in all regions in the leukoaraiosis group although this only achieved significance for the superior white matter and the basal ganglia. The reciprocal of MTT, which is the CBF/CBV ratio, is thought to reflect local perfusion pressure.15
Our results provide further evidence for the potential role of chronic ischaemia in the pathogenesis of ischaemic leukoaraiosis. However, the reduced CBF could be either a primary phenomenon or merely secondary to brain injury. Previous studies have not considered this issue.4 The higher resolution afforded by MRI should allow this to be resolved. By coregistration of structural and perfusion MR images it should be possible to determine CBF in regions of white matter with and without established leukoaraiosis. Quantitative estimation of CBF does require an estimate of the arterial input function.10 In our study we derived this from the middle cerebral artery; this was possible in all cases. An alternative is to derive it from the internal carotid artery but this was not possible in our images due to susceptibility artefact in this region. We used an SE sequence as this has better sensitivity and selectivity for CBF in the microvasculature. With gradient echo EPI, the dependence of ΔR2 on vessel radius reaches a level plateau as vessel size increases, and is considerably larger for arteries than for small arterioles. In SE-EPI, ΔR2 reaches a peak for vessels of less than 10 μ in radius, and then falls off with increasing vessel size. In addition the position of the peak ΔR2 moves to a smaller vessel radius with increasing contrast agent dose. Therefore the CBF signal derived from SE-EPI is predominantly from the microvasculature whereas that from gradient echo EPI is also derived to a greater extent from the larger vessels.16
Estimation of cerebral perfusion using dynamic susceptibility imaging assumes that the contrast agent remains in the intravascular compartment. If blood-brain barrier disruption and vascular leakage occurred this would invalidate the measurements. Blood-brain barrier disruption has been reported in patients with leukoaraiosis who have been reported to have higher CSF/serum albumin ratios, and this would be consistent with blood-brain barrier breakdown.17 If vascular leakage does not occur, the signal will return to its precontrast level after the bolus injection, or in the presence of tracer recirculation, the postbolus signal will be lower than the prebolus intensity. We found no difference in the postcontrast−precontrast ΔR2 difference between the patient and control group, suggesting leakage does not occur, at least during the time scale of the perfusion measurement. This is consistent with a recent study in which patients with white matter vascular lesions, some of whom had functional blood-brain barrier disruption as evidenced by increased CSF/serum albumin ratios, were imaged repeatedly over a 30 minute period just before and after a double standard dose of a paramagentic contrast medium, using a T1 weighted sequence. There was no significant change in the MR signal in the white matter lesions during this period.18 Another possible criticism of the singular value decomposition technique used to deconvolve the arterial input curve from the tissue ΔR2 time curve is its susceptibility to give erroneous flow values where the ΔR2 time curve is delayed relative to the arterial input curve. However, we found no difference in the mean delay between patients and controls in the white matter.
In summary, quantitative exogenous perfusion MRI allows absolute quantification of perfusion in diffuse cerebrovascular disease such as ischaemic leukoaraiosis with a resolution similar to or better than previous methods. Using this technique our results provide further evidence for the role of chronic ischaemia in this condition.
Acknowledgments
This work was supported by a grant from the Stroke Association of the United Kingdom. We thank the neuroimaging staff and in particular Amanda Glover and Caroline Andrews for their assistance in acquiring the MR data. We thank Professor Steve Jackson for allowing us to study the health care of the elderly normal control database.