Article Text

Abstract
Aim: Many studies have been performed on the methodological qualities of the (modified) Ashworth Scale but overall these studies seem inconclusive. The aim of this study was to investigate the construct validity and inter-rater reliability of the Ashworth Scale (AS) for the assessment of spasticity in the upper and lower extremities.
Method: A cross-sectional study on spasticity in the elbow flexors (part 1) and knee extensors (part 2) was carried out. In both parts AS was assessed while muscle activity and resistance were recorded simultaneously in patients with upper motor neuron syndrome. Each patient was measured by three raters.
Results: 30 patients participated, 19 in each part of the study. For elbow flexor muscles, AS was not significantly associated with electromyographic parameters, except for rater 2 (rho = 0.66, p<0.01). A significant moderate association was found with resistance (0.54⩽ rho ⩽0.61, p<0.05). For knee extensors, AS scores were moderately associated with muscle activity (0.56⩽ rho ⩽0.66, p<0.05) and also with resistance (0.55⩽ rho ⩽0.87, p<0.05). The intraclass correlation coefficient for absolute agreement was 0.58 for elbow flexors and 0.63 for knee extensors. In linear mixed model analysis, the factor rater appeared to be highly associated with AS.
Conclusion: The validity and reliability of the AS is insufficient to be used as a measure of spasticity.
Statistics from Altmetric.com
Spasticity is a common phenomenon in patients with upper motor neuron syndrome and is characterised by involuntary muscle activity.1 Traditionally, spasticity is defined as a motor disorder characterised by a velocity dependent increase in tonic stretch reflexes resulting from hyperexcitability of the stretch reflex2 and is particularly present in the antigravity muscles, such as the knee extensors and elbow flexors.3
In clinical practice as well as in scientific research, either the Ashworth Scale (AS)4 or its modified version (MAS)5 is the most commonly used method for the measurement of spasticity.6 7 In many neurology books this scale is still referred to as being the principal method for assessing spasticity (eg, Bradley and colleagues8). However, its methodological limitations are now increasingly being acknowledged.6 7 9 10 While performing the test, the joint under investigation is passively rotated and the examiner rates the perceived resistance during the movement. This resistance is scored on an ordinal scale from 0 to 4. To be a measure of spasticity, the (M)AS can only be valid when the increase in resistance to passive movement is exclusively associated with an increase in neural stretch reflex activity.11 12 13 However, this is probably not the case as the resistance to passive movement is a sum total of reflex muscle activity and non-neural mechanical characteristics. It is influenced by changes in viscoelastic properties of joint structures and soft tissues after an upper motor neuron lesion.13 14 In addition, changes in mechanical muscle–fibre properties might contribute to spastic muscle tone.3 Biomechanical changes are hard to differentiate from reflexive muscle activity without the use of highly sophisticated instruments although in clinical practice nerve blocks with local anaesthetics can be of assistance.15
Two comprehensive reviews have been published that address the validity of the (M)AS.6 7 Both reviews found that associations of (M)AS with electromyographic parameters were moderate, and the association with objective measures of resistance was generally stronger.
Apart from concerns with regard to validity, the reliability of the AS has also been questioned. Platz et al concluded that the intra- and inter-rater reliability of the (M)AS appeared to vary highly between studies.7 Generally somewhat higher levels of reliability were found in the upper extremity compared with the lower extremity,7 16 17 which could be due to the larger mass of the legs. Another factor that might affect reliability is lack of standardisation of the (M)AS.6 18 19 Possibly, factors such as the velocity and range of motion may affect the perceived resistance but these have never been quantified for this scale.
In summary, several studies about the methodological qualities of the (M)AS have been performed, investigating either the validity or the reliability of the scale. Overall, these studies are not conclusive and that has led to the continued use of a measurement method with doubtful methodological qualities. Therefore, there is a need for a comprehensive study on the clinimetric properties of the AS, using a design that overcomes the major drawbacks of existing literature. The goal of the present study was twofold: firstly, to investigate the construct validity of the AS for the measurement of spasticity, and secondly, to assess the inter-rater reliability and identify potential sources of variability between raters. For these purposes, surface electromyography (sEMG) recording was performed during AS scoring by different trained raters, in both the elbow flexor and knee extensor muscle groups. Additionally, dynamometry recording was done simultaneously for objective assessment of resistance during passive movement.
Methods
Study design and population
This cross sectional study consisted of two parts. The first part focused on spasticity in the elbow flexor muscles and the second part on spasticity in the knee extensor muscles.
Patients with self-reported spasticity in the upper arm and/or upper leg following an upper motor neuron lesion were recruited from the inpatient and outpatient departments of a local rehabilitation centre. To take part in the study patients had to be able to understand simple commands. The presence of pain or severe contractures of the elbow or knee were exclusion criteria.
The study was approved by the local medical ethics committee. Patients signed informed consent before participation in the study.
Procedure
Each patient was measured by three raters. Patients were measured in random order, with 30–45 min of rest in between two ratings. The raters, three physicians and a physiotherapist involved in daily spasticity care and experienced with using the AS, were instructed in detail about the measurement protocol a few weeks prior to assessment during a group session. Before the actual measurement, the full passive range of motion was assessed by the rater, starting from the position with maximum shortened muscles and rotating to the position of full muscle stretch at a low velocity. Subsequently, raters performed the movement twice at fast velocity throughout the entire range of motion. Raters noted the AS score on a form. In case of doubt, the lower score obtained was documented.
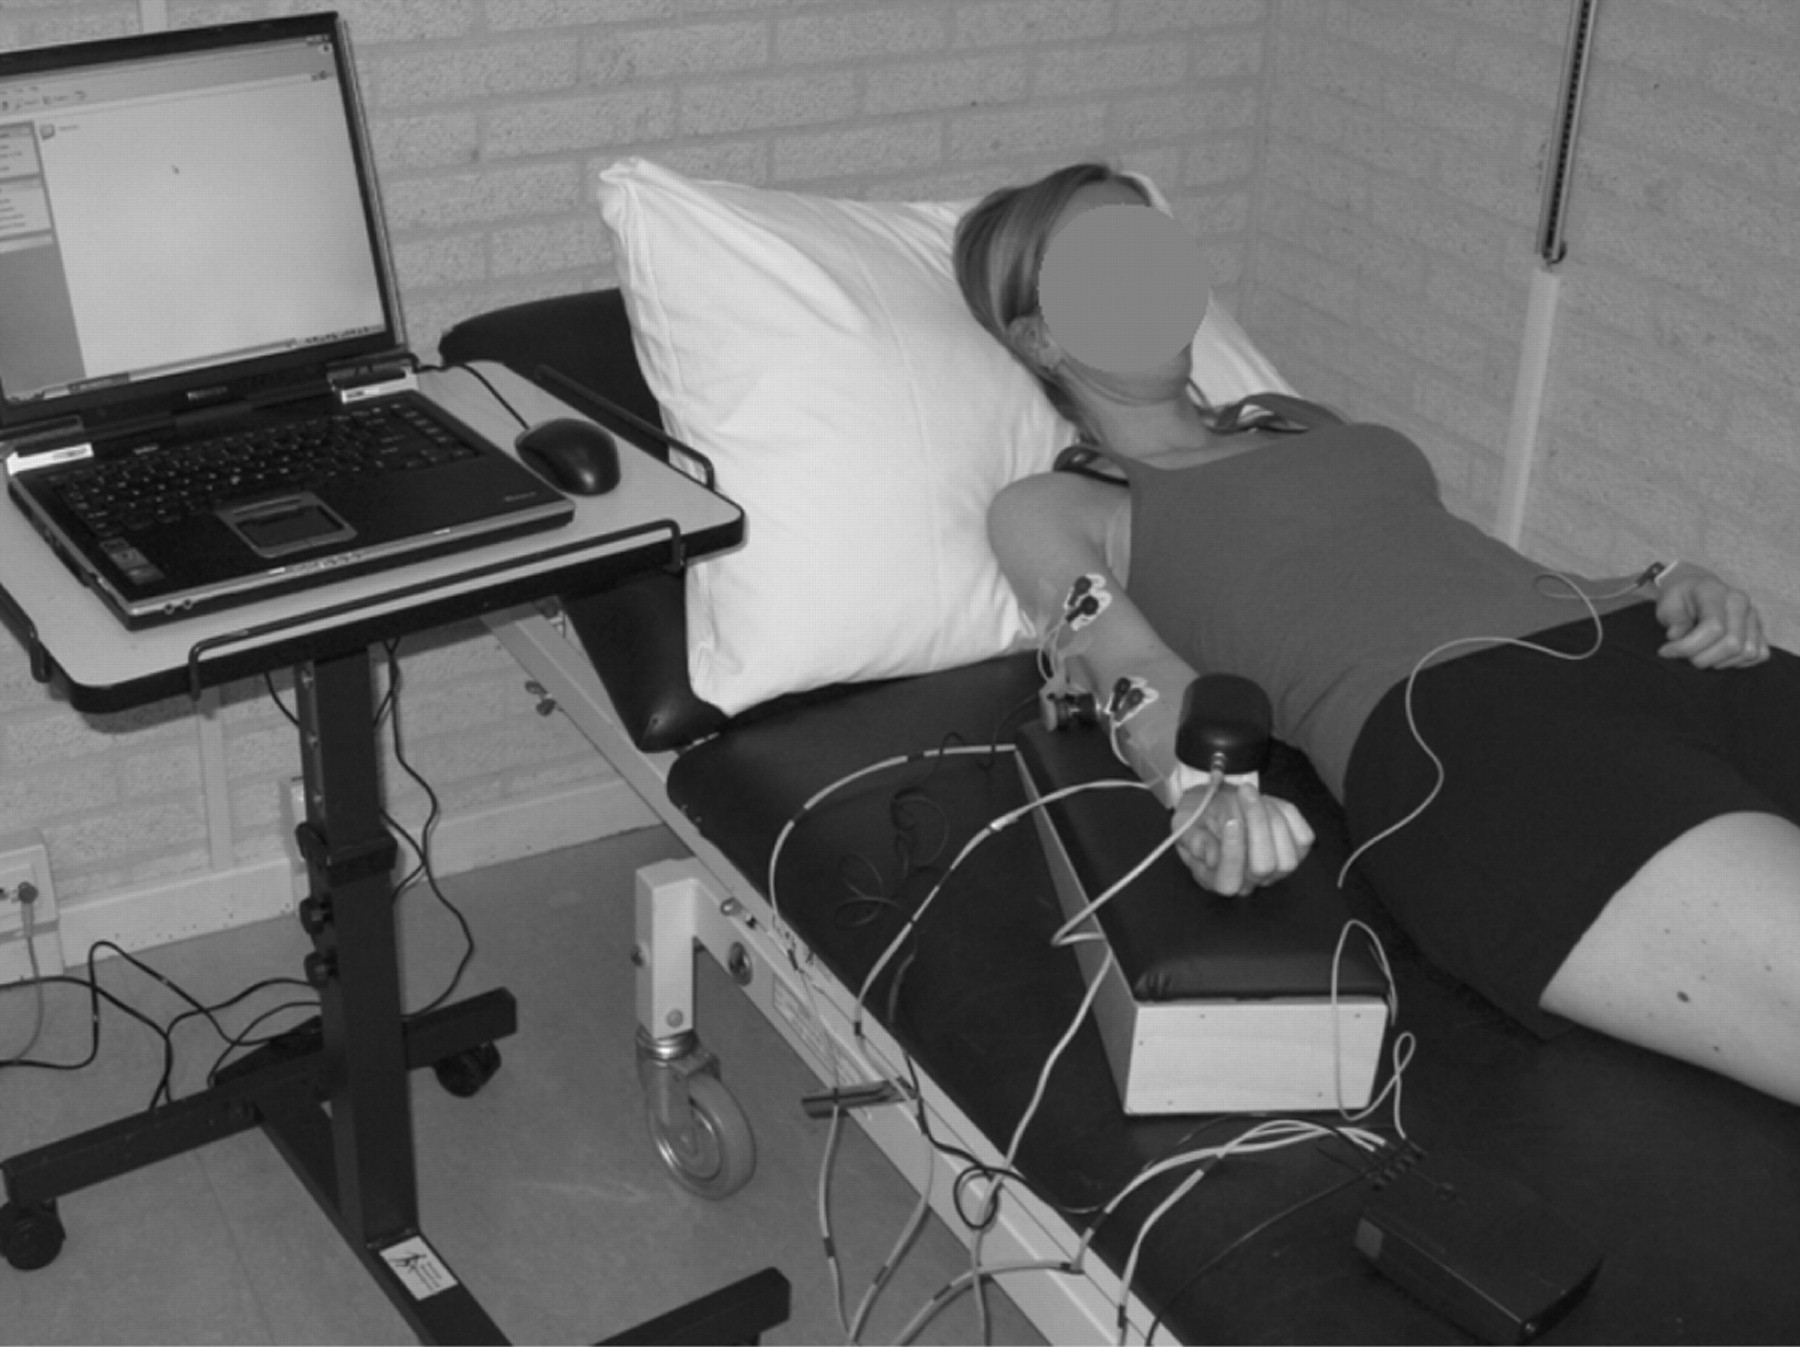
For measurement of the elbow flexors (part 1), patients were seated comfortably in the supine position with the affected arm on a supporting scale, with the shoulder abducted to about 20° (fig 1). The rater rested one hand on the upper arm of the patient and the other on the palmar side of the forearm just proximal to the wrist, simultaneously holding the dynamometer. From the starting position of full elbow flexion, the rater extended the elbow to maximum extension. For measurement of the knee extensors (part 2), patients were positioned lying on the non-tested side, with ±45° of hip flexion on the tested side (fig 2). The raters were instructed to hold the tested leg with one hand just above the knee and the other around the distal part of the lower leg, holding the dynamometer that was fixed ventrally above the ankle. From the starting position of maximum knee extension, the rater flexed the knee fully. The standardised positions were maintained without forceful stretching or discomfort for the patient. Patients were explicitly instructed to relax fully and not to react to stretches. Raters and patients were blinded to the sEMG and dynamometry output and other raters’ scores.

Demonstration of the patient's positioning for measurement of the elbow flexors.

Demonstration of the patient's positioning for measurement of the knee extensors.
Instrumentation
Surface EMG signals were obtained using bipolar, pre-gelled circular (diameter 10 mm) electrodes (ARBO H93, solid gel), with an inter-electrode distance of 24 mm. A reference electrode was placed around the wrist.
Electrodes were placed on the elbow flexor muscles biceps brachii (BB) and brachioradialis (BR), or on the knee extensor muscles rectus femoris (RF) and vastus lateralis (VL). Sensors on BB, RF and VL were placed according to the electrode placement recommendations of the SENIAM based protocol.20 BR electrodes were placed at one quarter of distance on the line between the fossa cubit and the distal radius (so on the proximal side). A reference electrode was placed at the medial aspect of the contralateral wrist.
For force measurements, a handheld dynamometer (Biometrics M500) was used which was positioned at the palmar aspect of the wrist or anterior aspect of the lower leg, such that the rater could easily hold it during AS scoring. In addition, the elbow or knee angle was registered using a mono-axial electronic goniometer, placed on the lateral side of the joint, to enable the characterisation of the movement performed during measurement by determining the start and end of the movement. All sensors were connected with the Mobi measurement device (Mobi, TMSi, The Netherlands), a blue tooth recording and processing system that allowed temporal synchronisation of the sEMG signals with analogue data from the angle and force sensors. Sample frequency was 512 Hz and data were bandpass filtered at 15–256 Hz using a second order Butterworth filter.
Data analysis and outcome parameters
The AS was scored according to the original scale (score 0–4).4
Outcome parameters were selected in order to reflect: (1) reflex muscle activity on stretch while rating the AS, using sEMG; and (2) the total resistance felt by the raters while rotating the limb, using a dynamometer.
From sEMG recordings, root mean square values (μV) of each muscle during joint rotation were calculated, representing the average muscle activity during stretching of the muscle. Subsequently, the total amount of EMG activity was calculated by integrating the root mean square during the whole joint rotation (area under the curve, AUCmuscle (μV×s)). The latter was considered to give better representation of the intensity of muscle activity during the whole rotation.
Similarly, the area under the force curve was calculated from the dynamometer data, representing the intensity of applied force or the resistance during joint rotation (resistance (N×s)).
Goniometry recordings were used to determine the start and end points of the muscle stretching phase, from which movement characteristics during joint rotation, such as range of movement (°), duration (s) and mean angular velocity (velocity (°/s)), were derived.
The parameters AS score and AUCmuscle were used as primary outcome measures.
Statistical analysis
Descriptive statistics were used for sociodemographic and outcome variables. Mean values of each instrumentally obtained parameter were computed out of the two performed elbow extension or knee flexion movements. In a few cases only one cycle was used for analysis because of failure to perform one of the movements properly, indicated by the rater, or for technical reasons (eg, recording problems).
Construct validity of AS for each rater separately was investigated, by calculating the association between AS and AUCmuscle, using Spearman’s correlation coefficient. Additionally, the correlation coefficient was calculated between AS, resistance and velocity.
Inter-rater reliability of the AS was evaluated first by calculating raw overall agreement between raters. Subsequently, generalised kappa for the three raters was calculated. In addition, the intraclass correlation coefficient (ICC) for absolute agreement was calculated.21 A linear mixed model analysis was performed to obtain insight into the weight of each independent variable (AUCmuscle, resistance and covariate velocity) in explaining the dependent variable AS. In order to explore the variability between raters, the factor rater was also added to the model. The “eyeball test” was used to test the assumption of normally distributed residuals. The percentage of explained variance (first level R2) for the model was calculated according to the formula of Snijders and Bosker.22
For statistical analysis, SPSS 11.5 was used. For calculation of the generalised kappa, Excel software was used. Alpha was set at 0.05 for statistical significance.
Results
In total, 30 patients were included in this study, of whom 19 patients participated in each part. The characteristics of both groups are summarised in table 1. In the first part of the study, all 19 patients were measured by rater 1, 18 by rater 2 and 16 patients by rater 3. Some dynamometry and sEMG data were missing in three patients. In part 2, all 19 patients were measured by raters 1, 3 and 4. Some dynamometry and sEMG data were missing in one patient; dynamometry data were missing in another patient.
Group characteristics
AS score “0” was rated in 22% of the measurements, “1” in 44%, “2 in 23%, “3” in 11% and “4” in 1% of the measurements, with comparable distributions in both parts of the study. During slow stretch no severe contractures were found.
Figure 3 shows an example of muscle activation patterns of knee extensors and resistance during AS scoring by rater 1. The medians and ranges of the movement characteristics during scoring for each rater are shown in table 2.

Example of surface electromyography, knee angle and dynamometry output during measurement of a patient with hereditary spastic paraparesis, measured by rater 1. The goniometry signal between the vertical lines corresponds to the two consecutive fast knee flexion movements and represents the stretch phase of the knee extensor muscles.
Descriptive statistics of the movement characteristics per rater
Construct validity
Part 1 (elbow flexor muscles)
The results for each rater are shown in table 3. For all raters AS was significantly moderately associated with resistance. AS was not associated with sEMG parameters, except for rater 2, for whom a positive association was found with AUCBB, but not with AUCBR.
Spearman correlation coefficients for the association between AS and muscle activity, resistance and angular velocity
Part 2 (Knee extensor muscles)
Table 3 shows the results of the knee extensor measurements. A consistent finding was the marked positive association between AS and resistance across the three raters. In addition, all three raters showed a moderate positive correlation between AS and AUCVL, rater 3 and 4, and also between AS and AUCRF.
Reliability
Part 1 (elbow flexor muscles)
Overall agreement of AS scores between raters 1 and 2 and between raters 1 and 3 was 44%. Overall agreement between raters 2 and 3 was 38%. The generalised kappa for the three raters (n = 16) was 0.20. The ICC for absolute agreement concerning the AS scores of the three raters was 0.58 (95% CI 0.30 to 0.81).
Part 2 (knee extensor muscles)
Overall agreement of AS scores between raters 1 and 3 was 32%. Between raters 1 and 4 it was 53% and between raters 3 and 4 it was 42%. The generalised kappa for the three raters (n = 19) showed very low agreement: κ = 0.16. ICC for absolute agreement was 0.63 (95% confidence interval 0.39 to 0.82).
The role of angular velocity in the variability between raters
Part 1 (elbow flexor muscles)
Table 3 shows negative associations between AS and velocity in raters 2 and 3 (p<0.01). The association between velocity, sEMG parameters and resistance was explored further (table 4). In all raters, velocity was highly negatively associated with resistance. In rater 2, velocity was also moderately negatively associated with AUCBB; in raters 2 and 3 with AUCBR.
Spearman correlation coefficients for the association between angular velocity, muscle activity and resistance per rater
Table 5 shows the results of linear mixed model analysis. None of the parameters AUCmuscle, resistance or velocity appeared significantly associated with AS. However, the factor rater significantly affected AS outcome (p<0.05). The model explained 34% of the variance in AS of the elbow flexor muscles.
Linear mixed model with Ashworth Scale score of the elbow flexors as the dependent variable (part 1)
Part 2 (knee extensor muscles)
The negative correlation between AS and velocity was marked and statistically significant for each of the three raters (see table 3). Table 4 shows a marked and statistically significant negative association between velocity and resistance, except for rater 4. The negative association with muscle activity of the knee extensors was moderate and statistically significant in all cases.
Table 6 shows the results of linear mixed model analysis for the knee extensor measurements: resistance and velocity were significantly associated with AS while AUCRF and AUCVL were not. However, the factor rater also showed a highly significant association (p<0.001). This model explained 65% of the variance in AS of the knee extensors.
Linear mixed model with Ashworth Scale score of the knee extensors as the dependent variable (part 2)
Discussion
This is the first study investigating both the construct validity and inter-rater reliability of the AS using real-time sEMG and dynamometry recordings. The results of this study show that the methodological characteristics of AS are unsatisfactory for the assessment of spasticity.
Construct validity
The contribution of muscle activity parameters, representing involuntary muscle activity when the muscle is stretched, on the variability in the AS score appeared to be low, in particular in the elbow flexor muscles. The association between the AS and resistance was generally stronger than the association between AS and AUCmuscle. This finding is in agreement with most other studies7 but a recent study on the agreement between various measures of spasticity23 found no consistent relationship of biomechanical measures with the MAS. In the same study, sensitivity of the MAS, when compared with sEMG outcomes, was low.
In present study, the association between resistance and AUCmuscle was also not strong, indicating that even objectively measured resistance is not a good representation of reflex muscle activity. Resistance was calculated as force–time integrals, instead of the more commonly used slope of the force–angle curve.24 Force–time integrals are influenced by the duration of joint rotation, which was assumed to be one of the features that contributed to the eventual score for resistance perceived by the individual rater. Remarkable is the large inconsistency between raters. It appeared that the large variation in angular velocity within and between raters, which was associated highly with both AS and resistance, acts as a confounder in AS assessment.
The results of our study differ significantly from the study of Sköld and colleagues25 who recorded sEMG while scoring the MAS of knee flexors and extensors in patients with spinal cord injuries. Although comparison with the present study is problematic because of differences in measurement procedures, they found that the majority of sEMG parameters were strongly associated with the MAS. However, 50% of the measurements in the study were rated as MAS scores “0”. For calculation of the Spearman rank correlation coefficient, these scores all become assigned to the same rank, causing misleading results and overestimation of the association.
Reliability
There is little consensus in literature and among statisticians about what statistical methods are best to analyse rater agreement.6 The overall agreement between raters gives a general idea about the agreement of the individual scores in the same patient group. In this study, rather low values, up to a maximum of 53%, were found. The kappa coefficient was very low in both upper and lower limb measurements. However, the kappa coefficient can be considered less appropriate for this study because it is very stringent for a scale with five categories.21 A weighted kappa, which takes partial agreement into account, could have been used. It is, however, identical to the ICC when the most commonly used weighing scheme is applied.21 The ICC for absolute agreement between the three raters was 0.58 for AS scoring of elbow flexors, and 0.63 for AS scoring of knee extensors. However, overestimation of the ICC is a major problem when the between subjects variance is high,26 which is likely in this study population. Another limitation of using ICC is that it assumes equal spacing between categories, which is probably not the case in the AS.
Several explanations can help in understanding the findings in this study. Most importantly, raters may differ in defining the specific rating levels of the AS or in the definition of the measured construct itself (ie, spasticity or perceived resistance against passive movement). The actual rating levels of the AS (0–4) can be viewed as an arbitrary categorisation of the underlying construct spasticity, which is a continuous trait. The perceived resistance to passive movement is an aggregate composed of various physical features and weights attached to each feature. Raters may vary in terms of which feature they notice and the weights they associate with each. This is well illustrated by the results of this study. As shown in table 2, the movement characteristics of the rotations differed largely between and within raters. The differences between raters were shown to play a significant role in the eventual AS score, which gives ground for stratified presentation of the results per rater.
There is no standard on how much reliability is “good enough”.21 An ICC of 0.63 can be considered insufficient for use in scientific research, in particular when used as a single outcome measure (eg, see Zajicek and colleagues27). When the test is used for individual judgement, even higher reliability is required.21
Study limitations
For the assessment of the contribution of each variable to the AS, we used a linear mixed model. This model assumes that the dependent variable is a continuous variable, which is not the case for the AS. In addition, sample size for the study was rather small. Nevertheless, for illustration purposes only we considered the model sufficiently robust.
Although there is some heterogeneity in our population, there is no reason to assume that the nature of the upper motor neuron lesion influences the results in this cross sectional study although it might have increased the between subjects variance. Finally, in the upper limb study, some additional error might have been introduced by the fact that gravitational force opposed elbow extension during the first part of the movement and assisted during the second part. In the lower limb study, this effect was reduced due to limb rotation in the horizontal plane. In addition, the brachialis muscle, another important elbow flexor, was not measured with sEMG because of its deep position.
In summary, the results of this study show that the methodological characteristics of the AS are unsatisfactory and that the AS should not be used as a single outcome measure for the assessment of spasticity. It is essential that both researchers and clinicians are very well aware of the limitations of this scale.
Conclusion
Ashworth Scale outcomes appeared to be poorly related to simultaneously measured reflex muscle activity. In its current form, the Ashworth Scale is therefore insufficiently valid and reliable as a measure for spasticity. We should therefore stop using it as a single outcome measure and focus on newer and promising methods, preferably including sEMG applications.
Acknowledgments
The authors would like to thank Esther Los (MD) and Karin Groothuis-Oudshoorn (PhD) for their contribution to this study.
REFERENCES
Footnotes
See Editorial Commentary, p 2
Competing interests None.
Ethics approval The study was approved by the medical ethics committee of the Rehabilitation Centre.
Patient consent Obtained.
Provenance and Peer review Not commissioned; externally peer reviewed.
Linked Articles
- Editorial commentary