Article Text

Abstract
Whiplash associated disorders are a medicolegally controversial condition becoming increasingly worrisome in the western world. This study was designed to evaluate perfusion and glucose metabolism in whiplash brain. Using Tc-99m-bicisate (ECD) single photon emission computed tomography (SPECT) and F-18-fluorodeoxyglucose (FDG) PET, six clinically and neuropsychologically controlled patients (patient group) with whiplash syndrome and 12 normal controls (control group) were investigated. Standardised elliptical regions of interest (ROIs) were determined in three adjacent transaxial slices in the frontal, parietal, temporal, and parieto-occipital cortex, cerebellum, brain stem, basal ganglia, and thalamus. For PET, the glucose metabolic index (GMI; =ROI uptake/global uptake at the level of the basal ganglia) and, for SPECT, the perfusion index (PI; =ROI/global) were calculated. In the patient group there was significant hypometabolism and hypoperfusion in the parieto-occipital regions (on the right (R) and left (L) side) compared with the control group: PET data: GMI parieto-occipital R: control 1.066 (0.081) (mean (SD)), patient 0.946 (0.065); P=0.0092, Mann Whitney. GMI parieto-occipital L: control 1.034 (0.051), patient 0.922 (0.073); p=0.0067. SPECT data: PI parieto-occipital R: control 1.262 (0.066), patient 1.102 (0.063); P=0.0039. PI parieto-occipital L: control 1.226 (0.095), patient 1.098 (0.075); P=0.0273. In some patients there was hypometabolism (>2 SD of control) in regions other than the parieto-occipital region. It is hypothesised that parieto-occipital hypometabolism may be caused by activation of nociceptive afferent nerves from the upper cervical spine.
- positron emission tomography
- single photon emission tomography
- whiplash syndrome
- parieto-occipital hypometabolism
Statistics from Altmetric.com
- positron emission tomography
- single photon emission tomography
- whiplash syndrome
- parieto-occipital hypometabolism
The "whiplash brain" is an often seen and therefore important post-traumatic condition which has been ignored by modern imaging diagnostics for years. Its importance is unquestionable. For example, in the United States there are more than one million whiplash injuries every year.1
The whiplash injury is defined as distortion of the cervical spine which results from acceleration forces. As well as cervical symptoms, cerebral symptoms may appear. Patients often complain of headache, vertigo, auditory disturbances, tinnitus, disturbances in concentration and memory, difficulties in swallowing, impaired vision, and temporomandibular dysfunction.2 If these symptoms persist, they may become debilitating for the patient. About 5% of patients with whiplash remain incapacitated after one year.2
There is little information on the role of diagnostic imaging of the brain in patients with whiplash injury. Morphological imaging methods such as CT and MRI have been unable to delineate traumatic brain lesions in patients with whiplash injury.3-5 By contrast, results from functional brain perfusion imaging using SPECT and the agent D,L-hexamethylpropyleneamine oxime (HMPAO; exametazine; Ceretec®) disclosed a pattern of biparieto-occipital hypoperfusion in most patients.4 Furthermore, a recent study indicated that N,N"-1,2-ethylene-diylbis-L-cysteine diethyl ester dihydrochloride (ECD; bicisate; Neurolite®) SPECT imaging may be more accurate than HMPAO in evaluating diminished brain perfusion in these patients.5 Moretti et alassumed that the increased blood elimination of ECD compared with HMPAO may be responsible for the superior brain lesion to normal tissue contrast shown by ECD.6 Although a good correlation between the tracer fixation of ECD and regional cerebral blood flow was found in normal controls, some studies showed that ECD was not able to detect hyperperfusion in acute infarcted brain tissue.7 8This could be explained by the assumption that, by contrast with HMPAO, cerebral uptake of ECD depends not only on regional cerebral blood flow but also on cerebral metabolism.8 This has also been discussed in late ictal temporal lobe epilepsy.9
Whereas SPECT has shown a reduction of cerebral blood flow with HMPAO and of cerebral perfusion and metabolism with ECD, little is known about pure glucose utilisation in "whiplash brain". Therefore, this study was designed to answer the following questions: (1) Is there a typical pattern of abnormalities of glucose metabolism which can be detected by PET using the F-18 labelled agent fluoro-2-deoxy-D-glucose (FDG)? (2) Do findings in ECD-SPECT and FDG-PET imaging correlate or are there discrepancies?
Clinical and neuropsychological findings and perfusion and glucose metabolism patterns in patients
Patients and methods
The study was approved by the ethics committee at the Rehabilitation Clinic Rheinfelden, Switzerland. Each study participant signed an informed consent form, after the investigative nature of the study, its risks, and its merits had been explained.
STUDY POPULATION
Twelve normal controls (mean age 44 (SD 19) years (range 18 to 74 years) and six patients (mean age 41 (17) years (range 21 to 70 years) were studied. All participants underwent extensive clinical and neuropsychological testing as previously described 8 (SD 2) days before SPECT imaging.10 In brief, patients and controls were interviewed about headache, neck pain, brachialgia, vertigo, nausea, visual symptoms (blurred vision, scintillating scotoma, oscillopsia), irregular menstruation, impaired memory or concentration, depression, sleep disturbances, anxiety, and instability. Neuropsychological testing included a test battery (in total 27 tests) on attention and concentration, and memory and higher cognitive functions.10
In controls, no abnormal clinical or neuropsychological findings were found.The table lists findings for all patients. For all study participants there were no anamnestic hints of neurovascular or neurodegenerative diseases, or of basilar artery migraine and other types of migraine. None of the participants received vasoactive or neuroactive drugs. In addition, CT or MRI of the neurocranium showed no pathological findings in patients or controls.
PET AND SPECT IMAGING
PET and SPECT imaging were separated by 50 (SD 57) days (range 11 to 175 days). First SPECT imaging and then PET imaging was performed. The interval from day of accident to day of SPECT imaging was 20 (SD 21) months (range three to 63 months).
RADIOPHARMACEUTICALS
For PET imaging, all participants were injected with 370 MBq FDG, whereas for SPECT imaging, 700 MBq Tc-99m-ECD were given by slow intravenous injection into a peripheral vein.
F-18-FDG and Tc-99m-ECD were synthesised and prepared as previously reported.3 11
PET STUDY PROTOCOL
Before the PET procedure started, subjects had to empty their bladders. Then, patients and controls were placed on a bed in the preparation area in a quiet room with dim lights and closed eyes, remaining awake during the 10 minutes waiting time before injection. After injection, patients and controls remained for another 30 minute uptake period on the bed. Then, the head of each subject was positioned parallel to the orbitomeatal line with the aid of a laser beam, after it was placed in a moulded thermoplastic head support to minimise head movement during the scanning procedure. All subjects were studied at rest. The acquisition started about 35 minutes after injection. PET imaging was performed on a Siemens-CTI ECAT EXACT tomograph. This device records 31 planes simultaneously, which encompass a 10.8 cm field of view. The spatial resolution is 6.0 mm full width at half maximum. Photon attenuation was automatically calculated by a Siemens-CTI standard software routine.12 A total of six frames of five minutes duration each was acquired. Images were reconstructed using filtered back projection (Shepp-Logan filter, cut off 0.3 cycles/pixel). For data analysis, summed images were used (summing the dynamically acquired frames 1 to 6 into one image).
SPECT STUDY PROTOCOL
Before the SPECT procedure started, each study participant had to rest for 10 minutes in a quiet room with dim lights and closed eyes. After injection, patients and controls remained for another 10 minutes in the room. Then the head of the subject was aligned parallel to the orbitomeatal line with the aid of a laser beam, after it was positioned in an individually formed head mould (urethane foam poured into a polystyrene holder). All subjects were studied at rest. Brain imaging was started about 40 minutes after injection. A Picker triple headed SPECT camera (PRISM 3000 XP, Picker International, Highland Heights, Ohio; 40 angular increments over 120° at 30 seconds per view; filters: Metz, Ramp; low energy (140 keV), high resolution (LEHR) collimator, 64 x 64 matrix, field of view 24 x 40 cm) was used. The spatial resolution was 10.0 mm full width at half maximum; 18 transaxial slices were reconstructed. Each slice was 6.33 mm thick.
DATA ANALYSIS
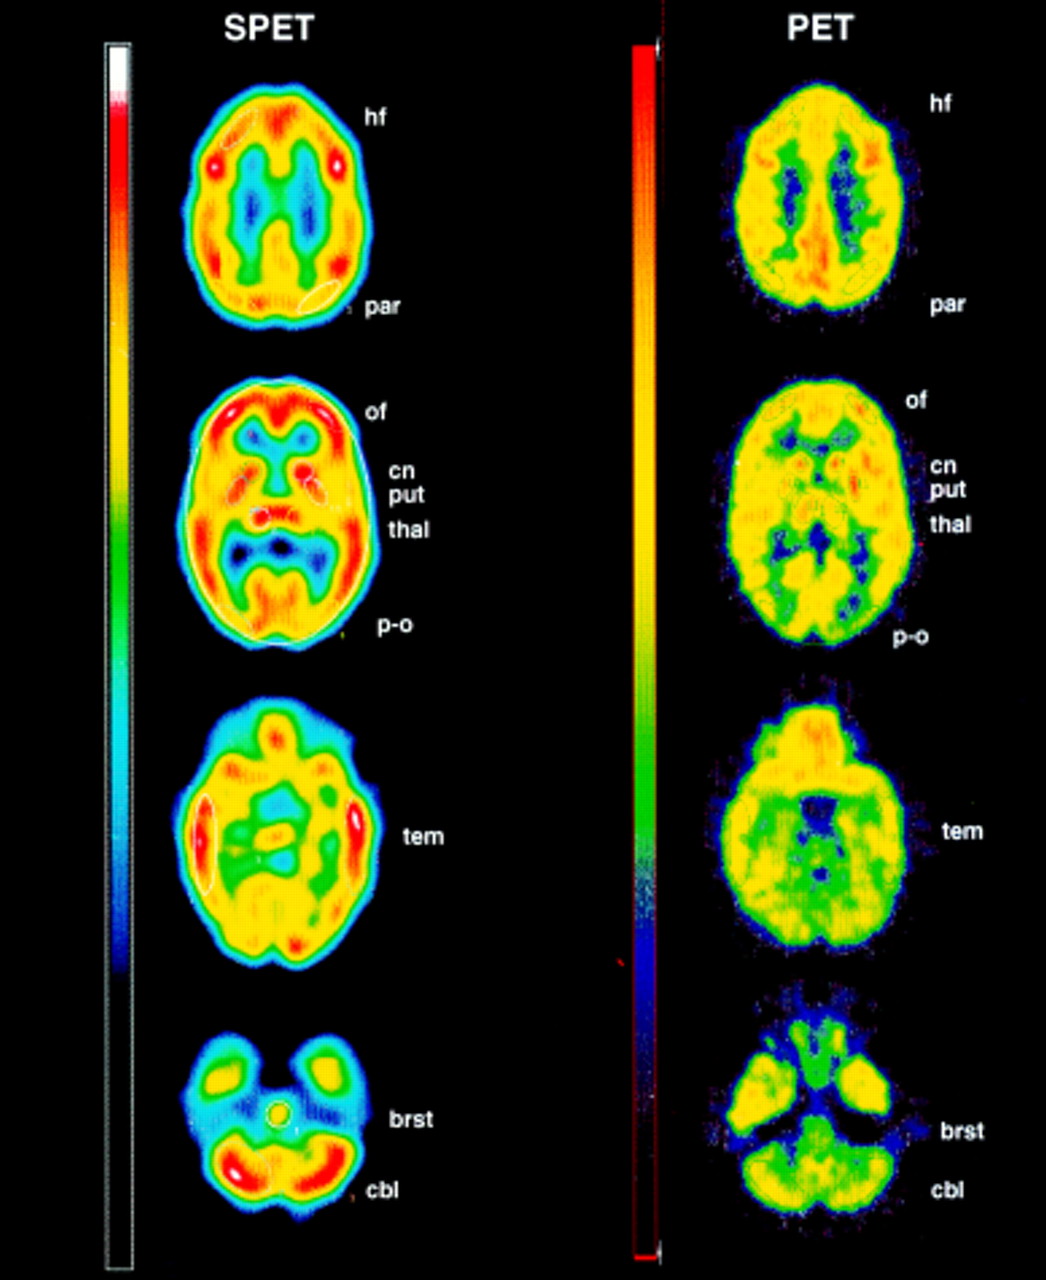
For both PET and SPECT standardised cortical and subcortical elliptical regions of interest (ROIs) were assigned to three adjacent transaxial slices of the following regions by consensus of two independent investigators (figure):
- (1)
- highly frontal (hf); (2) parietal (par); (3) occipito-frontal (of); (4) temporal (tem); (5) parieto-occipital (p-o); (6) thalamus (thal); (7) putamen (put); (8) caudate nucleus (cn); (9) cerebellar (cbl); (10) brain stem (brst); (11) global at the level of thalamus and basal ganglia.
Shape and size of ROIs were the same in all patients and controls, as the ROI templates were copied into the corresponding planes of each study. Shape and size of global ROIs were fitted to actual head form by manipulation. The position of all ROIs was adjusted to the corresponding anatomical localisation. In each ROI the average uptake per pixel per time was determined. The SPECT pixel ratio of ROI to global was equal to the PET pixel ratio of ROI to global.
For PET, ROI analysis was performed with a Sun Sparc station and Sunview software. To allow interindividual comparisons, regional cerebral metabolism was normalised by global glucose metabolism (glucose metabolic index, GMI=ROI−uptake/global uptake) determined from the global brain ROI at the level of the thalamus and basal ganglia.
For SPECT, ROI analysis was performed with the region utility software of the Picker Odyssey workstation. For between subject comparisons, regional cerebral perfusion was normalised by global perfusion (perfusion index, PI=ROI−uptake/global uptake) determined from the global brain ROI at the level of thalamus and basal ganglia.
STATISTICAL ANALYSIS
Data are expressed as means (SD). Differences between groups were assessed by Mann Whitney U test
Results
In the patient group (patient) there was a significant hypometabolism and hypoperfusion in the parieto-occipital regions (on the right (R) and left (L) side) compared with the control group (control).
PET data: GMI parieto-occipital R: control 1.066 (0.081), patient 0.946 (0.065); P=0.0092. GMI parieto-occipital L: control 1.034 (0.051), patient 0.922 (0.073); P=0.0067.
SPECT data: PI R: control 1.262 (0.066), pat 1.102 (0.063); P=0.0039. PI parieto-occipital L: control 1.226 (0.095), patient 1.098 (0.075); P=0.0273.
Group to group differences in regions other than the parieto-occipital area were not significant. However, careful evaluation of the individual metabolic pattern disclosed in one patient (6) hypometabolism in non-parieto-occipital regions only. In addition, in some patients PI or GMI values were more than 1 or 2 SD below normal control values in regions other than the parieto-occipital area(table).
Discussion
This pilot study indicates for the first time that there are abnormalities in glucose metabolism in “whiplash brain”. The findings provide evidence that in most of the patients studied there is a characteristic pattern of bilateral hypometabolism—in addition to hypoperfusion—in the parieto-occipital regions of the brain. Thus brain injury in whiplash patients might have been underreported in the past.13 As CT or MRI showed normal brain findings in all investigated patients, combined functional imaging using PET or SPECT may be more appropriate than morphological imaging alone.
An important question is whether functional imaging in whiplash brain has practical use. As neuropsychological disturbances after whiplash are mostly borderline as shown in a prospective study,14the complaints of patients with whiplash injury may often have been ignored. From our study, neuropsychological disturbances in the selected patients were not borderline, but most of the patients complained of non-specific symptoms such as concentration and memory disturbances, which are often seen in other brain disorders as well.15 It could be speculated that the parieto-occipital region of hypoperfusion and glucose hypometabolism is the “substrate” of some of the cognitive disturbances in some patients after whiplash injury of the neck.
Both parieto-occipital hypoperfusion by SPECT and parieto-occipital hypometabolism by PET are localised to the watershed zone between the territories of supply of the three major arteries.16 One hypothesis could be that this finding is linked to morphological damage to the bigger arteries. However, MRI and Doppler studies did not show obstruction of these arteries. On the other hand, stimulation of pain sensitive afferences of the trigeminal system has various and widespread effects on local vasoactive peptides and the cranial vascular system.17 Hence, our hypothesis is that parieto-occipital hypometabolism may be caused by activation of nociceptive afferences from the upper cervical spine. By contrast, the areas of hypometabolism seen in areas other than parieto-occipital may mainly be explained by brain contusion and not by the effects of activated nociceptive afferences on brain metabolism. In addition, hypometabolism in parieto-occipital regions cannot be excluded in some cases as part or entirely a consequence of diffuse axonal lesions due to acceleration forces. FDG-PET disclosed more hypometabolic areas other than the parieto-occipital region than did ECD-SPECT. This could be explained by the better spatial resolution and, therefore, the superior ability of PET to delineate normal from pathological tissue. Secondly, there may be areas with normal perfusion but abnormal glucose metabolism, even though ECD has been shown to depend not only on regional cerebral blood flow but also on cerebral metabolism.7 8 However, this uncoupling of regional cerebral blood flow and metabolism seems unlikely, as the investigated patients were scanned on average 20 months after the accident and their condition could be defined as chronic. Thirdly, the differences between PET and SPECT might be due to recovery in the interval between the two scans or due to the postictus period. In our study the variations in the period between investigations (11 to 175 days) and in the postictus period (three to 63 months) are both a cause for concern, and acute trauma studies are associated with logistical difficulties in general. Nevertheless, differences between PET and SPECT are not likely to be due to recovery in this small group of patients.
PET and SPECT, although rather costly techniques, may lend more objectivity to controversial medicolegal discussion on patients with late onset whiplash syndrome and associated disorders. Further studies on this topic with a larger population are in progress.18 19
Regions of interest superimposed on typical transaxial slices of the PET and SPECT of patient 3. The right side of the figure is the left side of the brain. For abbreviations see text.
Acknowledgments
We thank all radiographers of the Institute of Nuclear Medicine, University Hospital Basel, Switzerland, and the PET team of the Department of Nuclear Medicine, University Hospital Freiburg, Germany, for their kind help and support. This study was supported in part by the Research fund of the Rehabilitation Clinic Rheinfelden, Switzerland. It was presented in part at the EANM meeting in Copenhagen, 14–18 September 1996.