Article Text

Abstract
OBJECTIVES Recovery to normal or near normal visual acuity is usual after acute demyelinating optic neuritis, despite the frequent persistence of conduction abnormalities as evidenced by the visual evoked potential (VEP). This raises the possibility that cortical adaptation to a persistently abnormal input contributes to the recovery process. The objective of this study was to investigate the pattern of cerebral response to a simple visual stimulus in recovered patients in comparison to normal subjects.
METHODS Functional magnetic resonance imaging (fMRI) was used to study the brain activation pattern induced by a periodic monocular 8Hz photic stimulus in seven patients who had recovered from a single episode of acute unilateral optic neuritis, and in seven normal controls. VEPs and structural optic nerve MRI were performed on patients.
RESULTS Stimulation of either eye in controls activated only the occipital visual cortex. However, in patients, stimulation of the recovered eye also induced extensive activation in other areas including the insula-claustrum, lateral temporal and posterior parietal cortices, and thalamus; stimulation of the clinically unaffected eye activated visual cortex and right insula-claustrum only. The volume of extraoccipital activation in patients was strongly correlated with VEP latency (r=0.71, p=0.005).
CONCLUSIONS The extraoccipital areas that were activated in patients all have extensive visual connections, and some have been proposed as sites of multimodal sensory integration. The results indicate a functional reorganisation of the cerebral response to simple visual stimuli after optic neuritis that may represent an adaptive response to a persistently abnormal input. Whether this is a necessary part of the recovery process remains to be determined.
- functional magnetic resonance imaging
- visual recovery
- demyelinating optic neuritis
Statistics from Altmetric.com
One of the remarkable features of demyelinating diseases, both central and peripheral, is their capacity for complete recovery of function despite the persistence of gross distortions of the normal pattern of nerve conduction velocities.1-4 This is seen in optic neuritis, which in the acute stage is associated with a variable degree of conduction block and marked delay in the visual evoked potential (VEP). Recovery of visual acuity is associated with reversal of conduction block and is maintained despite, usually, the persistence of delays in the VEP.3
It is clear that the CNS has somehow adapted so that it can deal effectively with a temporally distorted pattern of input. It seems likely that these adaptive changes take place at least in part in the synaptic relays in the cerebral cortex. What is the mechanism? We have taken a first step towards answering this question by posing another, simpler, one, and using functional magnetic resonance imaging (fMRI) to answer it: “In patients who have recovered from optic neuritis, is there a change in the distribution of activity in the cerebrum in response to a simple visual stimulus, compared with normal subjects?” By stimulating the affected and unaffected eyes in each patient in separate experiments, the activation patterns from affected and unaffected eyes may also be compared.
Optic neuritis has particular value for investigating adaptive responses to focal demyelination as it represents a single anatomically well defined lesion that is readily evaluated using clinical and electrophysiological measures. We have carefully selected patients who have recovered from a single episode of optic neuritis but who do not have clinical or neuroradiological evidence of disease elsewhere in the CNS. Thus, the confounding effects of multiple disseminated lesions in the brain are avoided, allowing the fMRI results to be more easily interpreted. A short account of some of this work has already appeared.5
Patients and methods
SUBJECTS
We studied seven patients (mean age 37.8 years; three men, four women) who had attended The National Hospital for Neurology and Neurosurgery or The Moorfields Eye Hospital with a single episode of typical unilateral acute optic neuritis diagnosed according to standard criteria.6 Seven normal volunteers (mean age 31.0 years; three men, four women) were also studied. All subjects gave informed written consent. The study was approved by the National Hospital ethics committee. Patients were evaluated by a consultant neuro-ophthalmologist at presentation. On the day of study, visual acuity was measured using the Snellen chart and colour vision was assessed using Ishihara colour plates. Whole field visual evoked potentials were recorded using pattern reversal as described elsewhere.7 Patients with abnormalities on brain MRI were excluded to avoid a contribution from such lesions to the fMRI response.
IMAGING
Structural MRI
Echoplanar gradient echo MR images were acquired using a 1.5 Tesla GE Signa Horizon Echospeed system (General Electric, Milwaukee, WI,USA) with a standard quadrature head coil. High resolution echoplanar T2 weighted near axial images of the whole brain were obtained (TR=6000 ms, TE=40 ms, matrix 256×256, FOV 24 cm×24 cm), together with high resolution fat suppressed spin echo images of the optic nerves (FSE 3250/68, matrix 512×512, FOV 20 cm).8 The structural MRI brain and optic nerve scans were evaluated (with blinding to clinical details) for any abnormalities by a neuroradiologist (IFM).
Functional MRI
One hundred and twenty T2* weighted images depicting blood oxygenation level dependent (BOLD) contrast were acquired in each 8 minute experiment at each of 10 near axial non-contiguous 5 mm thick slices through visual cortex roughly parallel to the AC-PC line: TE, 40 ms; TR, 4000 ms; field of view, 24 cm×24 cm; matrix size, 96×96; in plane resolution, 2.5 mm; interslice gap, 0.5 mm.
EXPERIMENTAL DESIGN
Subjects passively viewed a visual display which alternated periodically between 20 second epochs of two contrasting conditions: (A) red 8 Hz photic stimulation to the whole visual field was presented to one eye using lightproof goggles (Grass Instruments, Quincy, MA, USA Model SV10SB) whereas the other eye received no visual stimulation; (B) no visual stimulation (darkness) was presented to both eyes. In total, 12 cycles of alternation between the A and B conditions were presented over the course of each experiment; condition B (no stimulation) was always presented first. Each subject was studied once for each side of monocular stimulation; the order of experiments was randomly decided.
ANALYSIS
Images were corrected for head motion by a two stage procedure of realignment and regression described in detail elsewhere.9There were no significant differences between patients and comparison subjects for stimulus correlated motion, which was estimated by the power of a periodic trend at the frequency of AB alternation in the time series of rotations and translations of the head in three dimensions.9 The standardised power of experimentally determined signal change at the frequency of alternation between stimulation and baseline conditions, or fundamental power quotient (FPQ), in each movement corrected fMRI time series was estimated by sinusoidal regression.10 The FPQ represents the sum of squared amplitudes of a sine and cosine wave at the frequency of AB alternation, divided by its standard error (see Bullmoreet al 10 for further details). These sine and cosine waves at AB frequency were parameterised by coefficients γ and δ respectively; the phase of periodic response in each time series was estimated by φ=tan−1 δ/γ.11 Individual brain activation maps were examined to ensure that no subject showed an extreme pattern of response that might unduly influence the result of generic brain activation mapping. Individual fMRI time series were inspected at occipital and extraoccipital sites of activation. Generic brain activation maps were computed in the standard space of Talairach and Tournoux12by a permutation test with voxel-wise one tailed probability of false positive error=p<0.0001. At this size of test, the expected number of false positive voxels in each map is less than two. Generically activated voxels were colour coded according to their phase of response and overlaid on a grey scale EPI template image to form a generic brain activation map (GBAM).13
The power of periodic response was compared between groups and between eyes within group by analysis of variance (ANOVA). The following one way ANOVA model was fitted at each intracerebral voxel in standard space:
FPQ=μ+β.F+ε
where μ is the overall mean power at the ith voxel, F is a factor coding group membership (patient or control) or stimulated eye (right or left), and ε is an error. The coefficient β was tested by permutation at those voxels that were generically activated in one or both of the groups of data being compared.14 15 The use of this permutation procedure for MRI data analysis is described in detail elsewhere.9 14 For these analyses, we set the two tailed probability of false positive error p=0.05. This relatively lenient threshold is justified by the restricted search volume for between group comparisons. Where we have tested for a significant difference in the power of response between eyes (that is, we have used repeated measures), the permutation procedure has been adjusted accordingly.
We also investigated the relation between extent of abnormal (extraoccipital) activation and neurophysiological evidence for persistently delayed optic nerve conduction in the patients. The volume of extraoccipital activation was estimated using a semiautomated contouring algorithm (DispImage, D Plummer, UCL, London UK) in each individual brain activation map. The relation between extraoccipital volume of brain activation and VEP latency was assessed by scatter plot and by a significance test of Spearman's correlation coefficient.
Results
The patient characteristics are shown in table 1. All patients had a typical clinical history of acute optic neuritis with documented loss of visual acuity at presentation, and by the time of our study had recovered normal visual acuity and colour vision. All had normal eye movements, with accurate fixation during formal visual field perimetry. Four patients had VEP recordings at presentation; three were abnormal (two were delayed and one absent). All patients had VEP recordings at the time of our study. The three previously abnormal VEPs now had normal latencies; two of the remaining three cases (with shorter clinical histories) had delayed responses; MRI of the affected optic nerve was abnormal in five of the seven cases (fig1).
Characteristics of patients
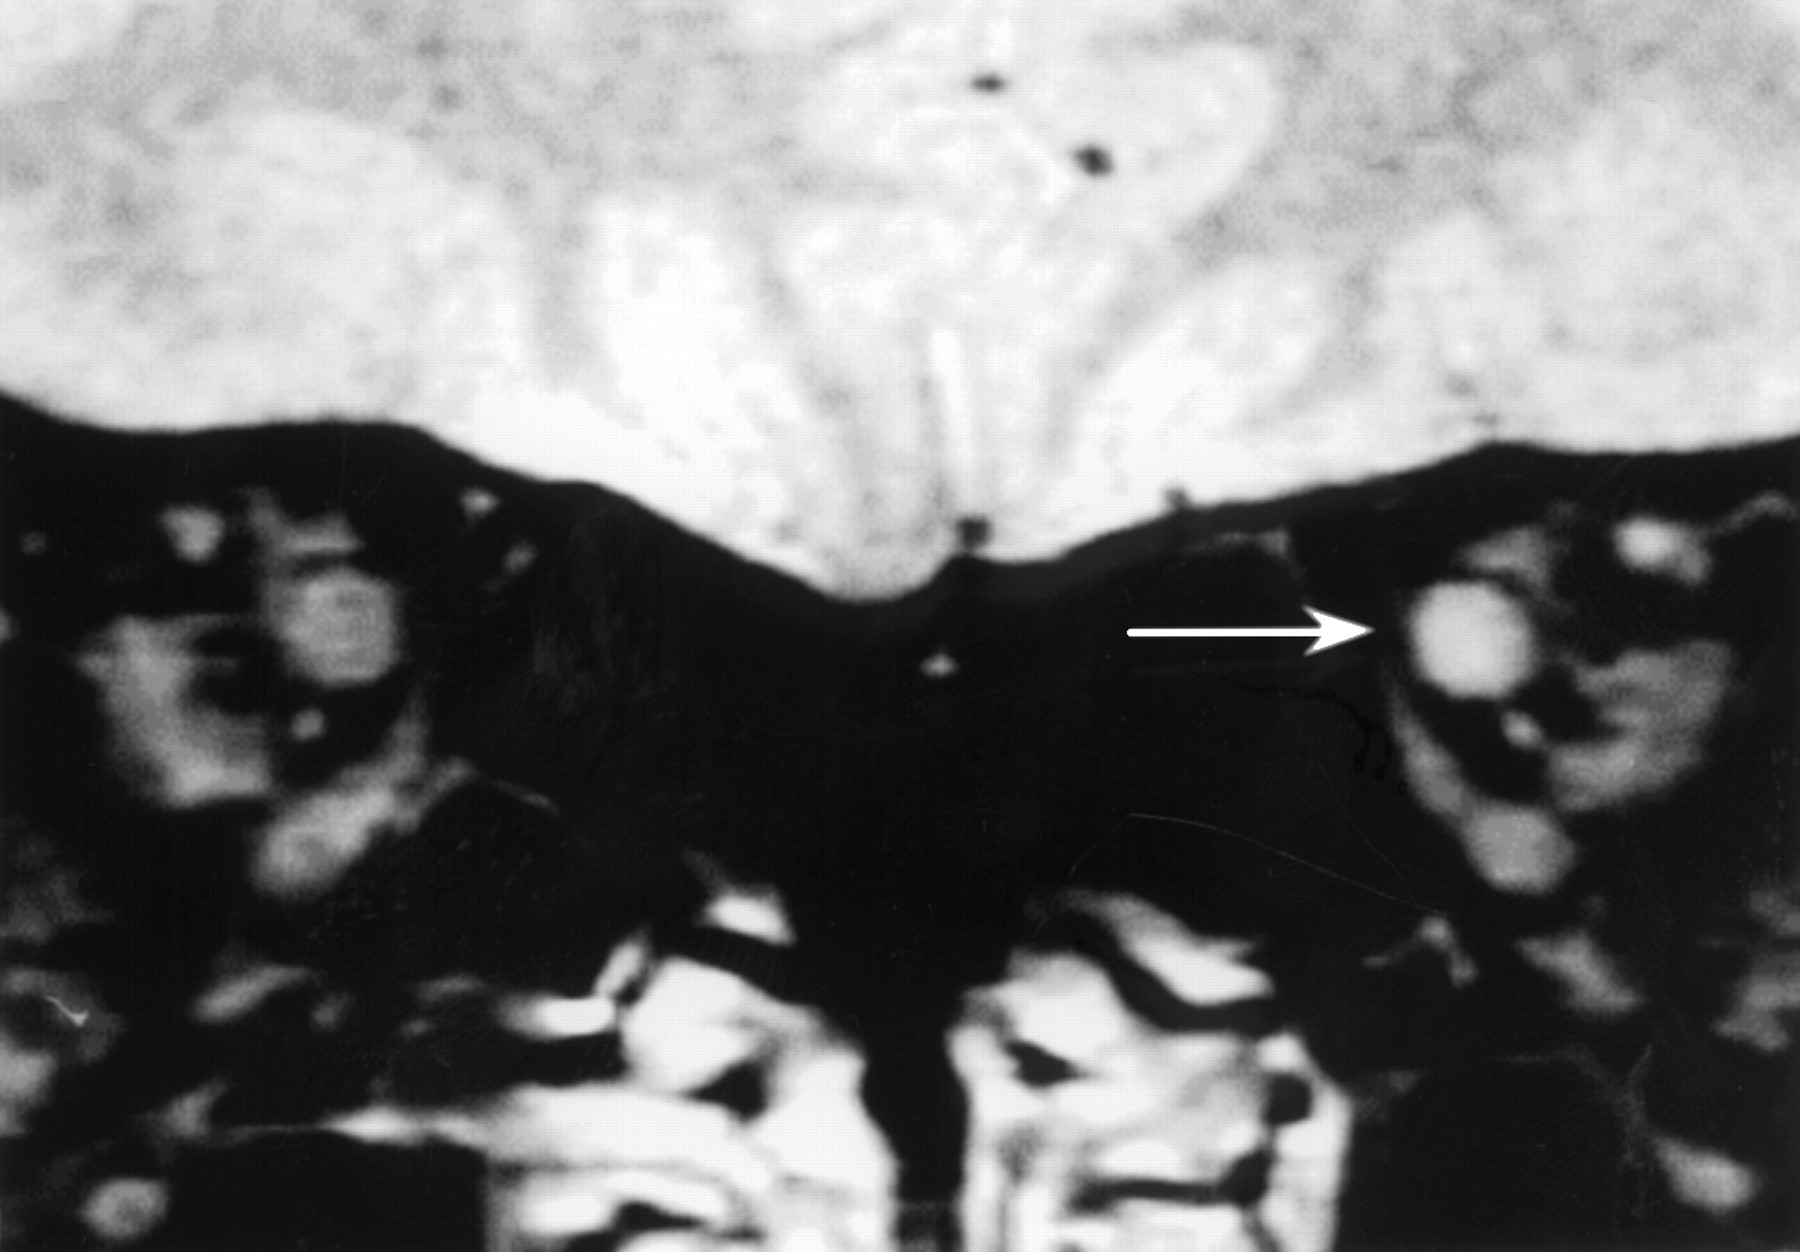
Coronal MRI through the optic nerves in a patient after a single episode of left unilateral optic neuritis 14 years previously. Note the abnormal high signal in the affected nerve (arrowed), indicating persisting structural abnormality despite the excellent clinical recovery found.
There were no significant differences between the control and patient groups in stimulus correlated motion during the fMRI studies. Selected slices from generic brain activation maps13 for patients and control subjects are shown in fig 2; coordinates of the main foci of activation in the generic brain activation maps in standard space,12 cluster sizes and FPQ values are given in table2. In the control subject generic brain activation maps (fig 2 A and B), activation in response to the stimulation of either eye was demonstrated almost exclusively in visual cortical areas (approximate Brodmann areas (BA) 17, 18, and 19). A visual impression of asymmetry in activation patterns between the left and right eyes (left eye stimulation apparently inducing greater right visual cortex activation, right eye stimulation inducing greater left visual cortex activation) was confirmed using a repeated measures one way ANOVA thresholded at p<0.05.

Generic brain activation maps from seven control subjects and seven patients showing areas of significant response to monocular photic stimulation compared with binocular darkness. The one tailed probability of false positive activation p<0.0001 for each voxel; activated voxels are colour coded according to the delay (in seconds) of periodic response relative to the onset of photic stimulation. The left side of each map represents the right side of the brain; z coordinates in standard space are given for each slice in mm.(A) In the control subject group (left eye) there is activation only in bilateral visual cortex, with a larger area of activation in the right compared with the left visual cortex. (B) The right eye response showed a similar pattern but with greater activation of the left visual cortex. (C) In the patient group (unaffected eye) there is an additional focus of activation in right insula-claustrum.(D) In the patient group (affected eye) there is additional activation of a network of multimodal processing areas including bilateral insula-claustrum, lateral temporal cortex, posterior parietal cortex, thalamus, and corpus striatum. Note that periodic response in extraoccipital areas is considerably delayed relative to the response in visual cortex.
Main areas of activation in generic brain activation maps for patients and controls
Stimulating the clinically unaffected eye in patients induced additional activation in the right insula-claustrum (BA 14) (fig 2 C). To confirm that this apparent visual difference between the group activation maps was of statistical significance, a one way ANOVA comparing the generic map for the patient's unaffected eyes (including only the six patients with a left optic neuritis to remove possible confounding effects of right-left fMRI activation asymmetry) with the generic map for the control right eye studies was performed (table 3). This confirmed increased activation in the right insula-claustrum region in patients compared with controls, but showed a significantly larger response in visual cortex (approximate BA 17,18,19) in controls.
One way ANOVA comparison between generic brain activation maps for stimulation of the unaffected eye in patients after left optic neuritis, and for stimulation of the right eye in controls showing Talairach coordinates.
In response to stimulating the recovered eye, additional extensive activations were seen bilaterally in the insula-claustrum (BA 14–16), lateral temporal cortex (BA 21 and 22), posterior parietal cortex (BA 39 and 40), orbitofrontal cortex (BA 11), corpus striatum, and thalamus (fig 2 D). A one way ANOVA comparison between the generic activation maps of the affected eye (again including only the six patients with a left optic neuritis) and the left eye maps from controls confirmed greater activation in patients in the orbitofrontal cortex, anterior insula bilaterally, and the corpus striatum (table 4), but significantly greater activation in controls in visual cortical areas (approximate BA 17,18,19). The finding of extraoccipital activation induced by stimulation of the affected eye in patients was seen in all seven individual activation maps, indicating that the group result was not influenced by a few outlier observations.
One way ANOVA comparison between generic brain activation maps for affected eye stimulation in patients after left optic neuritis, and left eye stimulation in controls showing Talairach coordinates.
A generic brain activation map for stimulation of the affected eye in the two patients with definite VEP delay at the time of fMRI showed a much greater extent of extraoccipital activation than that for the remaining five patients without VEP delay (fig 3). Furthermore, whole field VEP latency showed a strong positive correlation with the volume of extraoccipital activation (Spearman'sr=0.71, p=0.005) (fig 4).

Generic brain activation maps from stimulation of the affected eye in patients after recovery from optic neuritis (A) with VEP delay (defined as a latency prolongation of>109 ms for those under 40 years old and >122 ms for those over 40 years old) and (B) without VEP delay. z Coordinates for each slice in Talairach space are given in mm. The phase of response is coded as red (maximum fMRI signal during the stimulus condition) or blue (maximum fMRI signal during the baseline condition). The deepness of colour represents the magnitude of the fundamental power quotient (FPQ) at each voxel, a measure of the power of periodic response at the experimental frequency. Note the similar distribution of extraoccipital areas activated in both maps, but the much greater extent in those with VEP delay.

Correlation between the volume of extraoccipital activation and whole field VEP latency (including both affected and unaffected optic nerves) for seven patients after unilateral optic neuritis.
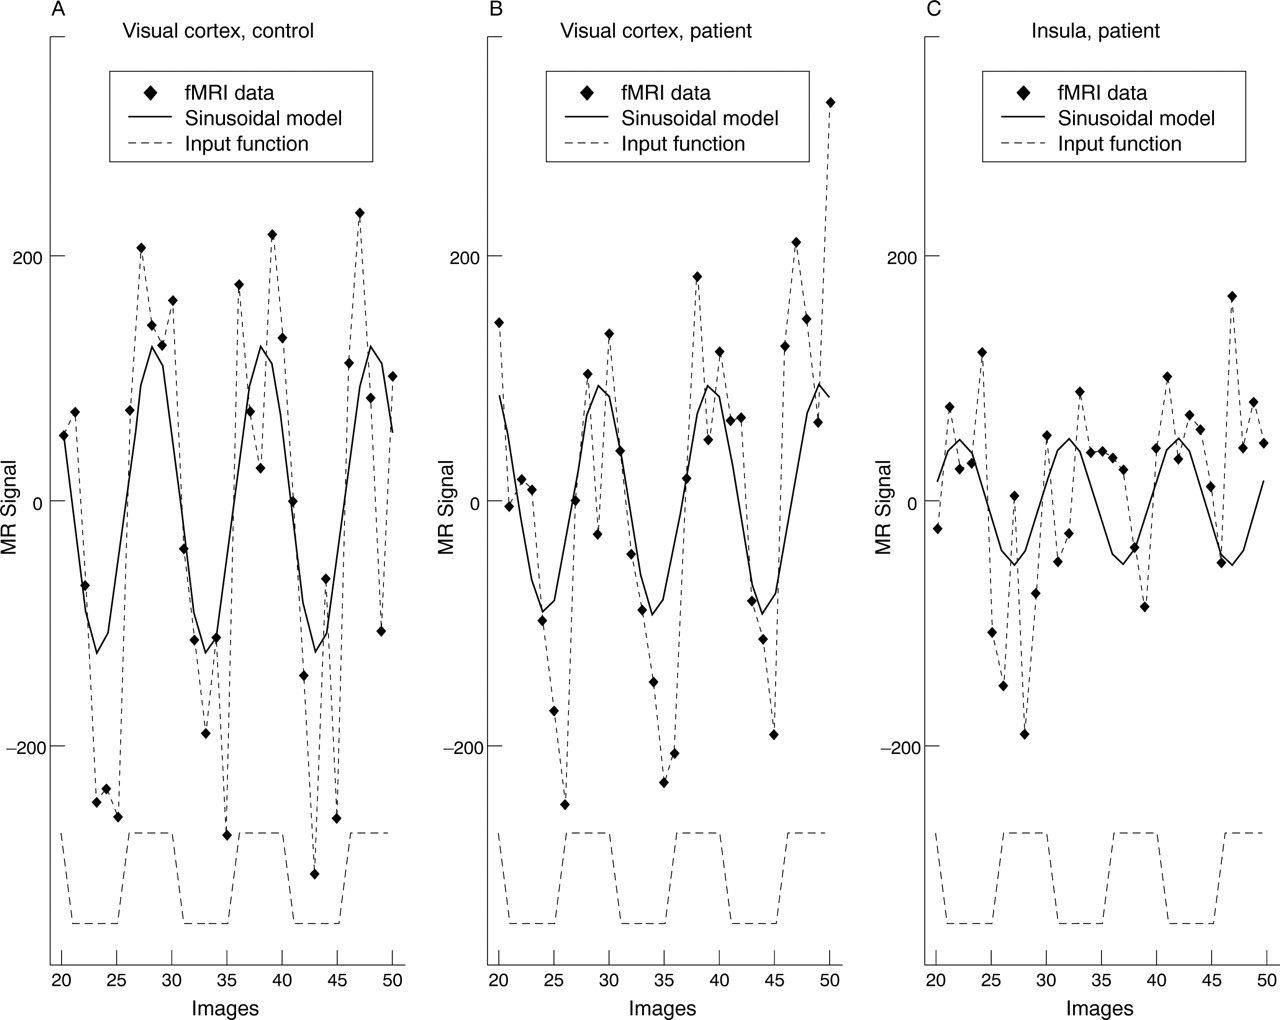
Whereas occipital regions were activated in the patient group with MR signal maximum during the photic stimulation condition, as in the control group, areas of extraoccipital activation showed a relatively delayed response with signal maximum during the early part of the dark condition; figures 2 and 5.
Regional mean fMRI time series from an individual brain activation map obtained from a 35 year old man who had fully recovered from an episode of left optic neuritis. In this experiment 20 second epochs of 8 Hz monocular visual stimulation to the recovered eye alternated with binocular darkness. The fMRI signal time series in the occipital visual cortex and in one of the areas activated outside the occipital cortex (left insula) are shown (diamonds). A periodic response to the stimulus (experimental input function; dotted square wave, bottom of figure) is seen in both regions, but is delayed in the left insula compared with the visual cortex.
Discussion
These findings show that there is indeed a change in the distribution of cortical activation by a simple visual stimulus in patients who have recovered from acute optic neuritis compared with normal subjects. Activation in response to periodic stimulation of the recovered eye occurs not only in the occipital visual cortex, but also in the insula-claustrum, lateral temporal, posterior parietal and orbito-frontal cortices, corpus striatum, and thalamus (fig 2 D, table2). Although these sites are not normally activated by a simple visual stimulus, they are known to have extensive connections with visual processing areas, and some of them have been proposed as areas of multimodal sensory integration.16 The claustrum is a small nucleus, the function of which remains uncertain. It is well developed in primates, and its size increases roughly in proportion to the volume of cerebral cortex.17 It has complex projections to many cortical regions. It has rich connections with BA 17, 18, and 19 and the visual thalamus,17 and receives input from both visual fields18; furthermore the claustrum can functionally modulate the response properties of neurons in the primary visual cortex (BA 17).19 The claustrum receives input from, and projects to multimodal visual and auditory areas, and has recently been proposed as a site of transfer of information between tactile and visual modalities.20 These extensive visual connections provide a plausible physiological substrate for activation of the claustrum during simple visual stimulation. The insula has also been proposed as a multimodal convergence area,21 and damage to the insula in humans causes a syndrome of multimodal neglect.22 The anterior insula has substantial connections with the orbitofrontal cortex and the thalamus as well as limbic areas.21 The posterior insula has connections with frontal, temporal and parietal cortices, and the thalamus.21 The medial pulvinar thalamic nucleus in turn projects to higher order multimodal association cortex.23The lateral temporal cortex (BA 21 and 22) and posterior parietal cortex (BA 39 and 40) were activated in patients in response to simple visual stimulation of the affected eye, but not in normal controls. These areas have been suggested to be sites of multimodal sensory processing on the basis of homologies with primate multimodal areas.16 Finally there is experimental evidence that the corpus striatum, although classically thought to have mainly a motor role, receives functional input from the visual cortex.24
Thus the areas that are activated during stimulation of the affected eye in patients constitute a cortical and subcortical network of areas known to be involved in visual or multimodal sensory processing. The activation map for the unaffected eye showed a limited activation of this network, confined to the right insula-claustrum region at the statistical threshold used in this study. This could be a response to abnormal input due to clinically silent abnormality of conduction in the unaffected optic nerve (a well recognised phenomenon).2 An alternative mechanism, suggested by the fact that visual input to the claustrum is binocular,18 is that a change in functional organisation in the claustrum due to disease in one eye could result in altered activation additionally on stimulating the other clinically unaffected eye. Why this activation is lateralised to the right side is uncertain, although it is noteworthy that six of seven unaffected eyes were on the right.
Although the significance of these areas of extraoccpital activation in the recovery process in optic neuritis remains to be determined, and the number of cases is small and must be increased, the data suggest that they may be related to the degree of VEP delay. Firstly, the greater extent of extraoccipital activation from stimulating the affected eye in patients with VEP delay compared with those without VEP delay suggests that slowed conduction in the optic nerve is a contributory factor in producing, and sustaining, an abnormal distribution of cerebral response to visual stimulation. Secondly, there is a strong correlation between the volume of extraoccipital activation and the VEP latency. The origin of a prolonged VEP latency is complex, but is likely to be in part due to slowed conduction in completely or partially demyelinated axons; a reduction and dispersion of the normal input due to unequal slowing in different fibres may also contribute.25 In the acute phase of optic neuritis there is a decrease in amplitude and an increase in the latency of the VEP. As recovery of vision occurs the amplitude recovers to a variable extent, but the prolonged latency persists for much longer, even when full visual recovery has usually occurred.25 Our findings suggest that the extraoccipital network activated in patients after optic neuritis may represent an adaptive cerebral response to VEP delay, which could contribute to the recovery process.
The phase of periodic fMRI signal change in the extraoccipital areas activated only by patients was delayed relative to the phase of response to photic stimulation in visual cortex; figure 2 C and D and fig 5. On the assumption that locally increased BOLD magnetic resonance signal reflects increased synaptic activity, whether excitatory or inhibitory,11 there are several possible explanations for this finding. Firstly, extraoccipital multimodal areas could be excited by delayed propagation of neural activity from primary visual areas. The delay that we have found between occipital visual cortex and these areas (of about 10 seconds) is, however, considerably longer than delayed hierarchical excitation of visual cortical processing areas (shown by electrophysiological studies to be of the order of milliseconds), making this unlikely. A second possibility is that multimodal regions are actively inhibited in patients during the dark condition (causing locally increased fMRI signal), from which they are released (disinhibited) at the onset of photic stimulation. Disinhibition (by experimental reduction of inhibitory input to the superior colliculus, a putative subcortical multimodal region) has been suggested as a contributory mechanism in recovery from experimental injury to mammalian visual cortical areas (the Sprague effect),26 but the role of such a process in recovery from anterior visual pathway lesions has not been investigated. A third possibility is that extraoccipital areas show a relative increase in activity during the baseline condition that may be suspended during visual stimulation. Finally, the peak fMRI signal could occur later in multimodal areas due to a different, delayed haemodynamic reponse. There is evidence that the response to a semantic decision task in multimodal lateral frontal areas in normal subjects is delayed by about 10 seconds compared with the response to pure tone discrimination in primary auditory cortex.27 28 Further experiments, including variation of epoch length or event related fMRI studies are needed to clarify the precise phase and time course of activations and their relation to the stimulus.
One potential artifactual source of increased fMRI signal during the resting phase is from involuntary eye movement, which could not be monitored with the apparatus used in this study. However, the extraoccipital responses that we have demonstrated in patients do not include the frontal eye fields or other classic oculomotor control areas, and would not be expected to be activated by eye movements. Furthermore, we think that eye movements are unlikely to have contributed to the difference in activation patterns between patients and normal subjects as patients fixated normally during visual field perimetry, and had no clinical evidence of any eye movement disorder.
There have to date been few other studies of demyelinating optic neuritis using fMRI, and no studies have investigated a directly comparable group of patients after isolated unilateral optic neuritis. Rombouts et al 29 studied nine patients with a variable degree of visual recovery from optic neuritis, eight of whom had clinically definite multiple sclerosis, and did not report extraoccipital activation. This could be due to several methodological differences compared with the present study. Firstly, the patients in our study were more homogeneous in their clinical history and MRI appearances, with a uniformly good degree of visual recovery. It is possible that this selected group have different visual activation patterns compared with a heterogeneous group of patients, some of whom had a poor recovery or disseminated disease. Secondly, the stimulus used in the present study was of 20 second duration compared with 40 seconds; it is known that epoch length affects the modulation of the fMRI signal,30 and this could have different effects in different parts of the brain. Thirdly, the analysis method we have used takes account of locally variable haemodynamic delay and response shape and allows an accurate estimation of the phase of periodic response in different brain regions; the time shifted boxcar approach used by Rombouts et al 29 may not be sensitive to extraoccipital activation if it is phase shifted with respect to the visual stimulus.
Rombouts et al 29 reported a reduced volume of visual cortex activation in patients on stimulating both the affected or the unaffected eye in comparison with control subjects. The results of ANOVA comparisons between the generic maps of patients and controls (tables 3 and 4) show a relatively greater response in visual cortical areas in controls compared with patients for both affected and unaffected eyes, in agreement with these findings.
Two other studies of patients with optic neuritis using fMRI31 32 studied clinically heterogeneous populations of patients using data acquisition and analysis methods that were not optimised to detect extraoccipital activation. One study included four patients with multiple sclerosis, three of whom had experienced an episode of unilateral optic neuritis31 using a surface MR receiver coil which cannot detect activation in anterior brain regions. Another study investigated eight patients (five with definite or probable MS) with varying degrees of clinical recovery after optic neuritis.32 In this study images were acquired in the coronal plane with limited brain coverage in the anteroposterior direction; these data do not include anterior brain regions in which we have noted activation in recovered patients.
In summary the present study has disclosed a previously unsuspected degree of functional reorganisation of the brain after acute unilateral optic neuritis implicating a distributed cortical and subcortical network of multimodal areas that are not normally involved in a simple visual stimulation experiment. These areas have extensive visual connections. Whether and how these changes might contribute to the recovery process and its maintenance remains to be determined. Components of this network have been identified in other functional imaging studies as potential areas of cross modal integration between different sensory inputs—for example, when seen speech influences the perception of heard speech.33 Our results may thus reflect a greater than normal contribution of such higher processing areas (so called top down processing) in patients compared with controls. One possibility is that multimodal regions contribute to suppression of the abnormal input from the affected eye; there is experimental evidence that when the two eyes receive dissimilar visual inputs there is a long latency suppression of response from one eye that may be mediated by cortico-thalamic pathways.34 Alternatively, a recent study has reported activation in a network including posterior parietal, occipitotemporal cortex, and anterior insula during a spatial attention task,35 and it is possible that activation of these areas in our data reflects increased attention and thus perhaps perceptual enhancement of a pathologically degraded stimulus. The data we have presented cannot rule out a possible contribution from increasing fatigue (or reduced arousal) in patients at the end of the baseline period to the extraoccipital activation, however. At this stage it is clear that temporary visual loss in optic neuritis has previously unexpected long term consequences for the pattern of activation of the brain by simple visual stimuli. An important next step will be to determine the time course of the changes, and their relation to clinical and electrophysiological measures in serial studies from symptom onset.
Acknowledgments
The NMR research unit is funded by a generous grant from the Multiple Sclerosis Society of Great Britain and Northern Ireland. DJW is supported by the Brain Research Trust. ETB is funded by the Wellcome Trust. We thank Dr PM Matthews, Dr SJ Jones, Dr AP Leff, and Dr GJM Parker for helpful discussions.