Article Text

Abstract
OBJECTIVES To investigate the relations between quantitative diffusion coefficient MRI histograms, clinical variables, and cerebral atrophy.
METHODS Twenty two patients with clinically definite multiple sclerosis and 11 healthy volunteers were studied. Histograms of apparent diffusion coefficient (ADC) from a volume of interest that included multiple slices encompassing the lateral ventricles were processed from diffusion weighted MRI. In addition, total lesion load was measured on T2 weighted dual echo images, and cerebral volume from 3D magnetisation prepared rapid acquisition gradient echo scans. All patients underwent neurological assessment, including disability on the expanded disability status scale (EDSS).
RESULTS Histograms from the patient group showed a reduced peak height and a “right shift” compared with healthy controls. Peak height of the diffusion histogram correlated with both EDSS (r=−0.54, p=0.0101) and disease duration (r=−0.52, p=0.0140), but not with age. Brain volume correlated with peak height of the ADC histogram (r=0.55, p=0.0129), but not with disability. Total lesion load also correlated moderately with EDSS (r=0.46, p=0.03).
CONCLUSIONS This study shows for the first time that quantitative MRI measures of diffusion correlate with clinical variables (disability, disease duration) and cerebral atrophy in multiple sclerosis. Cerebral atrophy and fixed neurological deficit may be attributed to axonal loss, which would be expected to have a significant effect on ADC. Extension of this method to more patients and longitudinal studies will further elucidate its sensitivity, reproducibility, and potential role in clinical practice and treatment trials.
- multiple sclerosis
- magnetic resonance imaging
- diffusion
Statistics from Altmetric.com
Magnetic resonance imaging has become the investigation of choice in clinically suspected multiple sclerosis, primarily due to its high sensitivity in showing lesions on T2 weighted images.1 It is also widely used in treatment trials for multiple sclerosis, as a primary end point in phase II studies and a secondary end point in phase III studies. The MRI outcome measures most often employed in trials are the number and/or volume of new lesions on either T1 or T2 weighted images. Unfortunately these MRI parameters correlate poorly with clinical end points—for example, disability as measured by the expanded disability status scale (EDSS).1 2 This can be partly explained by problems inherent to the clinical end points, but is predominantly due to lack of specificity of the standard MRI sequences for axonal loss, the likely pathological substrate for most irreversible neurological deficits. Thus, matched MRI and pathological specimens show a markedly variable axonal density in lesions within histological samples that correspond with T2 lesions on MRI.3 Attempts to increase specificity have included imaging of the spinal cord (where lesions commonly cause disability),4 5 or utilising sequences which may be more representative of the pathological substrates of disability. These include magnetic resonance spectroscopy (MRS),6-8 magnetisation transfer (MT),9 T1 relaxation times,10 diffusion weighted imaging (DWI),11-15 and measures of cerebral atrophy.16-19 Diffusion weighted imaging using magnetic resonance utilises the random movement of water molecules in tissue to generate image contrast, allowing qualitative assessment of various disorders including stroke and cerebral tumours.20Diffusion imaging can also provide a quantitative measure of water diffusion in tissue— the apparent diffusion coefficient (ADC). If the ADC of an area is measured along three (or more) appropriate vectors, an average ADC (ADCav) can be calculated, providing a quantitative measure of the overall “diffusivity” of the area. Diffusion in the white matter tracts of the brain is primarily restricted by intact myelinated axons. Damage to these structures is presumed to allow less restricted diffusion and raised ADC values.
Previous studies of DWI in multiple sclerosis have demonstrated raised ADC in both lesions and areas of normal appearing white matter identified from T2 weighted images, but no correlations with disability were reported.11 13 15
Interest in brain and spinal cord atrophy has paralleled the increasing recognition that axonal loss, which is a frequent feature of lesions in multiple sclerosis, may be responsible for a large proportion of fixed disability. Axonal loss is thought to be the most likely cause of atrophy, a hypothesis supported by the study of Evangelouet al in which the cross sectional area of the corpus callosum was correlated with the degree of reduction in axonal density seen on histological samples.21 Atrophy may represent a surrogate marker of axonal loss and therefore fixed neurological deficit. Studies of spinal cord atrophy have shown good cross sectional correlations with EDSS4 and serial studies of cerebral atrophy have suggested that patients with decreasing brain volumes are more likely to show clinical deterioration.18
We hypothesised that in a diffuse disease process such as multiple sclerosis, methods which quantify total tissue integrity may prove more useful than measurement of discrete lesions or regions of interest (ROI) in normal appearing white matter. The objectives of this study were to produce “whole brain” quantitative diffusion histograms and investigate their relation with clinical data, conventional MRI parameters, and MRI estimates of cerebral atrophy.
Subjects and methods
Twenty two patients with clinically definite multiple sclerosis according to the criteria of Poser22 (15 relapsing-remitting and seven secondary progressive) were studied. They were identified from a database of over 1000 patients, and were undergoing review for possible inclusion in treatment trials. All patients underwent neurological assessment and were rated on the EDSS.23 We also studied 11 healthy volunteers as controls. Local ethics committee approval and informed consent were obtained.
MRI PROTOCOLS
All patients were imaged in a whole body MRI scanner at 1.5 Tesla (Magnetom Vision, Siemens Medical Systems, Erlangen, Germany). Sequences obtained included dual echo T2 weighted images (TE=80 ms, TR=2323 ms, slice thickness 3 mm), and 3D magnetisation prepared rapid acquisition gradient echo (MPRAGE) images (TE=4 ms, TR=9.7 ms, TI=300 ms, thickness 1.25 mm). ADCav maps were produced using a fat saturated, spin echo, echo planar DWI sequence (TE=98 ms, TR=0.72 ms, matrix 128×128, voxels 2×2×4 mm, bmax 606s /mm2). The diffusion sequence has been described in more detail elsewhere.24
IMAGE ANALYSIS
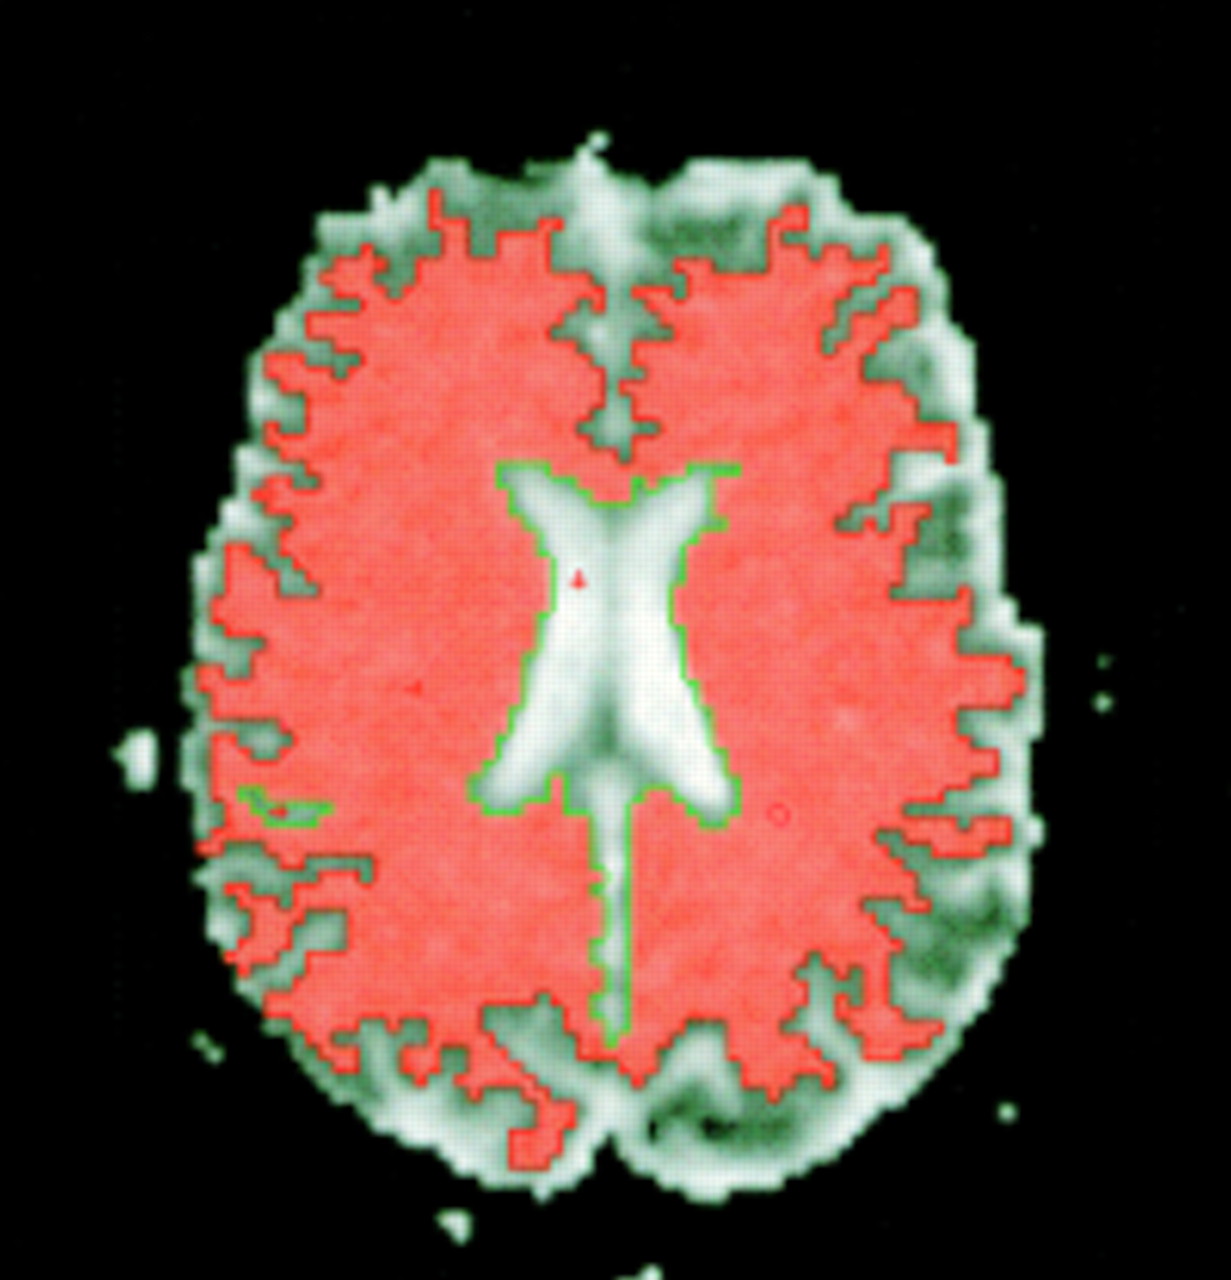
All image analyses were performed on PC workstations running commercial image analysis software (Analyze©, Mayo foundation, MN, USA). A semiautomated thresholding technique allowed the ventricles and sulcal CSF to be segmented from the ADCav maps slice by slice to leave only the brain parenchyma (fig 1). Axial slices encompassing a volume that included the lateral ventricles were used for analysis to avoid images around the skull base and vertex that were degraded by artefact. To standardise this step, analysis was started 5 slices above the upper limit of the lateral ventricles and continued down to the first slice in which the cerebral peduncles could be identified. The mean number of slices included in this volume was 15.5 (SD 2.1). For each patient, the slices obtained were combined to form one volume of interest (VOI). A histogram of ADCav generated from this VOI provided various parameters including peak ADC, ADC quartiles, SD of the histogram, and peak height of the curve on the y axis (voxel count normalised to the total volume of the VOI). Bin width of the histograms was set to 0.1% (equivalent to 0.00165 mm2/s). Histograms were normalised by dividing the number of voxels in each bin by the total number of voxels measured in the VOI and multiplying by a constant (200) to obtain an integer value. All results including the illustrated fitted curves were derived from these data. The segmentation coefficient of error (for peak height of the histograms) was 2.4%.

Single ADC map slice after segmentation of CSF. Coloured area represents voxels included in the VOI for analysis.
Lesions on T2 weighted images were measured using a semiautomated thresholding technique. Supratentorial brain volume was measured from the MPRAGE images using the Cavalieri method of modern design stereology,25-27 and corrected for total intracranial volume (TICV).28 All analysis was performed blind to the clinical details.
STATISTICS
Clinical variables and MRI parameters were correlated using Spearman's rank method, assuming confidence intervals of 95% and using two sided p values. Histogram parameters from the patient and control groups were compared using Mann-Whitney or Student'st tests (Arcus Quickstat Biomedical© version1.0).
Results
SUBJECT CHARACTERISTICS
We studied six male and 16 female patients. The mean age was 40 (range 24–55), mean disease duration 11.1 years (range 1.5–28), and mean EDSS 3.2 (range 0–5.5). The healthy volunteers consisted of four men and seven women with a mean age of 37.3 (range 25–49).
CEREBRAL VOLUME
Mean normalised supratentorial brain volume in the patients was 989.7 ml (SD 77.5). Brain volume did not correlate with age, disease duration, or EDSS.
T2 LESION VOLUME
The volume of T2 lesions (range 483 -17 294 mm3) correlated moderately with EDSS (r=0.46, p=0.0311), but not with age or disease duration.
ADC HISTOGRAMS: COMPARISON OF PATIENTS AND CONTROLS
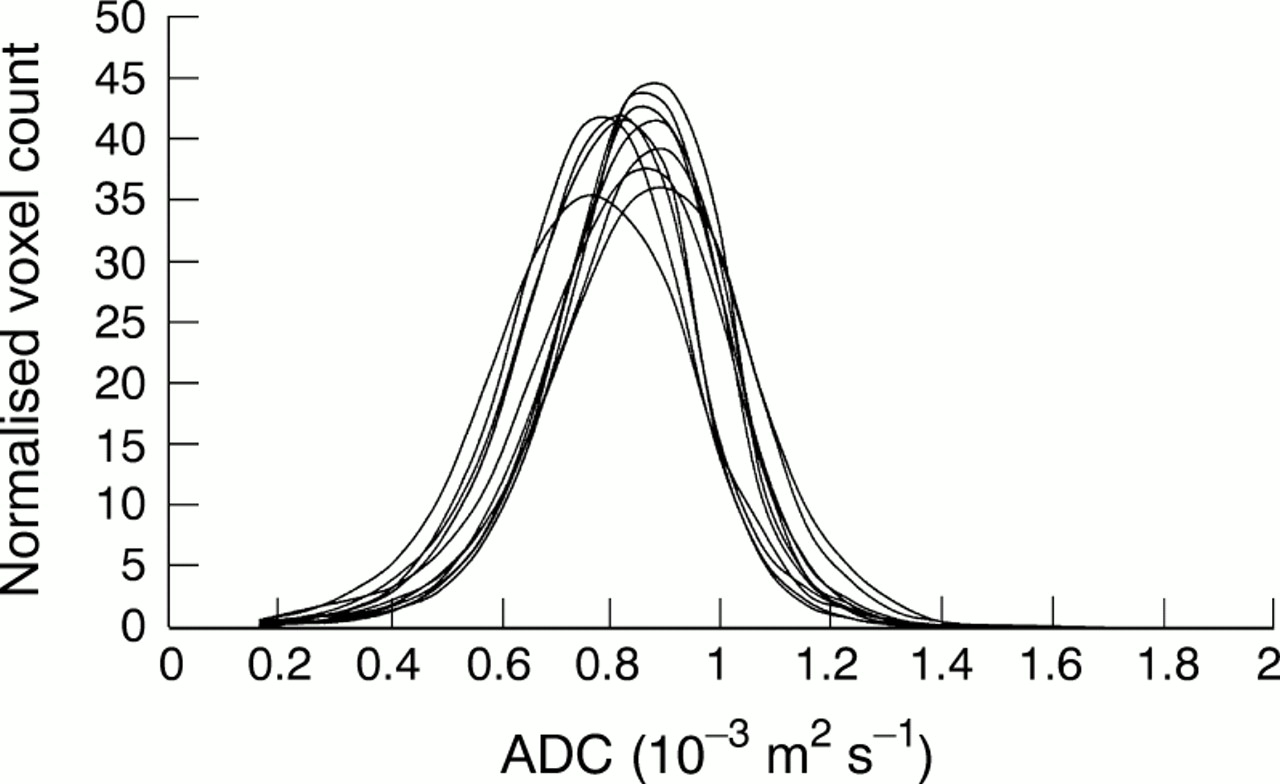
Histograms of the control subjects showed less variability than the patient histograms, particularly in the peak height(figs 2 and 3). The SD of the peak height was 7.1 in the patient group, compared with only 2.9 in the healthy controls. Comparison of the mean histograms for all patients and all controls showed a right shift in the patients, towards higher values of ADC (fig 4). When only the patients with EDSS>3.5 (n=11) were included (fig 5) a more marked shift was seen, with peak ADC being significantly higher in the patient group (p=0.04).

ADC histograms from all 11 healthy volunteers.

ADC histograms from 22 patients with multiple sclerosis. Note the greater variability compared with the control histograms.

Comparison of mean histograms from the patients (dotted line) and controls (solid line). The patients' curve is shifted toward higher ADC (less restricted diffusion).

Comparison of the mean control histogram with disabled patients (EDSS>3.5, n=11). A more pronounced shift is present, with a consequent drop in peak height.
ADC HISTOGRAMS: PATIENT VARIABILITY
Individual normalised histograms for each patient showed a marked variation in peak height and “spread” (represented by the SD of the histogram) within the cohort (fig3).
Peak height of the ADC histogram (mean 49, range 38–62, units normalised voxel count) correlated negatively with both EDSS (r=−0.54, p=0.0101) and disease duration (r=−0.52, p=0.0140), but not with age (r=−0.38, p=0.08). Peak height also correlated with normalised cerebral volume (r=0.55, p=0.0129) and with T2 lesion volume (r=−0.7, p=0.0004). The SD of the histograms correlated with disability (r= 0.55, p=0.0091) and was strongly inversely correlated with the peak height of the histogram, showing that as the peak falls there is a greater spread of ADC values in the histogram. Peak height was inversely related to the 75th quartile ADC value (r=−0.52, p=0.0143), but no relation with the 25th quartile ADC value was found. This suggests that the spread of ADC values was predominantly to the right (higher ADC).
Discussion
This study shows for the first time that peak height of ADC histograms in multiple sclerosis correlates with disease duration, disability, and cerebral atrophy. In addition we have shown significant differences between patients and healthy volunteers.
Weaknesses of this study include its cross sectional design, relatively few patients, and a patient group not randomly drawn from the multiple sclerosis population. Despite these reservations, the study population included both relapsing-remitting and secondary progressive patients with a range of disability, disease duration, and age. Although all analysis was performed blind to clinical details, the segmentation of CSF from the ADC maps involved some manual input which could potentially introduce bias, as approximations of gross lesion load and atrophy could be made visually. The segmentation procedure was also inevitably affected by partial voluming of CSF around the sulci and periventricular areas, which would have resulted in falsely high values of ADC. However, these partial volume effects should have been less marked for patients with greater cerebral atrophy (and by implication, disability), suggesting that the “right shift” we found in disabled patients would be a conservative estimate. Although the patients were slightly older than the controls (mean age 40v 37), age itself was not correlated significantly with any of the histogram parameters measured. We cannot, however, exclude the possibility that some of the variation in the histograms was due in part to age differences.
In this study we have chosen to ignore discrete lesions and areas of apparently normal appearing white matter, instead producing histograms which describe the distribution of ADC values throughout a large volume of brain. Most previous studies of quantitative diffusion have concentrated on the ADC values of different lesions (enhancing, non-enhancing, acute, chronic) and small regions of normal appearing white matter, which have provided valuable insights into the heterogenous nature of “T2 lesions”. These studies have not, however, shown correlations with clinical variables, perhaps because they have excluded large areas of normal appearing white matter and abnormal areas that were insufficiently discrete for ROI analysis but may well contribute to overall disability. A recently published study which used a “whole brain” approach (using an ROI which included both brain parenchyma and CSF) found that secondary progressive patients had a lower peak height and a right shift in ADC relative to relapsing-remitting patients, but the disability of these patients was not assessed.29 The other published study that examined histograms of ADC (after segmentation of extracerebral CSF) also failed to show a correlation with disability, perhaps due to the small range of EDSS in their cohort.30
The mean histogram of the more disabled patients in our study showed a lower peak height and a right shift toward higher ADC compared with the histogram from the control subjects. Interestingly, some of the less disabled patients had histograms with higher peaks than the healthy controls. This finding is in agreement with the results published by Nusbaum et al,29 and suggests that in this group of patients a proportion of healthy brain tissue with low ADC has shifted toward mid-range values of ADC, resulting in a narrower histogram with a higher peak. By contrast, the more disabled patients with longer disease duration show a more right skewed distribution with a consequently lower peak height.
We found the peak height of the ADC histogram to be the parameter with the greatest variation between patients. Histograms in more disabled patients had a lower peak height and greater spread (SD), predominantly skewed toward higher ADC values (as shown by the right shift of the 75th quartile). Studies of whole brain MTI histograms have also demonstrated similar changes, but with a left shift towards lower MT ratio values.31
In the present study, peak height also correlated with supratentorial brain volume acquired from 3D-MPRAGE images that allow direct estimates of cerebral volume. Cerebral atrophy is thought to reflect axonal loss, which would be expected to increase ADC values significantly. However, brain volume did not correlate with EDSS, suggesting that peak height of the ADC histogram may be a more specific marker of axonal loss and fixed disability than measures of cerebral atrophy.
We also found a significant correlation between T2 lesion volume and disability, which was only moderately weaker than that shown by the ADC histograms. To confirm any advantage provided by ADC histograms over T2 lesion volume, further studies are required in larger cohorts.
In clinical practice, MRI in multiple sclerosis has established itself as an essential aid to diagnosis, but its role in assessing disease progression and prognosis has been hampered by the ambiguous relation between current MRI parameters and the clinical behaviour of the disease. Because of this, treatment trials rely heavily on clinical outcome measures, which require many patients and long duration trials to demonstrate efficacy. Clearly a need exists to develop MRI techniques which reflect, or preferably predict, the clinical course of the disease more accurately. We suggest that whole brain quantitative measurements, despite their lack of spatial discrimination, provide a potentially useful measure of the “burden of disease” that examination of discrete lesions alone cannot provide. The diffusion methods outlined in this study will require further research and development including longitudinal studies and direct comparison with other quantitative MRI modalities (for example, MTI, MRS, or T1 mapping) to elucidate their potential role in clinical practice and treatment trials.
Acknowledgments
We thank Dr IT Redmond and Dr C Liu for their help in acquiring the MR scans, and Dr David Porter and Fernando Calamante for writing the ADC sequence.