Article Text

Abstract
OBJECTIVES To verify the applicability and validity of time-frequency analysis (TFA) of evoked potential (EP) signals in detecting the integrity of spinal cord function and preventing spinal cord injury.
METHODS The spinal cord was simulated during surgery in 20 mature rats by mechanically damaging the spinal cord. Cortical somatosensory evoked potential (CSEP), spinal somatosensory evoked potential (SSEP), cortical motor evoked potential (CMEP), and spinal cord evoked potential (SCEP) were used to monitor spinal cord function. Short time Fourier transform (STFT) was applied to the CSEP signal, and cone shaped distribution (CSD) was used as the TFA algorithm for SSEP, CMEP, and SCEP signals. The changes in the latency and amplitude of EP signals were measured in the time domain, and peak time, peak frequency, and peak power were measured in the time-frequency distribution (TFD).
RESULTS The TFDs of EPs were found to concentrate in a certain location under normal conditions. When injury occurred, the energy decreased in peak power, and there was a greater dispersion of energy across the time-frequency range. Strong relations were found between latency and peak time, and amplitude and peak power. However, the change in peak power after injury was significantly larger than the corresponding change in amplitude (p<0.001 by ANOVA).
CONCLUSIONS It was found that TFA of EPs provided an earlier and more sensitive indication of injury than time domain monitoring alone. It is suggested that TFA of EP signals should therefore be useful in preventing spinal cord injury during surgery.
- time frequency analysis
- evoked potential
- spinal cord injury
Statistics from Altmetric.com
Spinal surgery is a common form of treatment for various spinal deficits, but also entails the risk of spinal cord damage, which may lead to sensory or motor problems, and even paralysis. To reduce this risk, various evoked potential techniques have been used to monitor the integrity of spinal cord function during surgery. However, false outcomes from monitoring are still a concern to the monitoring and surgical teams.1
Current intraoperative monitoring techniques measure only the latency and amplitude of the evoked potential (EP)1 2 despite the fact that EP signals are usually polyphasic waveforms that reflect different activation and conduction velocities within the spinal cord.3 Present measurements cannot therefore represent the precise characteristics of EP signals. The power spectrum of EP signals can indicate the proportion of different frequency components in the signal, and may be more representative of the physical nature of the signal than the features seen in the time spectrum alone. As such, combining time and frequency analysis into time-frequency analysis (TFA) could be a useful tool in spinal cord monitoring.4The main advantage of this is the integrity of information from the whole of the EP waveform, rather than arbitrarily selected features.
Application of TFA to EP signals to monitor the integrity of spinal cord function during spinal surgery has not yet been reported. In the present study, the changes of various EP waveforms in time-frequency space were studied after mechanical insult to the spinal cord. The purpose of this was to assess the applicability of TFA methods to EP signals, and provide a basis for the clinical use of TFA in spinal EP monitoring.
Materials and methods
EXPERIMENTAL PROCEDURE
Twenty mature rats weighing between 260 and 280 g were used. All the surgical procedures were performed under intravenous pentobarbital (0.05 mg/g) anaesthesia augmented by local 1% xylocaine infiltration. Additional pentobarbital was given at intervals and in amounts established in non-curarised rats to assure adequate anaesthesia.
Many investigators use physically transected spinal cords for studying spinal cord regeneration, but this is rarely encountered in injury to the human spinal cord.5 6 In most human spinal cord injuries, the mechanism of the primary injury is compression of the spinal cord.7 8 Different experimental models have been developed to simulate the compression type of cord trauma.9 The weight dropping model or blocking weight model are commonly used experimental compression models for spinal cord injury,10-12 but are not reproducible because the weight can be resisted by remaining soft tissues. Rivlin and Tator13 described an acute cord injury model in rats using a modified aneurysm clip, and mechanical spinal cord injury models have also been made by injecting or inserting objects such as paraffin or inflatable balloons into the epidural space.10 14However, both of these methods necessitate a complete laminectomy including removal of the pedicles to permit extradural passage of the compression performance.10 Another cord injury model of spinal cord compression was produced by inserting a screw into the spinal cord anteriorly through the vertebral body.15 16In the present study, we modified this compression model by inserting a screw posteriorly. Technically, the posterior screw model is easier to produce than the anterior model, as it requires minimal soft tissue dissection and bone removal. The procedure can be performed rapidly with little experience and no special apparatus is needed. Also, instrumented spinal surgery typically uses a posterior or posterolateral approach, and foreign body intrusion is normally from the posterior. This may be better modelled by the compression model outlined here rather than anterior screw insertion.
The stimulation and recording methods used for various EP tests were similar to those used in routine clinical monitoring of the spinal cord. The spine was exposed posteriorly from the fourth cervical vertebra to the fourth lumbar vertebra, as shown in figure 1. The CSEP was evoked by hind paw stimulation and recorded from the skull, whereas SSEP was recorded from the T1–2 interspinous ligaments. The stimulation electrode for MEP was positioned on the skull over the sensorimotor cortex. A pair of needle electrodes were inserted into the interspinous ligaments at T10 to L1 for MEP and SCEP recording. The recording needles for SSEP were also used as the stimulation electrodes for SCEP.
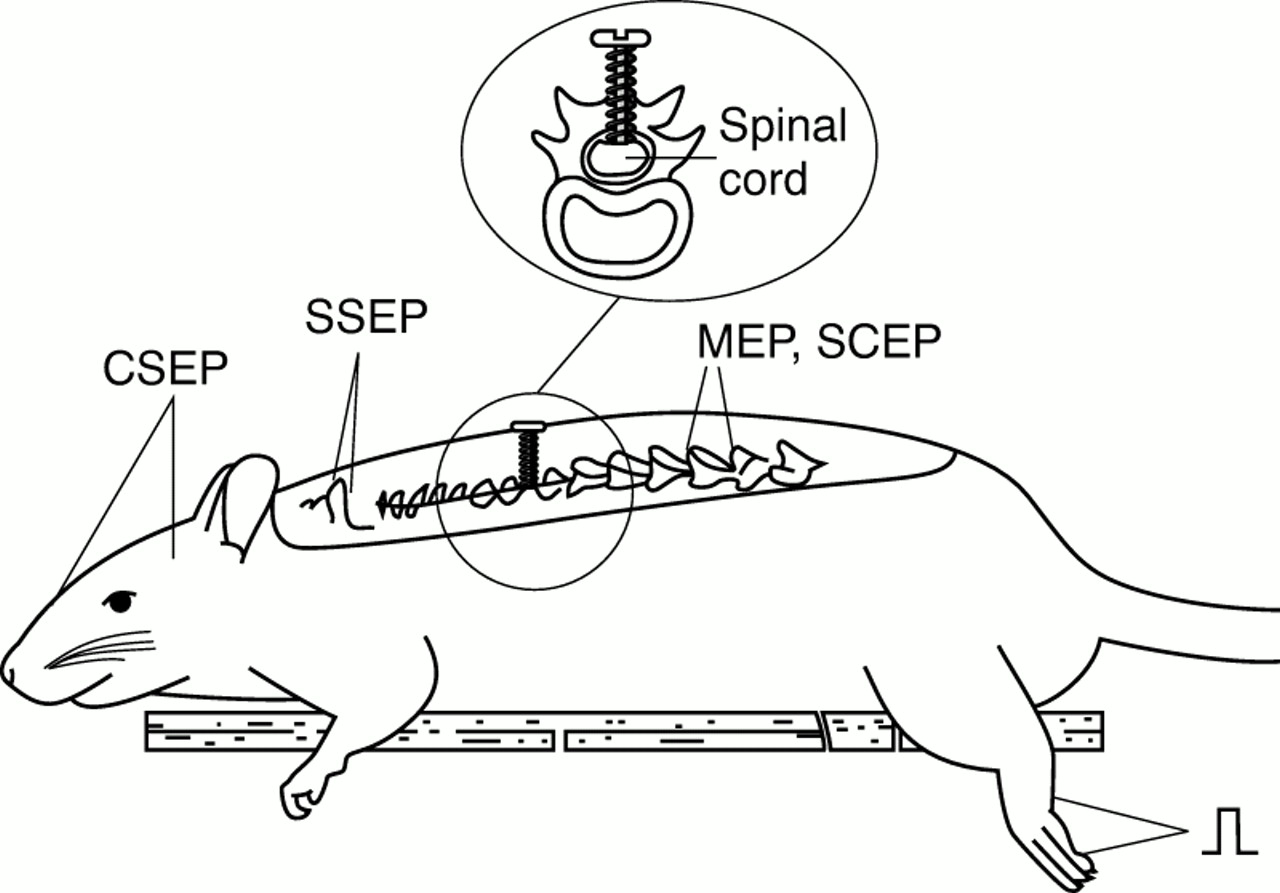
Illustration of the animal experiment arrangement.
The mechanical injury to the spinal cord was simulated by introducing the screw to compress the spinal cord. Before the injury to the cord occurred, normal EP waveforms were recorded for each of the different modalities. After the spine was exposed, a narrow cylindrical hole was drilled longitudinally through the posterior spinal process of one of the vertebrae between T4 and T7 from its caudal point down to the root of the spinous process. A 0.6 mm thread screw was then positioned in the hole (fig 1), and the screw carefully and slowly advanced into the spinal canal. Evoked potential signals were recorded 10 minutes after each turn of the screw, and the number of turns noted, until the screw totally penetrated the spinal cord and reached the posterior wall of the vertebral body. The measurement of all the EPs required about 5 minutes, and five to seven turns were generally needed for the screw to reach the posterior wall of the vertebral body, giving a total experimental time of 30 to 40 minutes from the baseline recording to the last EP recording.
Animals were then killed with an overdose of pentobarbital, and the vertebral segment with the screw was sectioned. The screw was slowly loosened and the compression ratio was measured by visual assessment. As shown in figure 2, the compression ratio is defined as:


Illustration (lateral section) of the thoracic spine with compression screw inserted. Compression ratio (the depth of the screw B/original anterior-posterior diameter of the spinal canal A) is calculated as B/A.
The turn numbers noted were used as an index to define the compression ratio at each EP recording. The data recorded at compression ratios closest to 30%, 50%, and 100% were then selected for analysis. As compression ratios of exactly 30% or 50% were rarely found, a tolerance error of less than 10% was accepted. In the present study, 30% and 50% compressions were used to simulate extradural compression of the spinal cord due to displacement of bone or instrumentation into the spinal canal, and 100% compression to simulate total disruption of the spinal cord, even though this is rarely encountered during spinal surgery.
SIGNAL ACQUISITION AND PROCESSING
To elicit CSEP and SSEP, a constant current stimulator was used to apply a 5.1 Hz square wave 0.2 ms in duration to the hind paw. The current was set at that causing mild twitch of limbs (3–10 mA). To elicit MEP, a pulse stimulation 0.2 ms in duration at a frequency of 5.1 Hz and with a current density of 5–10 mA was employed. To elicit SCEP, the pulse stimulation was again at 5.1 Hz frequency and 0.2 ms duration, but a current density of 1 mA was used in these cases.
The signal was amplified 100 000 times with two amplifiers (SCXI-1120, National Instruments Co, TX, USA). Band pass filtering between 20 Hz and 3000 Hz was used. All the EP signals were acquired with a data acquisition card (DAQcard-1200, National Instruments Co, TX, USA) at 12 bit resolution and a sampling rate of 20 kHz. All the data were recorded and analyzed on a personal computer (IBM 380XD) using Labview 5.0 software (National Instruments Co, TX, USA). To obtain a good SNR for the EP signals, a total of 100 EP responses were averaged for each trial.
A short time Fourier transform (STFT) with a Hanning window function 20 points long was applied to the CSEP signal. For a recorded CSEP signal s(t), the STFT spectrogram is defined by the following equation:

where Δt denotes the time sampling interval, N is the block length of the window function, and w(i) is the Hanning window function.
The cone shaped distribution (CSD) was used as the TFA algorithm for SSEP, CMEP, and SCEP signals. The CSD was developed to reduce the interference distribution, and in discrete formulation is represented by:

where α is a parameter that controls the decay speed of kernel function, R(n,i) is the time-dependent autocorrelated function given by
R(n,i)=Z(n+i)Z(n−i)
where Z(n) denotes the analytical sequence corresponding to s(n) as below:
Z(n)=s(n)+jH{s(n)}
where H{} denotes the Hilbert transform.
DATA ANALYSIS AND COMPARISON
The latency and the peak to peak amplitude were measured at the initial peak of averaged EP waveform. The changes in EP signals were measured in the time domain by the percentage changes in latency and amplitude. A 10% increase of latency or 50% decrease of amplitude were defined as criteria of spinal cord deficit. In addition to the time domain parameters, characteristics of the peak power in the time-frequency distribution (TFD) of EP signals were computed to quantify changes that may occur due to injury. The following parameters were computed: peak time, peak frequency, and peak power. Similar to the amplitude and latency in the time domain, the percentage changes of time-frequency parameters were also calculated. Data are presented as mean (SD). One way parametric analysis of variance (ANOVA) was used for comparison of statistical differences. To evaluate the relation between traditional (time domain) parameters for intraoperative monitoring and the new measurements presented in this paper, the correlation coefficients between the time domain and TFA parameters were also calculated.
Results
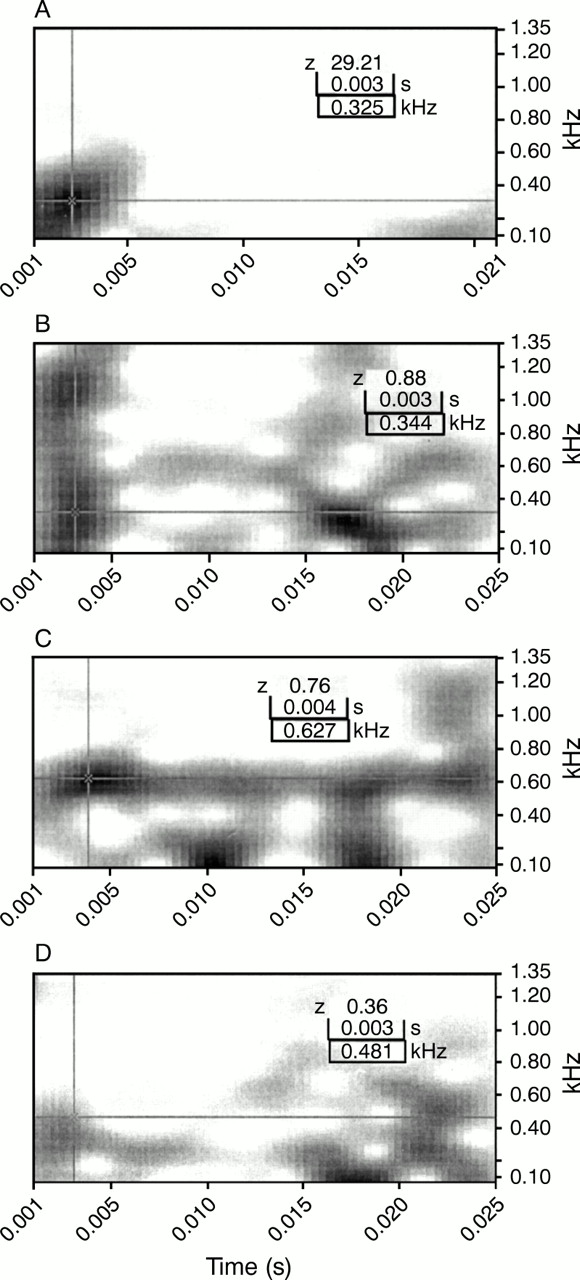
The EP signals were recorded at different compression ratios. Figure 3 shows various EP waveforms acquired from one of the animals at baseline (before screw in), and at 30%, 50%, and 100% compression of the spinal cord. The CSEP responses were analyzed using the Hanning windowed STFT. The TFA of these CSEP waveforms (fig 4) are displayed in intensity plots, with time as the x axis (referenced from the instant of stimulation), frequency as the y axis, and the signal power shown in grey intensity. Figure 4 demonstrates a single energy peak, corresponding to the primary CSEP waveform peak, which becomes altered during injury. Results show that under normal conditions a sharply focused peak of energy occurred 13 to 27 ms after stimulation (mean peak time 20 ms), and was centred at a frequency of about 50 to 100 Hz. After injury, the peak of energy occurs at a later time and is centred on a more widely variable frequency. The peak also decreases in power, and there is a greater dispersion of energy across the time-frequency range (fig 4 D)). Because the TFA distribution is displayed by autoscale intensity, a lot of noise peaks appear when the main peaks of CSEP signals were diminished due to injury (fig 4 C and D). SSEP, MEP, and SCEP responses under baseline conditions and with spinal cord injury were subject to TFA using the CSD algorithm. The TFA distributions of a SSEP waveform (as shown in fig 3 (B)) are displayed in figure 5. Under normal conditions, a peak of energy occurs about 4 ms after stimulation, and is distributed from 300 to 700 Hz in two or three peaks. The plots demonstrate a series of signal energy peaks in the distribution, which indicate a greater dispersion of energy across the frequency range. The TFA distribution of SSEP signals is altered with spinal cord injury (fig 5 B, C, and D). Decrease of the SSEP response can be seen, with some spectrum fade from the normal frequency band of 300 to 700 Hz and the noise peaks appearing thicker outside the SSEP time-frequency space.

Sample of various EP waveforms under different spinal cord injury stages. (A) CSEP; (B) SSEP; (C) MEP; (D) SCEP. Trace 1 is before injury; trace 2 is compression ratio=30%; trace 3 is compression ratio=50%; trace 4 is compression ratio=100%.

Time-frequency distribution of a sample of CSEP waveforms in spinal cord injury. (A) Before injury; (B) compression ratio=30%; (C) compression ratio= 50%; (D) compression ratio= 100%.

Time-frequency distribution of a sample SSEP of spinal cord injury model. (A) Before injury; (B) compression ratio=30%; (C) compression ratio= 50%; (D) compression ratio= 100%.
Figures 6 and 7 show the TFA distributions of MEP and SCEP waveforms respectively. Under normal conditions a single peak of energy at about 4 ms after stimulation is seen in the TFD of MEP, and a peak of energy occurs at about 3 ms in the TFD of SCEP. In all animals, the peak frequency of both MEP and SCEP was centered from 400 to 600 Hz. The TFA distribution of both MEP and SCEP are again seen to be distorted with spinal cord injury (figs 6 and7).

Time-frequency distribution of a sample MEP of spinal cord injury model. (A) Before injury; (B) compression ratio=30%; (C) compression ratio= 50%; (D) compression ratio= 100%.
Time-frequency distribution of a sample SCEP of spinal cord injury model. (A) Before injury; (B) compression ratio=30%; (C) compression ratio= 50%; (D) compression ratio= 100%.
In time domain waveforms, the parameters measured at different stages of spinal cord compression were the latency and amplitude, and the TFD was characterised by calculating the parameters of peak time, peak frequency, and peak power.
Table 1 shows the values of these five parameters for the various EP techniques from all 20 animals. The amplitudes at 100% damage were often so low that they were difficult to distinguish from the background noise. For the statistical analysis, the peak values in these cases were measured at the position of the latency peak found for 50% damage. The background noise is typically of the order of microvolts, and therefore although a 1 μV value is stated for the signal at 100% damage, this is more likely to be noise. Table 2 shows the percentage variability of these parameters at different stages of spinal cord injury. Theoretically, peak time in the time-frequency domain reflects the latency in the time domain, and peak power similarly reflects the time domain amplitude. Experimentally, strong relations were found between latency and peak time (r=0.90, 0.87, 0.87, and 0.80 for CSEP, SSEP, MEP, and SCEP respectively), amplitude and peak power (r=0.83, 0.74, 0.70, and 0.76 for CSEP, SSEP, MEP, and SCEP respectively). When the screw was inserted into the spinal canal to 30% compression, the CSEP amplitude decreased from 3.85 (1.79) μV to 1.70 (0.62) μV (a mean decrease of 50.3% from baseline), while peak power decreased from 17.6 (6.1) to 2.5 (1.6) (a mean decrease of 78%). These findings showed that the change in peak power in relation to injury was significantly larger than the change in amplitude (p<0.001 by ANOVA). The changes of SSEP, MEP, and SCEP showed the same trend as that described above for CSEP. The mean decrease of peak power after 30% spinal cord compression was more than 75% for all of the EP techniques. As tables 1 and 2 show, the change in peak power related to injury was greater than that of amplitude. The latency of CSEP showed an increase from 13.9 (1.7) ms to 17.4 (4.7) ms (mean increase 29.6%), and peak time showed an increase from 20 (7.6) ms to 21.15 (3.2) ms (mean increase 18.8%). However, the percentage increases in peak times of SSEP, MEP, and SCEP were similar to the increase found in the latency, and only CSEP showed a difference between the changes seen in the time domain and the time-frequency domain.
EP parameters(mean (SD)) in time and frequency domain during the mechanical damaging model
Percentage variability (mean (SD)) of EP variables in time and frequency domain during the mechanical damaging model
Increasing the compression ratio to 50% and 100%, produced a percentage decrease of peak power that was still larger than the decrease of amplitude for all of the EP techniques. Similarly, the percentage increase of latency was slightly larger than that of peak time for all of the EP techniques (table 2). During spinal cord injury, TFA showed changes in the peak frequency, but these did not show any relation with the compression ratio. The peak frequency also showed a tendency to become more disperse with increasing severity of spinal cord injury.
To compare the monitoring sensitivity of the different parameters, the monitoring outcomes were evaluated. Similar to the criterion used in time domain, 10% increase of peak time or 50% decrease of peak power was defined as the warning criteria in TFA of spinal cord monitoring. Peak frequency was not included in this evaluation, as it proved difficult to find reliable values. With a spinal cord compression of 50% or 100%, equivalent warning signals were given by detection of either abnormal time domain parameters or TFA parameters. In this situation, there were no significant differences between time domain measurement and TFA measurement for all the experiments.
However, there was significant difference between time domain detection and TFA detection at 30% compression of the spinal cord. For CSEP monitoring, six of the 20 animals showed an amplitude decrease of less than 50%, and of these, three showed less than a 10% increase in latency. With SSEP, five animals similarly showed no amplitude warning, and two of these five produced no latency warning. In MEP monitoring, no amplitude warning was found in two rats, but all showed an increase in latency of 10%. Monitoring of SCEP resulted in three rats producing no amplitude warning and one of these produced no latency warning. Overall, under time domain measurement with 30% spinal cord compression, false negative outcomes occurred in three cases for CSEP (85% sensitivity), two cases for SSEP (90% sensitivity), and in one case for SCEP (95% sensitivity). Monitoring of CMEP showed 100% sensitivity in these series of experiments. Spinal cord monitoring with TFA of the EP signals showed eight negative warnings for peak time variability in CSEP, one negative for SSEP, four negative for MEP, and three negative for SCEP. However, when examining the peak power changes, no negative warnings were found for any of the EP techniques, so that overall no false negative cases occurred during TFA monitoring (100% sensitivity). No false positive warnings were given in any of the EP modalities for either time domain or TFA monitoring in this series. As such, no valid comparison could be made between the specificities found in time domain and TFA monitoring, as this was 100% in all cases.
Discussion
Various evoked potential techniques have been used for intraoperative spinal cord monitoring, but false monitoring outcomes remain a problem. Previous studies have noted different false negative rates up to 9%2 17-20 and a range of 1.51%−27.1% in false positive rates of intraoperative spinal cord monitoring.17 19-24 Other articles reported severe false positive rates of 48%25 and false negative rates of 14.7%.24 To analyze the inconsistent results by previous studies, false monitoring outcomes have been found to be due to various factors, such as the experience of the monitoring team, variability of EP signals, and the influence of anaesthesia. Imaiet al 26 also noted that false warnings may be caused by contaminated EP signals, and the source of the contamination could be from electrical equipment in the environment or the operation procedure.27
In current EP techniques, time domain parameters (latency and amplitude) are used to determine the injury to spinal cord function. In addition to EP amplitude and latency, the EP waveform will change with spinal cord injury, and consequently result in changes of the power spectra of EP signals. Injury, however, is known to cause localised (at various time instances or delays) changes in the spectrum of the EP waveforms, and a combination of temporal and spectral information by TFA of EP waveforms may provide a better indication of spinal cord injury.
With normal spinal cord function, EP signals present a concentrated power distribution located at a certain space in the TFD. Both shift of this location in the TFD and the diminution of peak power were found to be related to spinal cord injury. Injury to the spinal cord therefore results in changes in TFD of EP, and these changes may help to provide a more efficient indicator of spinal cord injury during surgery.
In fact, both TFA and time domain measurement are different representations of EP waveforms. With the mechanical injury to the spinal cord, EP waveforms were measured in both time domain parameters (latency and amplitude) and time-frequency domain parameters of peak time, peak power, and peak frequency. In the present study, the correlation between the time domain parameters and TFA parameters suggests the reflections of peak time for latency, peak power for amplitude, and peak frequency for the EP waveform pattern.
The peak frequency reflects the changes of waveform shape, which may be another indicator of spinal cord function. In practice, the peak frequency was found to change with spinal cord injury, which suggests the spectral changes of EPs occur during neurological injury of the spinal cord. This finding concurs with the previous investigations of Thakor et al.28 29
The change in peak time usually followed the trend seen in latency. In some cases, however, the TFA peak time of EPs did not increase after injury, as found in previous studies. This lack in sensitivity of peak time during spinal cord injury is possible due to the low time resolution of TFA. The decrease of the peak time sometimes seen may be due to the effect of stimulus artifact noise. This tends to be at shorter time scales than the peak time, and will therefore tend to skew the distribution and cause the peak to be shifted to shorter times, despite the tendency of injury to the spinal cord to increase the peak time. However, the overall advantage of the TFA method is the detection of time and frequency shifting, which is dependent on several factors including amplitude and latency, but contains much more information than in amplitude and latency values alone. Time-frequency analysis may be particularly advantageous under conditions of partial or slow injury, as it shows a significantly higher sensitivity than time domain analysis for 30% compression of the spinal cord. The MEP recording also showed 100% sensitivity to injury that may neutralise the advantage of the application of TFA. However, MEP is just one of the monitoring techniques and although this has been shown to be a good indicator of motor dysfunction, it is a potentially unreliable monitor of sensory dysfunction.30 31 Other EP techniques are still needed for intraoperative spinal cord monitoring. Improvement of sensitivity in intraoperative spinal cord monitoring by TFA provides an alternative to traditional measurements in the time domain alone.
The results of this study indicate that peak power follows the trends seen in amplitude. The ability of the TFA method to provide more sensitive detection of spinal cord injuries than amplitude measurement is shown above. Because signal power should be focused within the TFA under normal conditions, monitoring of power in this space serves to combine detection of time shifting, frequency shifting, power loss, and power dispersion all into one parameter. Although there may be some variation in the time-frequency parameters, the peak power continues to provide an effective indicator of injury.
The TFA parameters of EP have been proved to possess the same validity as time domain parameters in the detection of injury to spinal cord function, and more importantly, TFA has shown an advantage over time domain measurement in detection of low level injury (30% compression ratio). As an example, 30% compression of the spinal cord in one animal showed a peak power indicating injury (23% of baseline), whereas the amplitude did not indicate injury (64% of baseline). Monitoring of peak power in TFA provides a parameter with higher sensitivity to injury than amplitude.
Previous experimental studies have proved that under conditions of neurological injury, EP response diminishes, causing a decrease in amplitude and an increase in latency.32-34 Those findings have been applied in clinic practices and support our findings. It has been shown that power spectral changes occurring in the EP can also be important indicators of injury.29 However, its main disadvantage is the loss of time information, which is another important indicator of the integrity of the EP waveform.
A previous study in cats found the TFA of SEP to be useful in detection of neurological injury of the spinal cord due to hypoxia.4The results presented here agree with these findings, and further demonstrate the usefulness and superior sensitivity of TFA in detection of mechanical injury to the spinal cord.
In the analysis of CSEP signals, STFT proved to be the most appropriate algorithm. STFT is the prototype time-frequency distribution and has been an extremely powerful tool in many areas. One of the advantages of STFT is that it has an easily understandable interpretation in both time and frequency domains, providing a linear interpretation so that the peak power exactly represents the energy distribution. Measurements of SSEP, CMEP, and SCEP have the problem of poor resolution in TFA due to the shorter time courses of their waveforms, and CSD is a better option for analysis of such short duration waveforms. Alternative algorithms for TFA of EP signals are available, and in the choice of optimal algorithm, time and frequency resolutions, appearance of false peaks, accuracy of the TFA peak, and the computation speed should all be taken into consideration.
It should be noted that 50% peak power and 50% amplitude are arbitrary selections for the threshold of injury. It is difficult to establish equivalent values for comparison between time domain analysis and TFA, and further investigation is needed. In addition, the influence of size and shape of the TFA, or size and shape of the window used for the TFA, may warrant further investigation. For instance, a smaller space more focused on the normal peak may have a higher sensitivity to injury than a larger space, as the peak will shift out of the space sooner. However, a smaller space may also be more sensitive to changes that are unrelated to injury. Further clinical and engineering investigations are required before the practical application of TFA to intraoperative evoked potential monitoring. The criterion of TFA parameters for abnormal spinal cord function and the relative specificity in TFA monitoring should be verified using clinical data. The appropriate monitoring window in time-frequency distribution and the optimal TFA algorithm for spinal cord monitoring should also be identified.
The results of this study show that useful information is contained within three TFA parameters: peak time, peak frequency, and peak power. The changes in these parameters confirmed that both temporal and spectral changes occur in the EP signals subsequent to neurological injury. The TFA of EP waveforms in this study demonstrate that the peak of energy in the TFD may be of particular diagnostic value in assessing neurological injury.
Conclusion
Traditional methods for EP monitoring use only amplitude and latency measurements in the time domain to indicate potential injury to the spinal cord. However, spectral changes in EPs also occur during neurological injury. As a result, the injury related changes in EPs occur not only in time domain parameters, but also in frequency characteristics. Both time and frequency characteristics of the EPs are affected during injury. TFA of EPs provides simultaneous representation of both temporal and spectral information, so that both time and frequency changes can be monitored.
Normal EPs are usually located in a certain space in the TFD. Time-frequency analysis can monitor power in the time-frequency space where a concentration of EP energy normally occurs. During injury, the power of EP signals decrease and shift out of this normal time-frequency space, causing a decline in the energy.
With monitoring of the TFA parameters of peak time, peak frequency, and peak power, TFA of EPs provided an earlier and more sensitive indication of injury than time-domain monitoring alone. The results suggest that TFA of EP signals should therefore be useful in clinical practice.
Acknowledgments
This study was supported by The Hong Kong Research Grants Council (227/95M).
