Article Text

Abstract
OBJECTIVES To evaluate, in people with multiple sclerosis, two psychometric assumptions that must be satisfied for valid use of the medical outcomes study 36-item short form health survey (SF-36): the data are of high quality and, it is legitimate to generate scores for eight scales and two summary measures using the standard algorithms.
METHODS SF-36 data from 438 people representing the full range of multiple sclerosis were examined (mean age 48; 70% women). Data quality (per cent missing data and computable scale and summary scores) were determined, six scaling criteria were tested to determine the legitimacy of generating the eight SF-36 scale scores using Likert's method of summed ratings, and two scaling criteria were tested to determine the appropriateness of the standard SF-36 algorithms for weighting scale scores to generate two summary measures.
RESULTS Data quality was excellent except in the most disabled subgroup where missing responses reached a maximum of 16.5% and summary scores could only be computed for 72%. There was clear support for the generation of SF-36 scale scores. Item response distributions were symmetric, item mean scores and variances were equivalent, corrected item-total correlations were high (range 0.46–0.85) and similar, and definite scaling success rates exceeded 96%. Nevertheless, there were notable floor or ceiling effects in four of the eight scales. Assumptions for generating two SF-36 summary measures were only partially satisfied. Although principal components analysis suggested a two component model, these components explained less than 60% of the total variance in SF-36 scales, and less than 75% of the variance in five of the eight scales. Moreover, scale to component correlations did not support the use of scale weights derived from United States population data.
CONCLUSIONS When using the SF-36 as a health measure in multiple sclerosis summary scores should be reported with caution.
- SF-36
- tests of scaling assumptions
- health measurement
- multiple sclerosis
Statistics from Altmetric.com
Changes in health policy have underlined the importance of measuring outcomes that are relevant to patients. This has resulted in the increased use of generic, patient reported health status measures. However, the use of these measures assumes that they satisfy minimum psychometric requirements across diverse clinical populations.1 2 This often untested assumption is the subject of this article.
The medical outcomes study 36 item short form health survey (SF-36) is one of the most widely used patient reported health status measures.3 It is recommended for use in health policy evaluations, general population surveys, clinical research, and clinical practice.4 In neurology, the SF-36 has been used in stroke,5 motor neuron disease,6Parkinson's disease,7 epilepsy,8headache,9 and multiple sclerosis.10-13Moreover, it has often been used as a validating instrument in the psychometric evaluation of new measures.14-19
The SF-36 generates two types of scores (fig 1). To generate scores for the eight SF-36 scales, items are summed without weighting or standardisation. To generate scores for the two SF-36 summary measures, scale scores are weighted and combined. Although the eight scales provide a more comprehensive profile of health status, the two summary measures have features that make them more advantageous for clinical trials. These include better measurement precision, smaller confidence intervals, the elimination of floor and ceiling effects, simpler analysis by reducing the number of statistical tests required and avoiding the problem of multiple testing, and superior (theoretically) responsiveness.20 21 Summary measures are also more easily interpreted as their scores are directly related to scores for the general United States population, which have been transformed to a mean of 50 and an SD of 10.
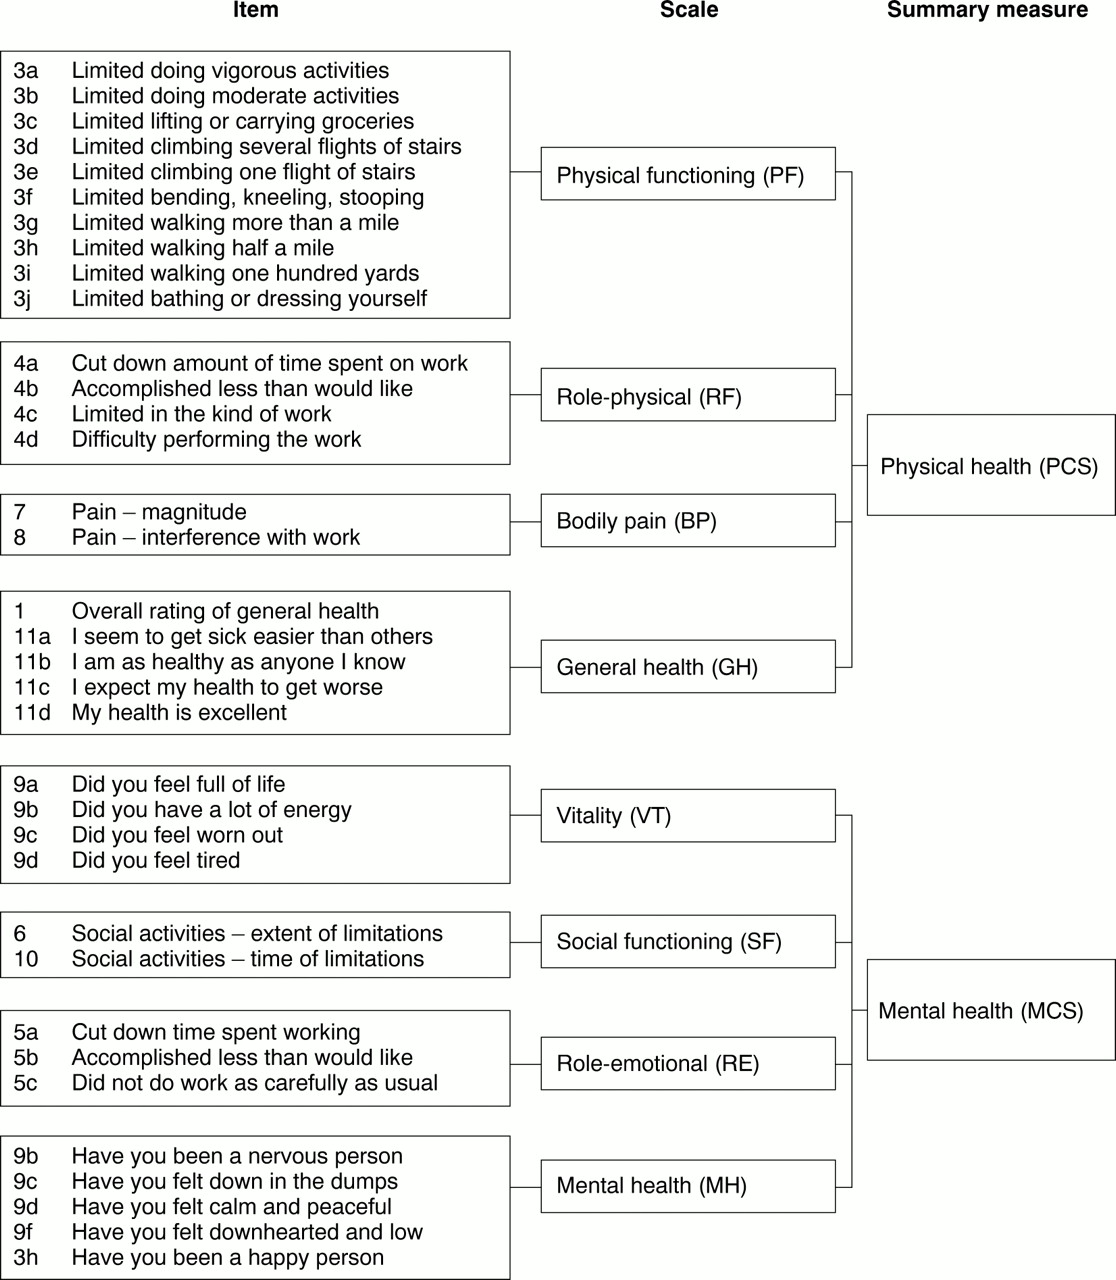
The measurement model of the SF-36. Adapted from Ware et al.20
Despite the widespread use of the SF-36 in multiple sclerosis, and the demonstration of some of its psychometric properties,15 22 23 no study has comprehensively examined two fundamental prerequisites for rigorous measurement: indicators of data quality and tests of scaling assumptions. Indicators of data quality, such as item non-response and missing scale and summary scores, determine the legitimacy of using an instrument. They reflect respondents' understanding and acceptance of a measure and help to identify items that may be irrelevant, confusing, or upsetting to patients.1 When there is a large amount of missing data, scores for scales and summary measures cannot be reliably estimated. Tests of scaling assumptions determine whether it is legitimate to generate scores for an instrument using the algorithms proposed by the developers. As data quality and psychometric properties are sample dependent,1 24 the performance of a measure in a specific application is more important than its performance generally.1 This study examines data quality and tests the scaling assumptions for the SF-36 in a sample of people with multiple sclerosis.
Methods
PARTICIPANTS, RECRUITMENT, AND DATA COLLECTION
Data were analyzed from two ethically approved studies conducted at the National Hospital for Neurology and Neurosurgery (NHNN) in London. Participants in the first study were adults with clinically definite multiple sclerosis attending the NHNN.25 Full details of the sampling and the stratification process are described elsewhere.23 Briefly, 150 consecutive attenders were recruited from three different sources: a weekly outpatient clinic, an inpatient neurological rehabilitation unit, and admissions under one consultant (AT). People in this hospital based sample were excluded if they had cognitive impairment precluding reliable completion of questionnaires (subjective judgement of JF), other comorbid disabling disorders, or were not English speaking. A stratification process was used to ensure an even spread of disease severity: all patients were examined by a neurology registrar and classified according to the Kurtzke expanded disability status scale (EDSS26) as either mild (EDSS⩽4.5), moderate (EDSS 5.0–6.5), or severe (EDSS⩾7.0). Consecutive admissions were recruited until there were 50 patients in each category. The SF-36 was administered by a single investigator (JF) in strict accordance with the developers' recommendations.3
The second study was a postal survey of 500 randomly selected, geographically stratified members of the multiple sclerosis Society of Great Britain and Northern Ireland. This was part of a larger study developing a patient based outcome measure for multiple sclerosis.27 The SF-36 was administered in a booklet along with three other health measures and demographic questions. Non-responders were sent reminders at 3 and 5 weeks.
THE MEASUREMENT MODEL OF THE SF-36
The measurement model of the SF-36 (fig 1) hypothesises that 35 of the 36 items are grouped into eight multi-item scales (physical functioning (PF), role limitations physical (RP), bodily pain (BP), general health perceptions (GH), energy/vitality (VT), social functioning (SF), role limitations emotional (RE), and mental health (MH) that are aggregated into two summary measures (physical component (PCS), mental component (MCS)). The remaining item is not used in scoring.
Different processes are used to generate scores for scales and summary measures. Likert's method of summated ratings is used for scales.28 That is, item responses are summed without weighting or standardisation. Before this is undertaken, two items are recalibrated and the scoring of nine items is reversed so that high scores always indicate better health.3 Finally, as the eight scales have different ranges they are transformed to have a common range of 0 (worst health) to 100 (best health) using the formula provided by Stewart and Ware.29
Scores for the two summary measures are generated in three stages. Firstly, scale scores are standardised (zscore transformation) by subtracting the United States population mean for that scale and dividing the difference by the United States population standard deviation for that scale. Next,z scores are multiplied by their respective factor score coefficients, derived from United States population data, and summed. Finally, these aggregated scores are standardised using a linear T score transformation to have a mean of 50 and SD 10, in the general United States population.20
The results of factor analytical studies led to the discovery of the two SF-36 summary measures. Principal components analysis of intercorrelations among SF-36 scales from several studies consistently extracted two components, with similar scale to component correlations, which accounted for most of the total SF-36 variance and variance in each of the individual SF-36 scales.20 These findings indicated that two summary measures could be generated without substantial loss of information. The two components were interpreted as measures of physical and mental health because the scales correlating highest with them were PF and RP, and MH and RE, respectively.
ANALYSIS PLANS
All analyses were undertaken in the hospital and postal samples separately, and in the pooled sample.
Are the data high quality?
This was determined by calculating the percentage of missing data for items, and the percentage of scale and summary scores that could be computed. A scale score can be calculated provided that 50% or more of the items are completed. Missing items are replaced with a person specific mean score, the average score across completed items for that respondent.3 30 By contrast, scores can only be calculated for summary measures when all eight scale scores are available.20 The impact of disease severity on data quality was also examined. In the hospital based sample, participants were categorised as mild, moderate, or severe by their EDSS score. In the postal survey, participants were categorised by their indoor mobility as walking unaided, walking with an aid, or wheelchair dependent.
Is it legitimate to report SF-36 scale scores in multiple sclerosis ?
Six scaling assumptions must be satisfied for SF-36 scale scores to be generated using the item groups proposed by the developers and Likert's method of summated ratings.
(1) Items in each scale must be roughly parallel (that is, measure at the same point on the scale and have similar variances), otherwise they do not contribute equally to the variance of the total score and must be standardised before combination.28 This criterion is evaluated by examining the symmetry of item response distributions and the equivalence of item means scores and SD.1
(2) Items in each scale must measure a common underlying construct, otherwise it is not appropriate to combine them to generate a total score.28 This criterion is evaluated by examining the correlation between each item and the total score computed from the remaining items in that scale (corrected item-total correlation). A range of recommended minimum values has been recommended: 0.20,31 0.30,32 and 0.40.1
(3) Items in each scale should contain a similar proportion of information concerning the construct being measured, otherwise they should be given different weights.28 This criterion is determined by examining the equivalence of corrected item-total correlations. Recently, Ware et al have stated that this criterion can be considered satisfied when values exceed 0.30, even if they vary.33
(4) Items must be correctly grouped into scales. That is, items must correlate substantially higher with the construct they are purported to measure than with the other constructs measured by the instrument.34 This criterion is considered satisfied when item-own scale correlations (corrected for overlap) exceed item-other scale correlations by at least two standard errors (
(5) Scales must generate reliable estimates, otherwise their scores cannot be confidently interpreted. This criterion is satisfied when Cronbach's α coefficients35 for each scale exceed 0.7036 or 0.80.32
(6) Scales must demonstrate that they measure distinct constructs, otherwise interpretation of their scores is confounded. This criterion is satisfied when the correlations among scales are substantially less than their respective reliability estimates.33
Is it legitimate to report SF-36 summary scores in multiple sclerosis?
Two scaling assumptions must be satisfied for SF-36 PCS and MCS scores to be generated using the developers' algorithm.3 32
(1) Principal components analysis, with orthogonal (varimax) rotation of extracted components, of the correlations among the eight SF-36 scales should support a two dimensional model of health that explains about 80%-85% of the total reliable variance in the SF-36 scales and at least 75% of the reliable variance in each of the eight SF-36 scales.3 20
(2) The magnitude and pattern of correlations between the eight SF-36 scales and the two rotated components should support their interpretation as measures of physical and mental health, and be consistent with other studies. That is, the PCS measure should correlate strongly (>0.70) with the PF, RP, and BP scales, and weakly (< 0.30) with the MH and RE scales, and vice versa for the mental MCS measure.3
These two scaling assumptions were examined by undertaking a scale level principal components analysis with varimax rotation. Eigenvalues37 and the scree plot38 were examined to determine the optimum number of components to rotate.
Results
SAMPLE CHARACTERISTICS
In the hospital based study, 150 people were recruited and one person withdrew. In the postal survey, a total of 409 booklets (82%) were returned; 121 questionnaires were returned blank, of these 84 were considered ineligible to participate in the study (changed address; did not have multiple sclerosis; deceased). Therefore, the response rate was 69% (409–121/500–84). The characteristics of patients in the two samples were similar, a wide range of ages and disease duration was included, and the broad categories of disability were evenly represented (table 1).
Characteristics of samples
ARE THE DATA HIGH QUALITY ?
For the hospital based sample there were no missing data, both types of SF-36 scores could be estimated for all participants, and results were not influenced by disease severity (table 2). In the postal survey, data quality was excellent in participants who reported that they walked unaided or with an aid. In wheelchair dependent participants, the proportion of missing data reached a maximum of 16.5% for two items (questions 3i, 3j) and, although scale scores could be computed for the vast majority of people, scores for summary measures could only be computed in 72% (all eight scale scores must be present for summary scores to be computed).
Per cent item non-response and computable scale and summary scores
IS IT LEGITIMATE TO GENERATE SF-36 SCALE SCORES IN MULTIPLE SCLEROSIS ?
Results for the pooled sample are reported, but independent analyses of the hospital and postal samples yielded similar results. Although all response options were endorsed for each item, item response-option frequency distributions were quite symmetric for only five of the eight scales (BP, GH, VT, SF, RE). Response distributions were skewed towards less favourable health states (low scores) for the PF and RP scales, and skewed towards more favourable health states for the MH scale. Nevertheless, items within each scale had similar mean scores and standard deviations indicating that they were roughly parallel.
All item-own scale correlations, corrected for overlap, exceeded 0.40 indicating that the items in each scale measured a common underlying construct, and that the criterion of Ware et al of equivalence of item total correlations was satisfied. Only two item-own scale correlations did not exceed item-other scale correlations by more than two standard errors. Item 9a (“How much of the time did you feel full of life”) correlated similarly with the VT and SF scales (0.61 and 0.54 respectively), and item 9b (“How much of the time have you been a nervous person”) correlated similarly with the MH and RE scales (0.46 and 0.36 respectively). Therefore, these two items had a limited ability to discriminate between two constructs that are hypothesised to be distinct.
α Coefficients for all SF-36 scales exceeded 0.80 indicating that all scales generated reliable scores (table 3). Intercorrelations among scales (range 0.18 to 0.57) were substantially below their respective α values, indicating that they were measuring eight related but distinct constructs.
Intercorrelations among SF-36 scales in the pooled sample (n=415 to 437)
Scores for the eight SF-36 scales spanned the entire scale ranges and, therefore, demonstrated good variability. Scores for the PF and RP scales were positively skewed (skewness 1.13 and 1.32 respectively) indicating that respondents tended to be more physically disabled. Scores for the other six scales were more evenly distributed (skewness−0.50 to +0.40). There were notable floor or ceiling effects for four scales: RP (floor 61.6%); RE (floor 37.3%, ceiling 41.4%); PF (floor 23.4%); BP (ceiling 21.1%).
IS IT LEGITIMATE TO GENERATE SF-36 SUMMARY SCORES IN MULTIPLE SCLEROSIS ?
Results for the pooled sample are reported, but independent analyses of the hospital and postal samples yielded similar results. Principal components analysis of intercorrelations among SF-36 scales extracted only one component with an Eigenvalue greater than unity. Nevertheless, the Eigenvalue of the second component (0.996) was essentially unity and examination of the scree plot supported the hypothesis that a two dimensional model of health underpins the SF-36 in multiple sclerosis. However, these two components explained less than 60% of the total reliable variance in all SF-36 scales, and less than 75% of the reliable variable in five of the eight scales (table4), indicating that a substantial amount of information from SF-36 scales is lost when summary measures are reported in multiple sclerosis. In addition, the magnitude and pattern of scale to component correlations in multiple sclerosis differ from the United States general population, indicating that the scale weights used to generate scores for the summary measures are not entirely applicable to people with multiple sclerosis (table 4, fig 2).
Correlations between SF-36 scales and rotated components
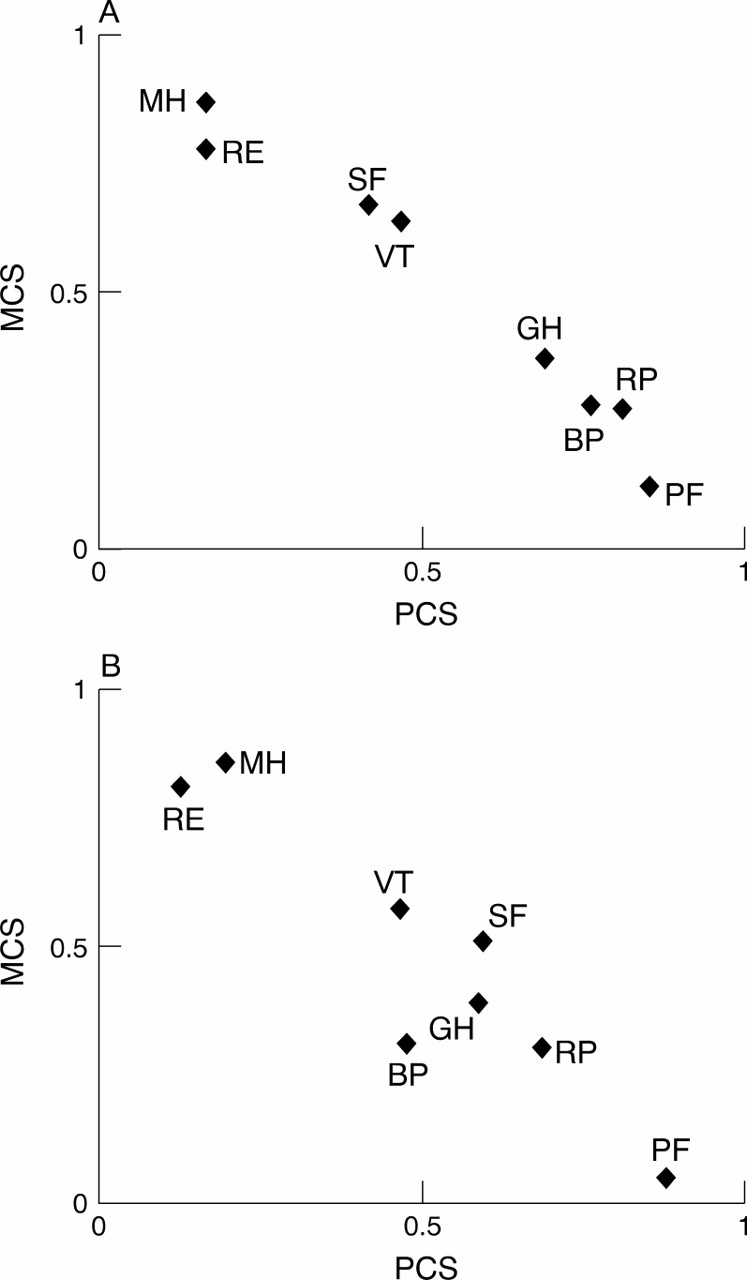
Plot of the SF-36 scale to component correlations. (A) SF-36 in the United States population (n=2.474). Prepared from data reported by Ware et al.20 (B) SF-36 in multiple sclerosis (n=438).
Discussion
This study has comprehensively examined the basic assumptions underpinning the use and scoring of the SF-36 in people with multiple sclerosis. High levels of data completeness indicate that the SF-36 is acceptable to patients in both hospital and community settings. However, data quality is somewhat compromised when the SF-36 is administered by postal survey to more disabled people. This finding probably represents physical limitations (for example, impaired vision and writing) rather than poor acceptance and understanding of the instrument because data quality in the more disabled hospital based subsample, where the instrument can be administered by interview if required, is excellent.
Results indicate that when using the SF-36 in multiple sclerosis, scale scores can be generated using Likert's method of summed ratings. All scaling assumptions were fully satisfied except item discriminant validity. There were two instances where items failed to achieve definite scaling successes. This is a minor problem because the other items in each scale fully satisfy the criterion and, therefore, anchor the construct being measured.33 More problematic are the floor and ceiling effects demonstrated for four scales. These exceed the recommended maximum of 15%,39 and represent subsamples of people for whom changes in health status may be underestimated or not detected by the SF-36.
The most important finding of this study is that scores for the two SF-36 summary measures should be reported with caution. Although PCA supports a two dimensional model of health, this model does not explain as much of the variance in SF-36 scales as required and the pattern of scale to component correlations is not entirely consistent with findings in other clinical populations.2 20 40 In particular, the BP scale correlates only moderately with the physical component (0.48), and the SF scale correlates only moderately with the mental component (0.51) and similarly with the physical component (0.60). Although small departures from predicted results are to be expected, and have been reported,2 these findings in multiple sclerosis seem to be more significant. The finding that the two components explain less than 60% of the variance in SF-36 scales suggests that even multiple sclerosis specific algorithms for summary scores, based on principal components analysis with orthogonal rotation, may not be feasible.
Other authors have raised concerns about the SF-36 summary scores because the weightings are based on factor score coefficients generated by orthogonal factor rotations.41-43 Simonet al argue that physical and mental health are related and, therefore, orthogonal rotations which assume factors are uncorrelated could generate misleading results. They support their argument with empirical evidence in primary care patients.41 Norvedt et al show that the SF-36 MCS underestimates the mental heath impact of multiple sclerosis,43 and that the RAND-36 physical and mental summary scores,42 the weightings of which are generated by oblique factor rotations (which assume the factors are correlated), provide mental health scores that are more consistent with multiple sclerosis.
The results of our study, however, suggest that the problem may be more fundamental than the method of factor rotation. Factor analysis is a data reduction technique that analyses the relations among a group of variables and identifies clusters of variables that are empirically distinct. Table 3 and figure 2 do not show distinct clusters among SF-36 scales. Indeed, correlations among the four scales hypothesised to correlate highest with the physical health component (PF, RP, BP, and GH) are notably lower (range 0.28 to 0.49; mean 0.36) than those reported by others (range 0.52 to 0.65; mean 0.5720) and similar to those between physical and mental scales (range 0.18 to 0.48; mean 0.37).
In view of the comments of Simon et al, and others who raise concerns about the use of principal components analysis or orthogonal factor rotations in health measurement,44 we repeated the factor analytical studies using different methods of extraction (principal axis, maximum likelihood, unweighted and generalised least squares) and oblique (promax) rotation. All methods of factor analysis generated similar results. Most scales (four or more) did not load uniquely on only one factor and had relatively high loadings (>0.50) on both factors. Furthermore, no clear factor solutions were generated. These findings are clinically sound. For example, fatigue can impact significantly on both physical and mental functioning and roles. Although our failure to replicate the SF-36 factor structure may represent cultural differences (United Kingdom versus United States), evidence suggests that this is not the case.45
Although this is a relatively small study the generalisability of these results is supported by two facts. Firstly, when tests of scaling assumptions underpinning the generation of SF-36 scale and summary scores were undertaken for the hospital and postal samples separately, similar findings were demonstrated. Secondly, SF-36 scale score distributions, floor and ceiling effects, and α coefficients reported in this study reproduce the findings of others.15 22Nevertheless, further studies are required to establish the replicability of these results and the interpretation of these findings. It is also important to note that this study has only considered data quality and scaling assumptions, criteria that should be satisfied before more detailed psychometric evaluations are undertaken. More extensive evaluations of SF-36 scales in people with multiple sclerosis are required to determine the extent to which they are valid and responsive indicators of the health constructs that they purport to measure.
This study did not consider the content validity of the SF-36 in multiple sclerosis. That is, to what extent do the items of the SF-36 compare with issues volunteered as important by patients in open ended interviews. Generic measures are designed to assess health domains thought to be universally relevant. Therefore, they have the advantage of enabling comparisons across diseases and interventions, but the disadvantage of failing to reflect domains and aspects of health that are disease unique. This may influence the potential of generic measures to detect change. These arguments underpin the development of disease specific health measures, and the use of both types of measures in studies.27
A limitation of our study was that we used an arbitrary criterion, the subjective judgment of one of the authors, to determine whether people in the hospital based sample had significant cognitive impairment precluding reliable completion of questionnaires. It would have been preferable to have had cognitive function formally evaluated, and a predefined empirically based cut off level for inclusion or exclusion. Unfortunately, such criteria do not exist as the relation between cognitive impairment and ability to complete self report questionnaires in a reliable and valid manner has not been formally evaluated. This is an important area for future research in patient based outcome measurement of neurological disorders associated with cognitive impairment.
The results of this study have implications for clinical trials in multiple sclerosis. Some new and expensive treatments are now available that have been shown to significantly affect the natural history of multiple sclerosis in terms of brain MRI and relapse rate but not impact on disability progression. As the disability measure used in all of these studies, the EDSS, has poor ability to distinguish between groups and individual patients and limited responsiveness,46 multiple sclerosis clinical trialists are looking for more rigorous methods of measurement of health status. There is, rightly, considerable interest in the SF-36. Furthermore, the benefits of SF-36 summary scores over scale scores (absence of floor and ceiling effects, better measurement precision, greater responsiveness, fewer statistical analyses) offer an attractive solution to many measurement problems. Results from this and other studies15 22 23 show floor and ceiling effects for SF-36 scales that may limit their usefulness in detecting treatment effects, and this study questions the validity of SF-36 summary scores.
This study also has wider implications for health measurement. The findings are of practical use for neurologists and other health professionals who may take measures “off the shelf” expecting that such attributes have been fully tested or that measures are generally applicable. The result might also be important in reporting accurately the strength of treatment or rehabilitation effects.
Conclusions
The findings of this study provide some empirically based guidelines for the use of the SF-36 in multiple sclerosis. High levels of data quality support its use as a health measure in diverse groups of people with multiple sclerosis. Tests of scaling assumptions suggest that SF-36 scale scores can be reported with confidence, but that summary scores are not valid. Results also suggest that use of the SF-36 might be limited to cross sectional studies as the floor and ceiling effects associated with scale scores could underestimate treatment effectiveness in clinical trials, and the extent of health changes in longitudinal studies. It is important to note that health measures such as the SF-36 are recommended for group comparison studies and not individual patient clinical decision making. This is because confidence intervals around individual scores are too wide to be able to make reliable and valid judgments at the level of the individual patient.39 Finally, this study provides further evidence of the need to evaluate psychometric properties, including scaling assumptions, in relevant clinical populations before these instruments are used to evaluate therapeutic effectiveness in disease specific samples.
Acknowledgments
We are very grateful to the people with multiple sclerosis who participated in the study, the multiple sclerosis Society of Great Britain and Northern Ireland for their collaboration in this project, and Ms Laura Camfield at the Institute of Neurology for help with the postal survey.
