Article Text

Abstract
Objective: To compare the HMPAO SPECT cerebral perfusion patterns in early and late onset Alzheimer’s disease.
Methods: Twenty patients with early onset disease (<65 years) and 44 patients with late onset disease (>65 years) were studied. All patients fulfilled NINCDS-ADRDA clinical criteria and had details of disease severity and length of history at the time of imaging. Technetium-99m HMPAO SPECT brain scans were acquired on a multi-detector gammacamera and analysed visually and with statistical parametric mapping (SPM99).
Results: Patients with early onset disease had significantly greater posterior cortical association area involvement whereas those with late onset disease had significantly greater medial temporal hypoperfusion. These findings were unchanged after controlling for disease severity and length of illness.
Discussion: These functional imaging findings of the differences between early and late onset Alzheimer’s disease are supported by published findings that include histopathological and clinical evidence; namely late onset patients tend to present with the characteristic involvement of the medial temporal lobes producing marked memory loss whereas early onset patients present with predominant posterior cortical association area involvement. These age related findings should be borne in mind when clinically diagnosing, and interpreting functional brain imaging studies in, patients with suspected Alzheimer’s disease.
- Alzheimer’s disease
- HMPAO
- SPECT
Statistics from Altmetric.com
It is estimated that over 800 000 people in the United Kingdom are demented; Alzheimer’s disease (AD) is responsible for about 60% of these cases with Lewy body, vascular, and frontotemporal dementia accounting for most of the remainder. Although the vast majority of AD patients are elderly, it is estimated that there are up to 7000 cases of early onset disease—that is, less than 65 years of age.1 Given the employment, and subsequent financial and social, consequences, it is clearly important to make an early and accurate diagnosis.
Characteristically the disease presents as forgetfulness for recent events—anterograde memory impairment—due to the amyloid tangles and plaques deposited in the transentorhinal region and the hippocampal complex.2 There is, however, accruing clinical and histopathological evidence that patients with AD can present with the manifestations of extra-temporal dysfunction.3 Some studies have noted a tendency for younger patients (that is, early onset) to present clinically with greater posterior cortical involvement affecting the parieto-temporo-occipital association areas.4 Obviously, to make an accurate diagnosis in the mildest stages of any dementing process, it is important to recognise the various subtle manifestations of this disease.
Neuroimaging techniques, especially CT and SPECT imaging, are capable of demonstrating atrophy and hypoperfusion respectively in at least moderately advanced AD.5 However, the role of imaging in the diagnosis of mild disease is unclear. Previous generations of single headed SPECT gammacameras were able to clearly demonstrate abnormalities in the comparatively large posterior cortical association areas in moderately severe disease but lacked sufficient resolution to visualise medial temporal structures. The introduction of multi-crystal scanners for routine clinical use now enables clear visualisation of the medial temporal lobes where critical hippocampal structures are located. This therefore raises the question as to whether cerebral perfusion imaging can shed any light on the differing presentations of AD.
The primary aim of this study was to compare the cerebral perfusion patterns of patients presenting with early onset and late onset AD using HMPAO SPECT imaging. Image analyses were undertaken using visual interpretation and statistical parametric mapping.
METHODS
This retrospective study identified all patients less than 65 years of age who were referred to the Department of Nuclear Medicine, Southampton General Hospital, from memory clinics throughout Hampshire, Dorset, and the Isle of Wight, during a three year period from 1998–2001. Consultants in old age psychiatry determined whether these patients fulfilled the NINCDS-ADRDA clinical criteria for possible or probable AD either at the time of, or subsequent to, imaging.6 Patients were included in this study if there was recorded evidence of an MMSE score and length of clinical history at the time of imaging. Twenty patients less than 65 years of age fulfilled these criteria and compiled the early onset AD group.
Forty four late onset patients (greater than 65 years) who were deemed by old age psychiatrists to fulfil the clinical criteria either at, or subsequent to, imaging for a diagnosis of AD, and had documented evidence of an MMSE score and length of clinical history at the time of scanning, formed the late onset group.
Technetium-99m HMPAO SPECT brain imaging was undertaken after the intravenous injection of 500 MBq of 99mTc HMPAO at rest in a quiet, dimly lit room. Images were acquired using a SMV DST-XL dual head gammacamera equipped with low energy ultra-high resolution collimators describing an elliptical orbit as close as possible to the skull. The total acquisition took 32 minutes and consisted of 128 projections acquired for 25 seconds into a 128×128 acquisition matrix; the magnification factor of 1.33 gave a pixel size of 3.38 mm.
The raw projections were pre-filtered with a Butterworth filter (order 10, cut off 0.20 cycles/pixel), and decay and attenuation corrected using a 2-iteration Chang algorithm (μ=0.112/cm) using a uniform elliptical cross section. Transverse slices of one pixel thickness were reconstructed using filtered back projection with a Wiener filter (fwhm=7). Transverse, coronal and sagittal slices were then reformatted along both orbitomeatal and temporal planes and summed twofold to obtain 6.8 mm thick slices. Images were also normalised to the mean counts of a cerebellar region of interest, which consisted of two circles of five pixels diameter placed on the hottest part of each cerebellar hemisphere. A 10 colour discrete colour scale was used for the final display. The images were analysed visually and with statistical parametric mapping (SPM99).7
A consultant in nuclear medicine with a specific interest in neuronuclear imaging reported all scans blind to identification, group identity, and clinical details. The appearances of the left and right medial temporal lobes (MTL) and the parieto-temporo-occipital (P/T/O) association cortices were graded from 1-normal; 2-equivocally normal; 3-mildly abnormal; 4-moderately abnormal; 5-severely abnormal. Group comparisons were undertaken for each region using Mann-Whitney non-parametric tests.
The statistical parametric software package, version SPM99, was used for image analyses.7 The raw projections were not prefiltered and reconstructed with a ramp filter. These images were first masked to remove any non-cortical activity, then registered to a SPECT template image set in standardised stereotactic space, smoothed, and then count normalised to the cerebellum.8,9 The SPM statistical model performed voxel by voxel univariate two sampled t tests to compare the groups of early onset and late onset AD patients. The MMSE scores and length of history were also included as covariates in the patient comparison. The grey matter threshold scaling was set to 0.7; the value used for routine clinical studies in our department. The threshold images show voxels, which are significantly different using uncorrected p<0.001. A group of voxels (that is, cluster) was considered significant when p<0.01 corrected for number of voxels.10
RESULTS
Table 1 shows the demographic details of the patients. The mean length of clinical history of about two years was similar for the two groups. The mean MMSE score of the early onset group was 18.8 compared with 21.8 in the late onset group (unpaired t test p<0.02). In the late onset group, 73% and 27% were classified as probable and possible AD respectively; in the early onset group, 60% and 40% were similarly classified. Structural imaging, either MRI or CT, was undertaken in all cases of young onset AD; in all cases the studies were reported as either normal or displaying equivocal evidence for atrophy. Only a minority of late onset cases had structural imaging, these being reported as either normal, equivocal, or “atrophy consistent with age”.
Demographic details
Figure 1 A, B, C are typical HMPAO SPECT scan appearances of a healthy control subject and patients with late onset and early onset AD respectively.

Typical HMPAO SPECT scan appearances of a healthy control (A), late onset AD (B), and early onset disease (C). Top left, a right parasagittal slice; top right, a left parasagittal slice; bottom left temporal lobe slice; bottom right, a coronal slice. Note the predominant hypoperfusion in the medial temporal lobes in the late onset disease (long arrows in B) compared with the predominant parietal hypoperfusion in the early onset disease (short arrows in C).
Figures 2 shows box and whisker plots for the cerebral perfusion scores for the left and right P/T/O association areas and the MTL. In the early onset group, the median scores for the left and right P/T/O association areas were 4 (moderately abnormal) compared with 2 (equivocally normal) for the late onset group (p<0.002). In contrast the median scores for the left MTL for the early onset group was 2 (equivocally normal) as compared with 5 (severely abnormal) in the late onset group (p<0.001). For the right MTL, the median score in the early onset group was 2 (equivocally normal) compared with 4 (moderately abnormal) in the late onset group (p<0.001).

Median, quartiles, minimum, and maximum cerebral perfusion scores by visual interpretation of HMPAO images in early onset and late onset AD. MTL, medial temporal lobe: P/T/O, parieto-temporo-occipital association areas. (1=normal; 5=severely abnormal). Note the predominant involvement of the posterior association areas in early onset disease as compared with the medial temporal lobe involvement in late onset disease.
Averaging these left and right visual perfusion scores demonstrated that on an individual basis 79% of all late onset cases showed greater medial temporal hypoperfusion as compared with the posterior association cortices. Conversely, 85% of early onset cases showed greater hypoperfusion to the posterior association cortices as compared with the MTL.
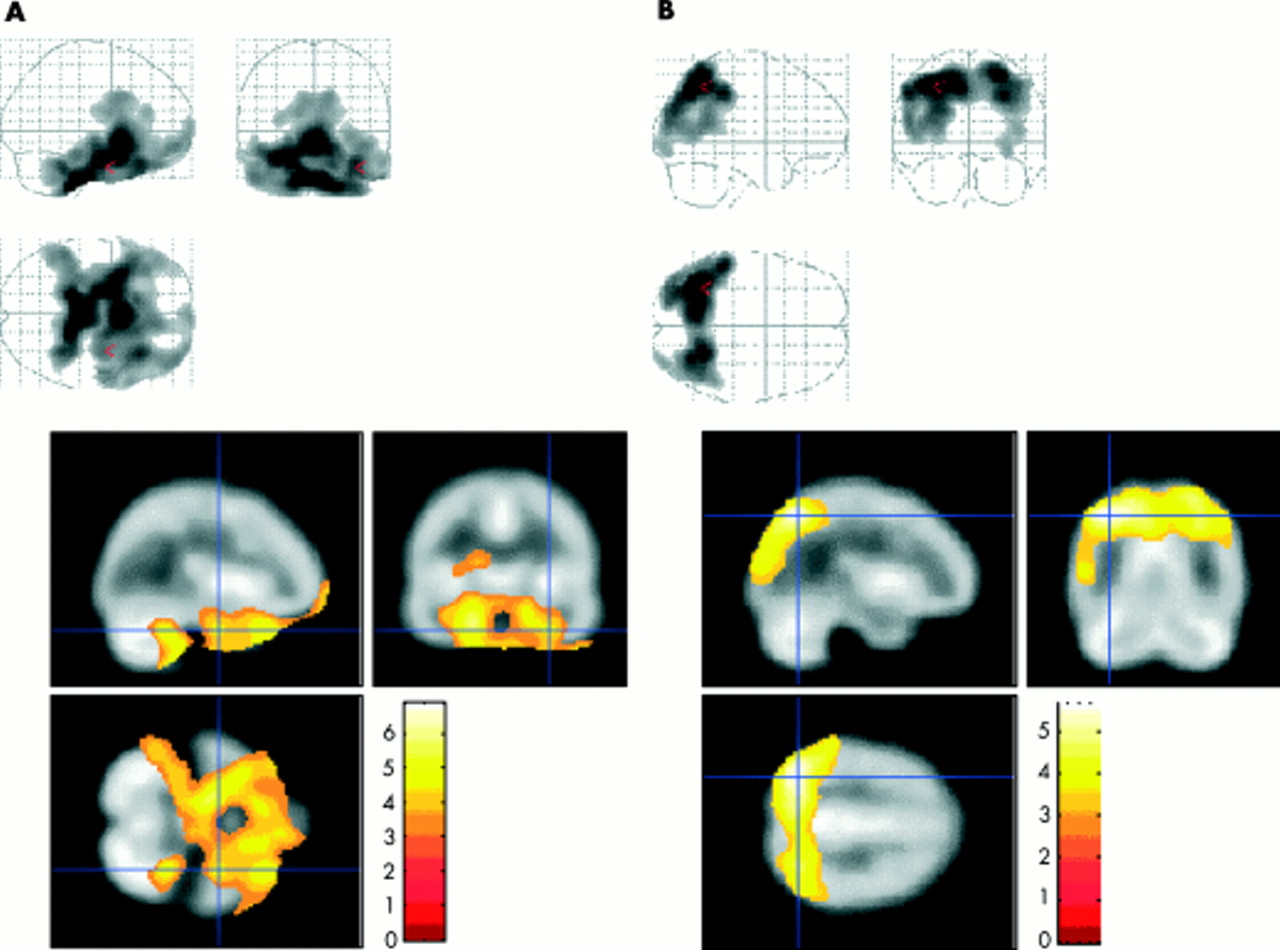
Figure 3A and B demonstrate the SPM group comparisons of directly comparing the early onset and late onset HMPAO SPECT cerebral perfusion patterns. Figure 3A shows the regions for which the voxel counts in the young onset group were significantly less than the late onset group (p<0.001) whereas figure 3B shows the regions for which the voxel counts in the late onset group were significantly less than the early onset group (p<0.001). It can be clearly seen that the posterior association cortices are more severely affected in the early onset group as compared with the medial temporal regions in the late onset group. After controlling for MMSE score and length of history, the posterior association cortices still remain more severely affected in the early onset group (fig 4).

(A) SPM analysis demonstrating regions of the brain where cerebral perfusion is significantly less in the late onset group as compared with the early onset group. Note that the significant regions are predominantly the medial temporal lobes (p<0.001). (B) SPM analysis demonstrating regions of the brain where cerebral perfusion is significantly less in the early onset group as compared with the late onset group. Note that the significant regions are the posterior association areas (p<0.001).

SPM analysis demonstrating regions of the brain where cerebral perfusion is significantly less in the early onset group as compared with the late onset group after controlling for the MMSE score and length of history as covariates. Note that the posterior association areas are still significantly impaired in early onset disease (p<0.001).
DISCUSSION
The introduction of acetylcholinesterase inhibitor therapy for AD has demonstrated for the first time that the progression of this fatal disease can be affected, albeit temporarily.11 As treatments become more powerful and effective it will become increasingly important to make an early and accurate diagnosis in the earliest stages of cognitive impairment.
Several groups have reported posterior cortical atrophy—either bi-parietal and/or occipito-temporal involvement—as a presentation in AD. An informative study noted that patients with the bi-parietal variant present with visuo-spatial problems—that is, agraphia and dyspraxia— which may progress to Balint’s syndrome (visual disorientation, optic apraxia, and simultanagnosia) whereas patients with the occipito-temporal variant, the visual variant of AD, present with complaints of visual distortion, difficulty with object recognition, topographical agnosia, and alexia.12 Histopathological material is becoming available in an accruing number of these cases and has demonstrated extensive neuritic plaque formation and numerous neuro-fibrillary tangles in the archicortex and cerebro-neocortex with particularly severe parieto-temporal and/or occipital association area involvement relative to the medial temporal structures.3,12–22 Although there has been no verifed significant association between age of onset and posterior cortical involvement within individual histopathological studies, numbers in each sample are comparatively small. Combining all these studies, a scrutiny of the ages in those with histopathological confirmation does show over 90% of subjects to be less than 70 years of age; about two thirds of these were 65 years of age or less. This is a considerably greater proportion than the relative prevalence in the general population of AD sufferers. Obviously, one must consider the possibility of selection bias as younger patients with atypical presentations may be more likely to be included.
The medial temporal hypoperfusion in the late onset group is likely to be a direct consequence of amyloid deposition in this area. However, as the disease advances from the mild to the moderate stages in the older patient, the initial posterior association area hypoperfusion visualised on HMPAO SPECT imaging is a reflection of disconnection of efferent fibres projecting from medial temporal structures to the posterior association cortices rather than direct amyloid deposition in itself in the posterior-association cortices.5 This functional impairment can be demonstrated on SPECT and PET imaging whereas structural imaging may not show posterior cortical atrophy at this stage. As the disease progresses there is direct amyloid infiltration into these posterior association cortices followed by the frontal association areas.2 Conversely the presence of posterior association area hypoperfusion on HMPAO SPECT in the early onset group would seem to be more reflective of direct amyloid deposition in this region.
The tendency for younger patients with AD to present clinically with predominant posterior cortical association area involvement, as compared with the marked memory loss of the late onset disease, has been known for sometime. However, this important message is comparatively unpublicised. Our findings of predominant posterior cortical involvement in early onset AD on functional imaging are supported by others using SPECT and FDG PET.23–25
There is considerable controversy in the literature about the location and extent of aging effects on cerebral perfusion. However, the consensus suggests a reduction with aging. Consequently the parietal hypoperfusion demonstrated in the early onset group attains greater significance. However, a contribution from aging to the medial temporal hypoperfusion in the late onset group cannot be wholly excluded. Suffice to note, the histopathological evidence of amyloid deposition at this site.
Another study using HMPAO SPECT demonstrated significant posterior cortical involvement in the early onset group, which was no longer significant after controlling for severity and duration of illness.26 Although the early onset group in our study had a small, but significant, reduction in mean MMSE scores, our findings of predominant posterior cortical involvement in the younger patients were still significant after controlling for disease severity and duration of illness. These study differences most probably reflect our use of the voxel by voxel SPM technique as compared with the operator dependent region of interest analysis.
In conclusion, the imaging findings from this study seem to be consistent with emerging histopathological evidence of predominant posterior cortical amyloid deposition in early onset AD as compared with the medial-temporal involvement in the late onset patient. Consequently younger patients may be more likely to present with clinical features of posterior association area involvement as compared with the characteristic amnesia in the older patient. These age related findings should be clearly borne in mind when clinically diagnosing, and interpreting functional imaging studies in, patients with suspected AD.
Acknowledgments
The authors would like to thank Professor Narinder Kapur, Professor of Neuropsychology, Southampton University, for his helpful comments with the text.
REFERENCES
Footnotes
-
Competing interests: PMK has participated in European multi-centre trials and received research sponsorship from Amersham Health, manufacturer of HMPAO (Ceretec).