Article Text

Abstract
Background and objectives: Rate and pattern of progression of cognitive decline in multiple sclerosis (MS) has not been clearly identified. The present study aimed to identify correlations between cognitive tests and disease duration, construct longitudinal cognitive curves, and assess pattern of change over time.
Methods: The Neuropsychological Screening Battery for Multiple Sclerosis was administered in 150 consecutive MS patients, and tests that correlated with disease duration were identified. Percentile curves were constructed and the pattern of cognitive decline over time explored. The cognitive curves were validated in an additional group of 83 patients with MS.
Results: Three of four measures of the spatial recall test (SPART 7/24), and the paced auditory serial addition task for two seconds (PASAT 2′), correlated with disease duration. These tests were used to construct cross-sectional curves identifying the pattern of cognitive decline over time in the MS population. On the basis of this cross-sectional analysis, the earliest cognitive decline occurred in the SPART 7/24 trials 1–5 between one and three years from onset, followed by decline in the SPART delayed recall between three and seven years, and then by decline in the PASAT 2′ after seven years from onset.
Conclusions: Verbal fluency and verbal memory appear to be affected earliest in MS. The pattern of cognitive decline is further characterised by a decrease in visuospatial learning, followed by delayed recall, and then by attention and information processing speed. Cognitive percentile curves can be used to evaluate the pattern of progression and identify patients at increased risk.
- CLTR, consistent long term retrieval
- LTS, long term storage
- MS, multiple sclerosis
- NSBMS, Neuropsychological Screening Battery for Multiple Sclerosis
- PASAT, paced auditory serial addition test
- SPART, spatial recall test
- SRT, selective reminding test
- WLG, word list generation
- multiple sclerosis
- cognition
- neuropsychological tests
- pescentile curves
Statistics from Altmetric.com
- CLTR, consistent long term retrieval
- LTS, long term storage
- MS, multiple sclerosis
- NSBMS, Neuropsychological Screening Battery for Multiple Sclerosis
- PASAT, paced auditory serial addition test
- SPART, spatial recall test
- SRT, selective reminding test
- WLG, word list generation
Cognitive impairment is known to be highly prevalent in multiple sclerosis (MS), ranging from 40% to 70%,1–4 and is associated with significant impact on activities of daily living.3,5 The commonest cognitive impairments found in MS are in memory and information processing speed,6,7 followed by difficulties in verbal abilities and attention span as well as executive functions.8,9,10,11,12 Cognitive deficits can be detected early in the disease,13–15 they are usually a feature of advanced disease, and are especially severe in patients with chronic progressive or secondary progressive course.1,4,16–18 Amato et al19 recently published the results of a natural history study of cognitive dysfunction in patients with early onset MS with a 10 year follow up, the longest follow up period to date. At 10 years, 56% (25/45) of the cohort demonstrated cognitive dysfunction. Verbal memory, abstract reasoning, and linguistic processes were the first to be impaired, and later, deficits were found in attention and short term spatial memory. This study further strengthened the concept that cognitive decline in MS has a pattern of progression over time, in spite of the fact that there are relatively few natural history studies of longitudinal cognitive assessment in MS20 and no data related to the patterns and rate of progression of the cognitive decline. It is generally accepted that once cognitive dysfunction develops in a patient with MS it does not remit. Moreover, although cognitive deficits may remain stable over time, more frequently they tend to progress.19,21–23
Therefore, our aim in the present study was to evaluate cognitive performance in a large MS population and to generate cross-sectional cognitive curves as a function of disease duration. Such curves may be used as a tool to determine the relative risk of progression of cognitive impairment and to identify patients whose cognitive function is worse than the expected curve score. These patients may benefit from early treatment interventions with immunomodulatory drugs, as indicated by Fischer et al24 who have demonstrated that interferon beta-1a had a significant beneficial effect on cognitive performance in early MS, and from psychopharmacological treatments like anticholinesterase inhibitors,25 as well as from cognitive remediation therapy including direct training, compensatory strategies and neuropsychotherapy.26 On the other hand, patients who perform better than the anticipated curve score might reflect resilience associated with a benign disease course.
PATIENTS AND METHODS
Study design
This was a prospective, cross-sectional study including 150 consecutive patients with MS followed at the Multiple Sclerosis Center, Sheba Medical Center, Tel-Hashomer, Israel. The Sheba Medical Center institutional review board approved the study.
Study participants
Patients with definite MS (Poser criteria),27 and a relapsing remitting disease course were included in the study. All patients had undergone cognitive and psychiatric assessments. The following demographic variables were collected from our computerised database registry: age, sex, and disease duration from onset. Patients diagnosed as having anxiety and/or major depression by a semistructured clinical interview according to the DSM-IV criteria were excluded from the analysis (n = 12). The rationale for this exclusion was the adverse effect of major psychopathology on cognitive performance in patients with MS.28–30
Since we were specifically interested in evaluating cognitive performance early in the disease course, the patients were divided into two groups: (a) patients with disease duration ⩽5 years (short term group), and (b) patients with disease duration >5 years (long term group). We chose the five year period as an arbitrary cut-off point because we thought that a period of five years was long enough to detect existence of cognitive abnormalities early in the disease course.
Neuropsychological assessment
The comprehensive Neuropsychological Screening Battery for Multiple Sclerosis (NSBMS)3 was administered in a single 30 minute testing session by one of two trained clinical and rehabilitation psychologists (ML and NA) experienced in administration of these tests. The NSBMS (translated and validated in Hebrew) assesses spatial memory, verbal memory, short and long term recall, attention, and verbal fluency as previously described.3,4 The NSBMS was performed in the following order.
-
A six trial, 12 word version of the selective reminding test (SRT), which measures verbal learning and delayed recall (assessed after 20 minutes delay) through presentation of a list of 12 words and six subsequent learning trials. Two measures were evaluated:
long term storage (LTS) which assesses the ability to store new information
consistent long term retrieval (CLTR) which assesses ability to recall verbal information.
-
The 7/24 spatial recall test (SPART 7/24), which assesses visuospatial learning, susceptibility to proactive and retroactive interference, and delayed recall. The test is performed by re-creating the pattern of seven checkers on a 6×4 checkerboard viewed for 10 seconds and includes:
total number of correct responses on the five learning trials (SPART trials 1–5, set A)
number of correct responses for the interfering set B (SPART trial B)
number correct for recall of set A (SPART trial A recall)
number of correct responses for delayed recall (delayed SPART 7/24) performed at the end of the session.
-
Word list generation (WLG), which measures semantic verbal fluency evaluating the spontaneous production of words. The patients were allowed 60 seconds to generate as many words as possible beginning with a particular letter. Proper names, numbers, and variants were not allowed.
-
Paced auditory serial addition test (PASAT), which evaluates sustained attention and information processing speed. The 60 trial version of the PASAT was used—the patient was asked to add each number to the one immediately preceding it while numbers were presented every three and two seconds. The patients were first tested with a three second interstimulus interval (PASAT 3′) and immediately afterwards with a two second interstimulus interval (PASAT 2′).
Raw tests scores were adjusted for age, education, and sex according to the formulas in the NSBMS manual and are given in percentiles according to normative population data.
NSBMS tests results distribution in percentiles within the MS population
We analysed the NSBMS tests results according to percentiles within the MS population. Each patient’s test score was assigned a specific percentile according to normal age and sex matched population. Then, the distribution of those normative values was examined within the MS sample. The resulting assigned percentiles were grouped into the following major percentile groups: 5th, 25th, 50th, 75th, and 95th. Confidence intervals for each major percentile were calculated.
Cognitive curves
We used the NSBMS tests results similarly to the anthropometric measurements of height, weight, and head circumference for construction of growth curves in children,31 and constructed cross-sectional cognitive curves by regression analysis. The 150 patients who contributed the cognitive data for the construction of the curves were designated as the “cognitive curve construction group”. Cognitive curves were constructed for only those cognitive tests that significantly correlated with disease duration. Thus, for each cognitive test major percentile curves represent the accumulation of mean scores of the test designated to a specific year of disease. These cognitive curves demonstrate the progression of cognitive performance over time.
Validation of cognitive curves
A group of 83 patients with MS was designated as the “validation group”. All 83 patients in the validation group were not included in the previous evaluation group used for the construction of the cognitive curves. Patients in the validation group were matched for age, sex, and disease duration with the cognitive curve construction group and underwent identical cognitive and psychiatric assessments. Patients diagnosed as having anxiety and/or major depression by a semistructured clinical interview according to the DSM-IV criteria were excluded from the analysis (n = 7).
Statistical analysis
The demographic variables are presented as mean (SD). Spearman’s correlation test was used to evaluate the correlation between disease duration and the NSBMS tests scores given as percentiles of the population norms after adjustment for age, sex, and education. Cognitive curves were constructed using a linear regression model with 95% confidence interval (CI). Student’s t test was used to compare the percentiles of cognitive curves between groups, and p<0.05 was considered statistically significant. We applied linear regression to evaluate the time of change for each cognitive test by calculating the β estimates between disease duration and cognitive test score for different time intervals. Time intervals with significantly different β estimates (p<0.05) were determined for each test. Computations were performed with the use of SAS (version 8.2) software.
RESULTS
A total of 150 consecutive MS patients (52 men, 98 women; mean (SD) age 40.8 (11.9) years, range 18.5–64) were included in the study. The mean disease duration was 5.2 (4.6) years (range 1 month–15 years). Of these, 92 patients (61.3%) had been treated with disease modifying drugs (beta interferons, glatiramer acetate, or intravenous immunoglobulin) for between four months and 6.2 years. Patients were divided into the short term (⩽5 years; n = 80) and long term (>5 years; n = 70) groups according to disease duration as described above.
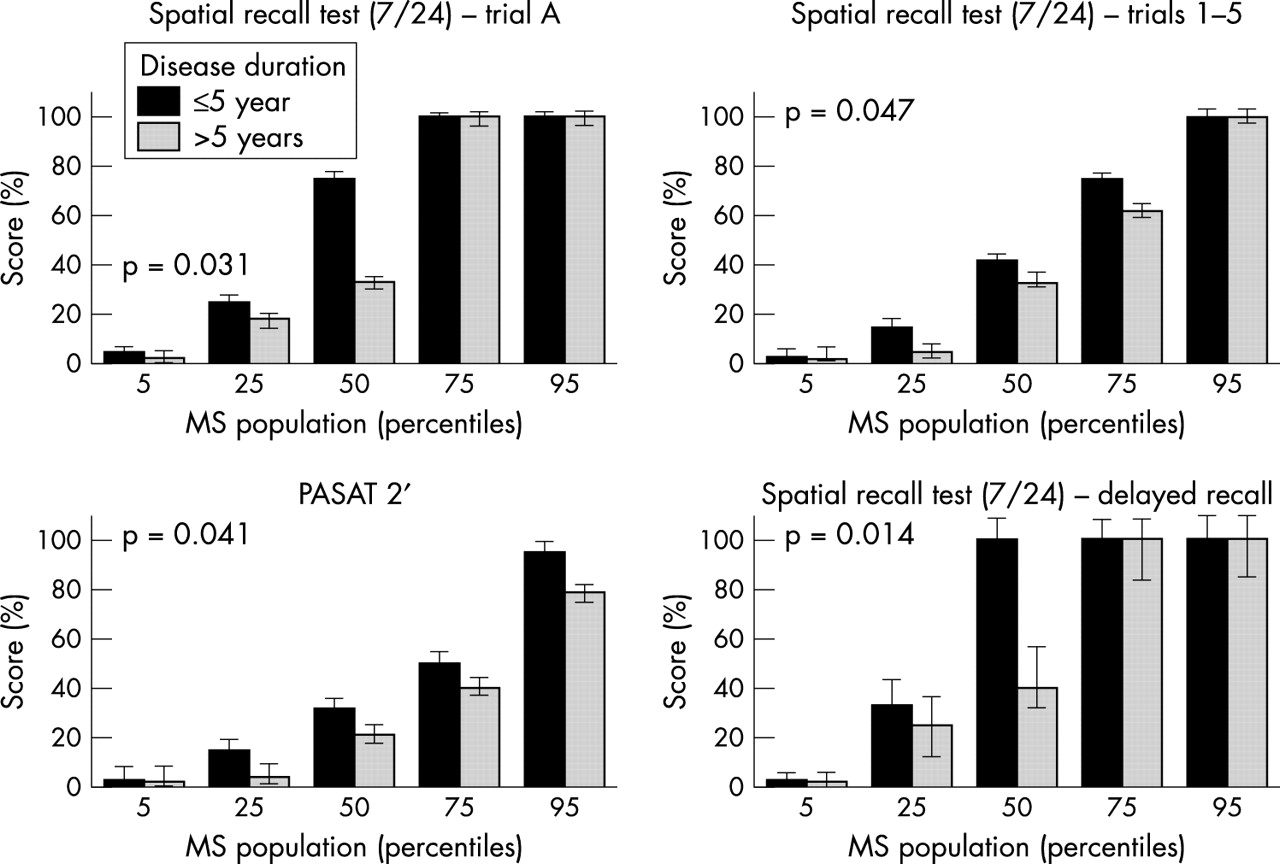
The results of the NSBMS tests are presented as mean percentile with 95% CI (table 1). After five years from disease onset, patients’ cognitive performance decreased by about 10% from the mean baseline test score (SPART trials 1–5, SPART trial A recall, delayed SPART and PASAT 2′; see table 1). Spearman’s correlation test disclosed that three of four measures of the SPART 7/24 (trials 1–5, trial A recall, delayed SPART 7/24), and PASAT 2′ significantly correlated with the disease duration groups (table 1, fig 1), suggesting that these tests can be useful to assess cognitive decline over time. It is evident from fig 1 that the differences between the two disease duration groups occur mainly in the 25th, 50th, and 75th percentiles of the MS population for the trials 1–5 of the SPART, in the 25th and 50th MS population percentiles for the delayed SPART and trial A recall, and in all percentiles for the PASAT 2′.
Cognitive tests results in patients with multiple sclerosis

Results of the Neuropsychological Screening Battery for Multiple Sclerosis (NSBMS) tests that differed between the two disease duration groups. The y axis gives the NSBMS test scores in accordance with percentiles of the population norms and the x axis gives the percentiles of the MS population achieving that score. p values represent the difference between the two groups. PASAT 2′, paced auditory serial addition test (with two second interstimulus interval).
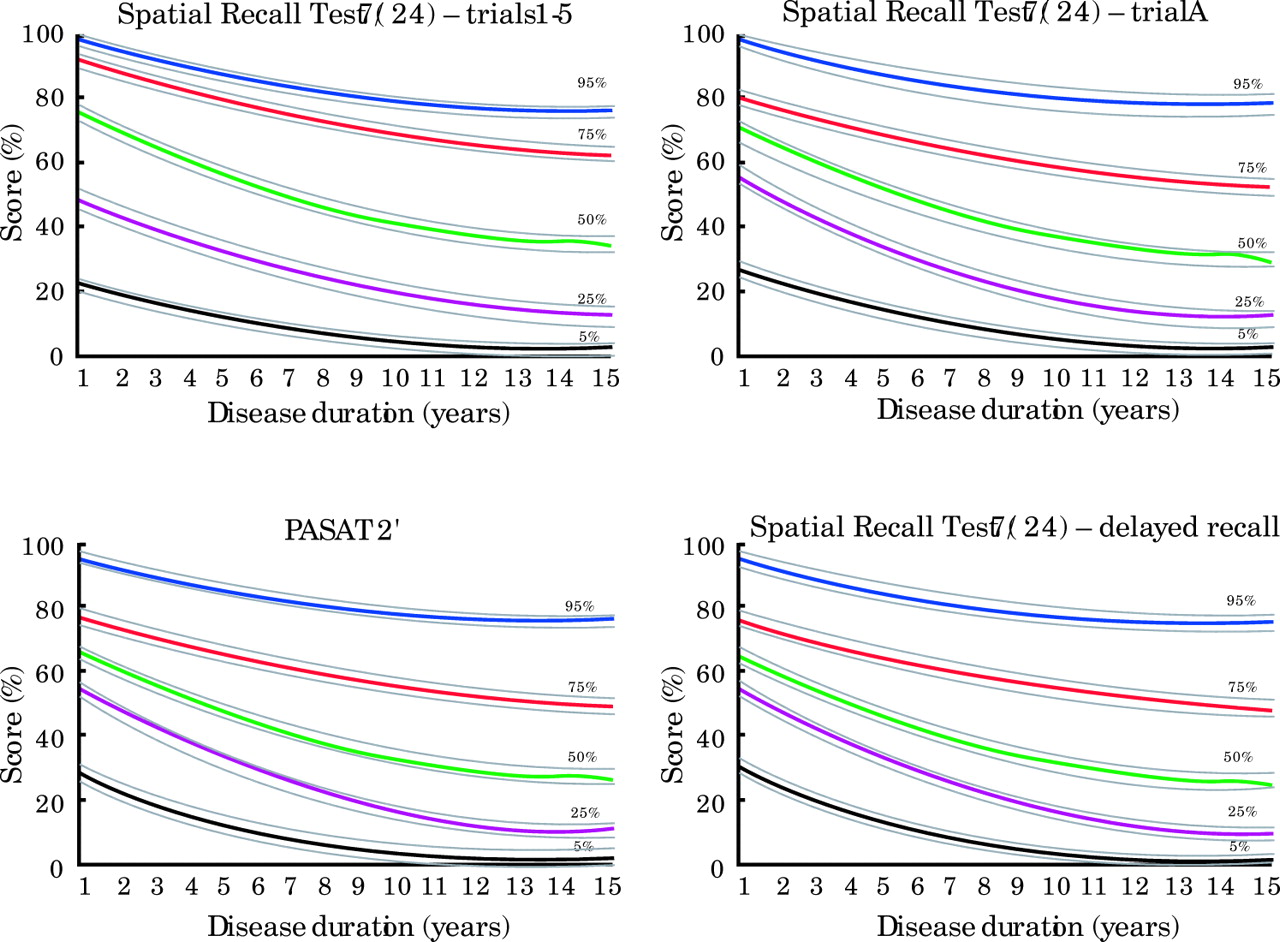
Although the data were cross-sectional and we did not assess patients longitudinally, we used the four NSBMS tests that correlated with disease duration to construct cognitive percentile curves that represent the cognitive performance within the MS population over time (fig 2).

Cognitive percentile curves of the Neuropsychological Screening Battery for Multiple Sclerosis (NSBMS) tests that correlate with disease duration. PASAT 2′, paced auditory serial addition test (with two second interstimulus interval).
The correlation coefficients and p values were as follows: rs = −0.35, p = 0.0003 for trials 1–5 of the SPART; rs = −0.29, p = 0.0023 for trial A recall; rs = −0.24, p = 0.0094 for delayed SPART, and rs = −0.38, p = 0.0004 for the PASAT 2′. Table 2 presents the results of the comparison between the cognitive curve construction group and the validation group. The values of the cognitive tests’ results (95% CI) of the two groups were statistically similar. The cognitive percentiles obtained from the cognitive curve construction group (n = 150) lay within the appropriate confidence intervals extracted from the validation group data (n = 83) for all cognitive tests. Use of the cognitive curves enabled the assessment of the relative progression of each patient as well as the percentage of patients who will reach a specific level of cognitive percentile within a defined time period. The cognitive curves demonstrate the natural history of cognitive decline in MS for each specific test. It is expected that patients will progress according to their assigned percentile over time. Patients who up-deviate from their assigned percentile could be considered as resilient, and patients who down-deviate from their assigned percentile could be considered as rapidly progressing.
Validation of the cognitive curves
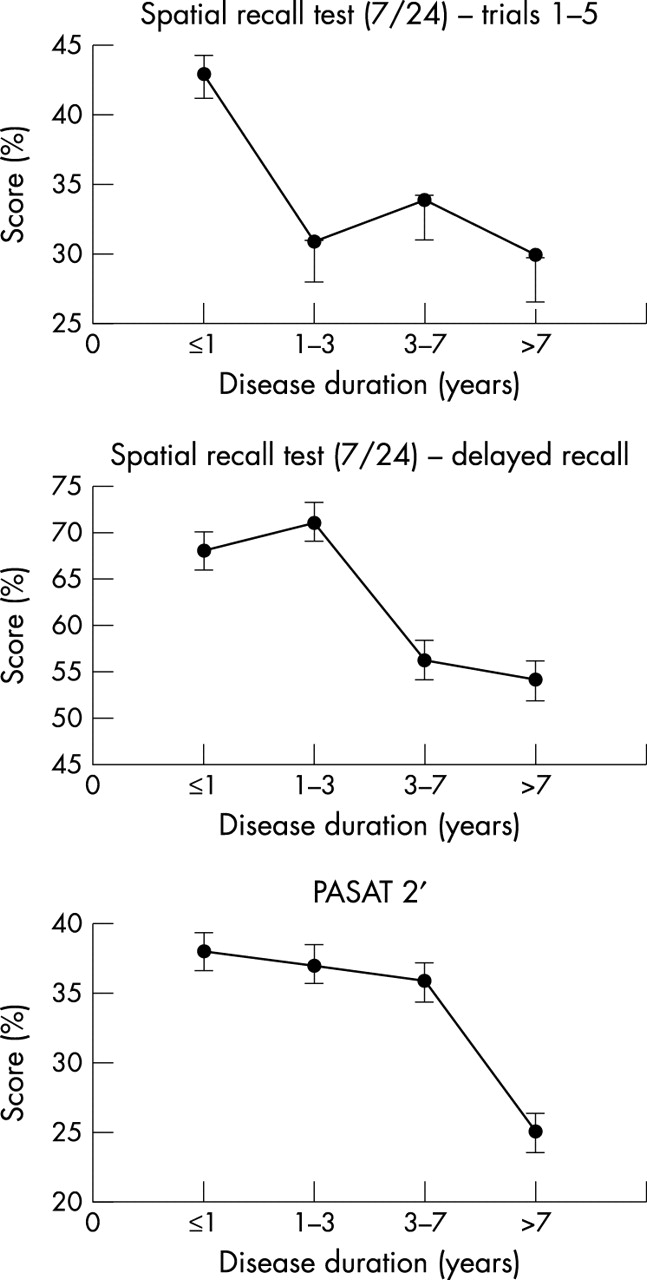
To analyse further the exact cognitive decline in MS, we evaluated the time of change in each test. The earliest impairment was demonstrated by the SPART trials 1–5, which appeared one to three years from onset, followed by decline in delayed SPART, which was evident between three and seven years of disease duration, and was followed by decline in the PASAT 2′, which emerged seven years after MS onset (fig 3).
Time related changes in cognitive decline in multiple sclerosis. PASAT 2′, paced auditory serial addition test (with two second interstimulus interval).
DISCUSSION
The results of the present study suggest that patients with MS demonstrate dynamic and differential decline in cognitive function mainly related to visual learning and recall (SPART) as well as to sustained attention, working memory, and information processing speed (PASAT 2′). Language skills (WLG) and retrieval memory (SRT) were already impaired in the first five years from onset and did not show progression within the next five years. We have previously reported cognitive decline in up to 53.7% (36/67) of patients with probable MS within the very early stage (one month) of the onset of neurological symptoms.14 Other studies32,33 have demonstrated cognitive impairment in patients after longer periods since disease onset (mean 2.2 and 6.3 years, respectively).
In the current study, we specifically evaluated the differences in cognitive performance between patients with less than five years (short term group) and those with more than five years (long term group) disease duration. We chose the five year period as an arbitrary cut-off point because we were interested in evaluating cognitive function in early MS, assuming that a period of five years is long enough to detect the existence of cognitive abnormalities. Within the first five years from onset the mean test scores ranged from the 23rd percentile in the WLG to the 68th percentile in the SPART delayed recall compared with population norms. These findings suggest, similarly to the findings of Amato et al,19 that verbal fluency (WLG) and retrieval memory (SRT) are both affected early in MS. However, in our study these tests were not correlated with disease duration, as they did not differ significantly between the short term and long term groups. At least for the WLG scores that were low since onset, a floor effect could be suggested as a possible explanation. After five years from disease onset, the patients’ cognitive performance decreased by about 10% from the mean baseline test score, (SPART trials 1–5, SPART trial A recall, delayed SPART and PASAT 2′), suggesting active decline in visuospatial learning, delayed recall, sustained attention, and information processing speed.
The ongoing decline in cognitive performance occurred in spite of the fact that more than half the patients were treated with disease modifying drugs. We were not able to perform analyses related to specific treatment effects on cognition due to variability in treatments and their duration. Even so, our findings suggest that cognitive decline is an integral part of the disease and should be evaluated in future studies specifically for each immunomodulating drug.
The cognitive function assessment in the expanded disability status scale (EDSS),34 is not sufficient to specify cognitive impairments in patients with MS and as such is often neglected. The use of the cognitive percentile curves for a specific cognitive test may help clinicians to better assess their patients’ cognitive performance and identify those who might benefit from treatment with drugs that enhance cognition. Our validation of the obtained cognitive curves in an additional group of MS patients further strengthens the case for use of these percentiles, even in a heterogeneous disease such as MS. Using multiple regression analysis, we further analysed time related changes of cognitive decline in MS and demonstrated a specific pattern. Although our study was cross-sectional in design, we were able to demonstrate that progression of impaired performance over time occurred first in total recall, which appeared one to three years from onset, followed by decline in delayed recall, which appeared between three and seven years of disease duration, and then by decline in the attention and information processing, which appeared seven years after MS onset.
Although our data are derived from a cohort population and we do not have longitudinal data for every patient, our findings still enabled us to identify patients with early cognitive decline in comparison with standardised population norms. We recommend applying the NSBMS, which was developed by Rao et al4 and became a golden standard in MS cognitive research and clinical work, in association with the percentile curves we have constructed. We think that this combined use will stimulate a new standard nomenclature to describe cognitive impairments in MS. It will also enable further assessment of patients in relation to various clinical variables (disease course, treatment) as well as comparison of neuroradiological measures—for example, brain atrophy, lesion load, or corpus callosum thickness—with the pattern and time course of cognitive decline.35 Future studies investigating relations between the cognitive patterns and the radiological patterns of demyelinating lesions, as well as evaluating the effects of different immunomodulatory drugs on the cognitive pattern and progression of the disease would be of importance.
Finally, it is worth mentioning that the cognitive curves can be used to evaluate resilient MS patients with only minor cognitive decline even after many years of disease. These patients could be of importance in future studies to identify the “resilient” factors associated with the absence of cognitive impairment that positively influence the disease course. The new technologies of gene expression microarrays that have demonstrated different signatures for relapsing versus remitting MS patients36 can also be used to evaluate patients who will develop significant cognitive decline compared with resilient patients and accordingly identify genes associated with the process.
REFERENCES
Footnotes
-
Competing interests: none declared