Article Text

Abstract
Background: On the basis of preliminary evidence from patients with subarachnoid haemorrhage (SAH), axonal degeneration is thought to be an underestimated pathological feature.
Methods: A longitudinal study in 17 patients with aneurysmal SAH. Ventricular CSF was collected daily for up to 14 days. The neurofilament heavy chainSMI35 (NfHSMI35, a biomarker for axonal damage) was quantified using a standard ELISA (upper limit of normal 0.73 ng/ml). The primary outcome measure was the Glasgow Outcome Score (GOS) at 3 months.
Results: Of 148 samples from patients with SAH, pathologically high NfH levels in the CSF were found in 78 (52.7%) samples, compared with 20 (5%) of 416 samples from the reference population (p<0.0001). A pathological increase in NfH was observed in all patients with a bad outcome (GOS 1–3) compared with 8% of those with a good outcome (GOS 4–5, p<0.0001). This increase typically became significant 7 days after the haemorrhage (p<0.01). The result was confirmed by analysing the individual mean NfH concentrations in the CSF (3.45 v 0.37 ng/ml, p<0.01), and was reinforced by the inverse correlation of NfH in the CSF with the GOS (r = −0.65, p<0.01). Severity of injury was found to be correlated to NfHSMI35 levels in the CSF (World Federation of Neurological Surgeons, r = 0.63, p<0.01 and Glasgow Coma Score, r = −0.61, p<0.01).
Conclusion: Patients with SAH thus have secondary axonal degeneration, which may adversely affect their outcome.
- GOS, Glasgow Outcome Score
- NfH, neurofilament heavy chain
- NfHSMI35, antibody SMI35 used to measure protein NfH
- NfL, neurofilament light chain
- SAH, subarachnoid haemorrhage
Statistics from Altmetric.com
- GOS, Glasgow Outcome Score
- NfH, neurofilament heavy chain
- NfHSMI35, antibody SMI35 used to measure protein NfH
- NfL, neurofilament light chain
- SAH, subarachnoid haemorrhage
The presence of axonal degeneration in patients with subarachnoid haemorrhage (SAH) has recently been suggested in a longitudinal study.1 One important finding was that damage to axons may continue after the primary injury and extend into the period of delayed cerebral ischaemia.1–4
Presence of secondary axonal degeneration in patients with SAH may be relevant to the outcome because, despite the high mortality (32–67%) during the hyperacute phase,2,5 a considerable proportion of mostly young and otherwise healthy patients has the potential for good recovery from a limited degree of primary injury. In these patients, it is well known that secondary brain damage caused by delayed cerebral ischaemia adversely affects the potential for recovery.2–4 About 50% of patients who survive do not return to their previous level of employment.6–8
In this longitudinal study, we monitored the development of axonal degeneration indirectly by measuring a biomarker for axonal degeneration (neurofilaments, reviewed by Petzold9). Firstly, we investigated whether neurofilaments would be increased early on (eg, a single peak, indicative of primary axonal injury) or rise late (eg, secondary peaks, suggestive of secondary axonal damage) in the disease course. Secondly, we tested whether the pattern of an anticipated1 increase in neurofilament levels over time would be related to the degree of recovery.
METHODS
Patients
The local ethics committee approved the study. We studied patients with SAH admitted to the neurosurgical intensive care unit at the University of Pittsburgh Medical Center. Written informed consent from the patient, or if this was impossible written assent from the next of kin, was obtained. Seventeen patients with SAH, who required ventriculostomy for drainage of CSF, were included. We have published reports on this cohort before, with regard to different biomarkers, and two of the original cases were not included because of insufficient sample volume.10,11
Table 1 shows the characteristics of the patients and the best Glasgow Coma Scale12 and the best World Federation of Neurological Surgeons scores for patients with SAH,13 recorded within 24 h of admission. The blood load on CT scan at admission was rated by a radiologist who was blinded to the other data, using the Fisher14 and the Columbia rating scales.15
Characteristics of the patients with SAH
Outcome measure
The primary clinical outcome was determined by using the GOS, assessed 3 months after SAH, and dichotomised into unfavourable recovery (1, death; 2, persistent vegetative state; 3, severe disability) or favourable recovery (4, moderate disability; 5, good recovery).16
Collection and analysis of CSF sample
The first CSF sample subjected to the analysis was collected within 48 h of onset of the haemorrhage and 24 h after insertion of an extraventricular drain. The CSF samples were coded and anonymised.
CSF was centrifuged and the supernatant stored at −80°C until analysis. Before analysis, the CSF was subjected to three freeze–thaw cycles. A protease inhibitor cocktail (product no p 2714, Sigma Chemical, UK) was added to the CSF (final concentration 1 mmol/l) after the first thaw cycle.11 In adherence to a previously proposed nomenclature, the antibody used (eg, SMI35) to measure a protein (eg, neurofilament heavy chain; NfH) will be indicated in superscript.17 NfHSMI35 levels in the CSF were analysed using a previously described ELISA technique,17 with the analyst blinded to the clinical details.
The sensitivity of ELISA was 0.2 ng/ml, with a between-batch precision of 23%. Consequently, only an increase of more than 23% from baseline in NfHSMI35 levels in the CSF was considered for the statistical analysis.
We previously measured NfHSMI35 levels in the lumbar CSF from a large reference population (n = 416) consisting of neurological patients undergoing routine lumbar puncture.17 The 95% cumulative frequency of the NfHSMI35 levels in the lumbar CSF from the reference cohort was taken as the upper reference limit, and corresponded to 0.73 ng/ml. Consistent with our previous reports,1,17 we used this upper reference limit and interpreted NfHSMI35 concentration >0.73 ng/ml in the CSF as pathologically raised. The relationship between the NfHSMI35 concentration in the lumbar CSF and that in the ventricular CSF is not known. With the spinal cord likely to be a major source owing to the high density of axons containing phosphorylated neurofilaments,17,18 NfHSMI35 levels in the lumbar CSF may be higher than in the ventricular CSF. The difference between NfHSMI35 levels in lumbar and ventricular CSF has been studied for a range of other proteins.19 Reiber19 found that the levels of some proteins in the lumbar CSF were 2.5–11-fold higher than their levels in the ventricular CSF, whereas levels of other proteins were 1.1–3.5-fold lower (see table 2 in Reiber19). The variation in these levels may depend on the anatomical location of the protein source, the flow dynamics of the CSF and properties of the proteins, such as stability, molecular size and solubility. Because the ventricular-to-lumbar (V:L) gradient of NfHSMI35 levels in the CSF from healthy controls is unknown, we carried out an additional statistical analysis on the basis of artificial cut-off values calculated from the V:L protein gradients, as described by Reiber.19
Hypothetical scenarios based on an assumed V:L gradient of the NfHSMI35 concentration
Statistical analysis
Data were analysed with SAS software. Independent variables were compared by using the non-parametric two-sample exact Wilcoxon’s rank sum test for two variables and a two-way unbalanced analysis of variance (general linear model) for more than two variables.
The longitudinal data analysis had to contend with an unbalanced design (n = 12 with favourable and n = 5 with unfavourable recovery), repeated measurements and missing samples. Different mixed linear models were therefore compared and selected on the basis of the best-fitting covariance structure.20
The linear relationship between continuous variables was evaluated by using Spearman’s correlation coefficient. The level of significance for the multiple correlations was corrected by using the Bonferroni method. The χ2-test and Fisher’s exact test were used for comparing the proportion of patients. Power calculations were carried out with UnifyPow (V.2002.08.17a) by RG O’Brien (www.bio.ri.ccf.org/UnifyPow). Two-tailed tests were used throughout and p values <0.05 were accepted as significant.
RESULTS
NfH profile in CSF from patients with SAH
Of the 148 samples from patients with SAH, 78 (52.7%) patients had pathologically increased NfHSMI35 concentrations in the CSF (0.73 ng/ml), which was more frequent than that in the published reference population17 (20 of 416 samples, 5%, χ2 = 174, p<0.0001). The significance of this finding persisted if the cut-off was adjusted for different V:L CSF protein gradients (table 2).
The longitudinal profile shows a secondary increase in NfHSMI35 levels in the CSF over time (F = 4.40, p<0.0001; fig 2). Significance was confirmed using mixed linear models (compound symmetry) for repeated measurements (F = 8.94, p<0.0001).
The re-analysis showed significant differences between day 2 (median NfHSMI35 concentration in the CSF 0.39 ng/ml) and day 7 (1.28 ng/ml), day 8 (1.94 ng/ml) and day 13 (7.05 ng/ml, p = 0.017, 0.029 and 0.0003, respectively; fig 1).

Concentrations (ng/ml) of antibody SMI35 used to measure protein NfH (NfHSMI35) in the CSF from patients with subarachnoid haemorrhage over a 14-day period, showing an increase at day 7 (see text). The means (SEM) are shown. Higher concentrations than those on day 2 are indicated as *p<0.05; **p<0.01; ***p<0.001. The dashed horizontal line indicates the cut-off level at 0.73 ng/ml.17
Primary outcome
Of the 94 samples from patients with an unfavourable recovery, 52 (57%) had NfHSMI35 levels in the CSF above the upper reference limit,17 compared with a lower incidence in those with a favourable recovery (26/94 samples, 28%, χ2 = 64, p<0.0001). The significance of this finding remained appreciable after adjusting for different V:L protein gradients (table 2). Lower cut-off levels gave a better sensitivity, but were less specific (eg, for a cut-off level of 0.066 ng/ml, sensitivity was 100% and specificity was 14%). As expected, higher cut-off levels increased the specificity while being less sensitive (eg, for a cut-off level of 2.555 ng/ml, sensitivity was 46% and specificity was 91%).
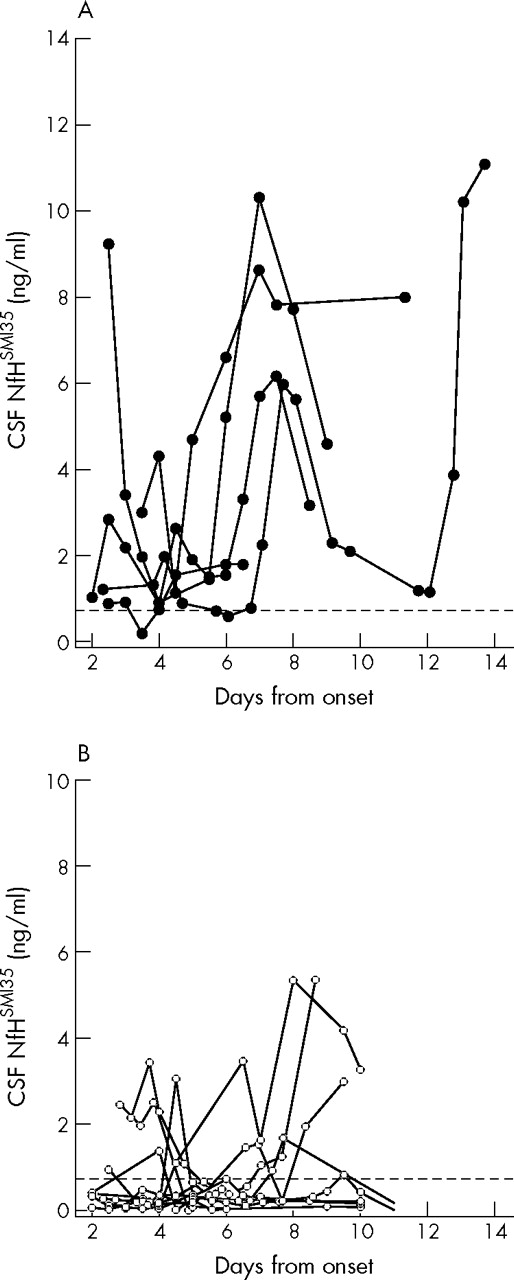
Evidence shows that the NfHSMI35 levels in the CSF from patients with a bad outcome are not only abnormally increased at onset but also show a secondary increase during the disease course in each patient (fig 2A). In contrast, patients with a favourable recovery tended to have lower levels initially, which seemed to remain in the normal range for most of the time in 75% (9/12) of cases (fig 2B).

(A) Concentrations (ng/ml) of antibody SMI35 used to measure protein NfH (NfHSMI35) in the CSF in patients with subarachnoid haemorrhage (SAH) with unfavourable recovery (Glasgow Outcome Score (GOS) 1–3) over 14 days with respect to the exact daily sampling time. Two CSF samples were taken each day on many occasions, showing only small within-day fluctuations. (B) NfHSMI35 concentrations (ng/ml) in the CSF in patients with SAH with favourable recovery (GOS 4–5). The dashed horizontal line indicates the cut-off level at 0.73 ng/ml.17
NfH levels in the CSF increase in patients with unfavourable recovery
To show the difference of the relative change of NfHSMI35 levels in the CSF from patients between these two groups, we calculated the individual mean NfHSMI35 levels in the CSF before and after the risk period for vasospasm (day 4). Figure 3 shows that NfHSMI35 levels in the CSF increased in 5 (100%) patients with unfavourable recovery compared with those with favourable recovery (1/12, 8%, p<0.0001, Fisher’s exact test). Moreover, the increase in NfHSMI35 levels in the CSF from patients with unfavourable recovery was within the pathological range in all cases. As expected from the longitudinal NfHSMI35 profile in the CSF shown in figs 2A and B, the relevance of this analysis was not influenced when days 3 or 5 were chosen instead of day 4.

A pathological increase (>0.73 ng/ml) in individual concentrations (ng/ml) of antibody SMI35 used to measure protein NfH (NfHSMI35) in the CSF was observed in 8% (1/12; open circles, black lines) of patients with a good outcome and in all (5/5; closed circles, black lines) patients with a bad outcome (p<0.0001, Fisher’s exact test). The dashed horizontal line indicates the cut-off level at 0.73 ng/ml.17
NfH levels in the CSF are highest in patients with unfavourable recovery
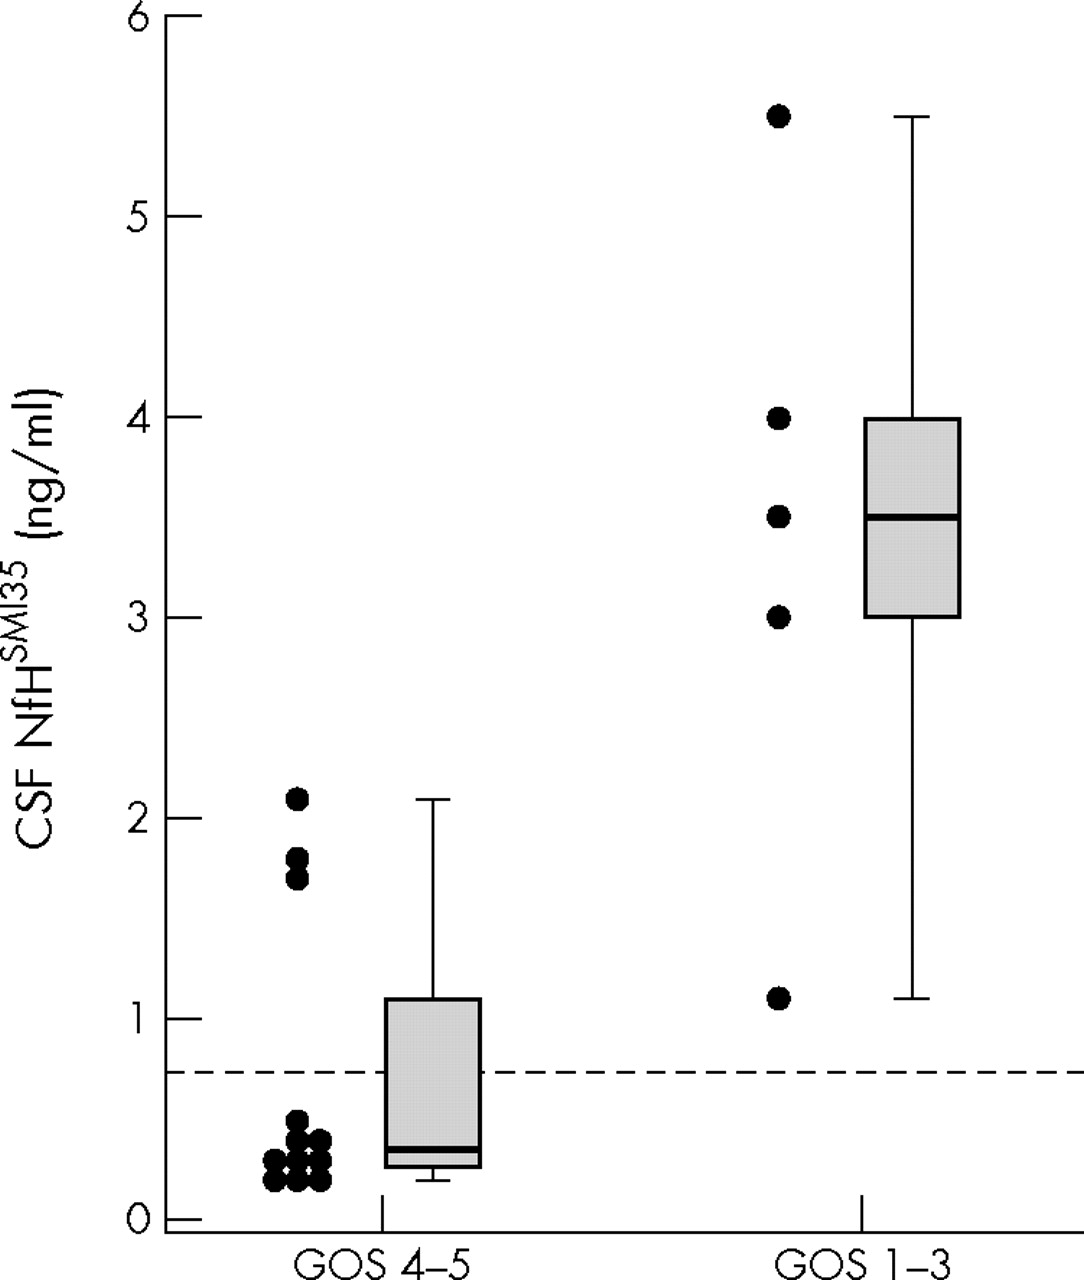
Generally, patients with a bad outcome had NfHSMI35 levels in the CSF 9.3-fold (median of individual means 3.45 ng/ml) higher than those with a good outcome (0.37 ng/ml, p = 0.0097; fig 4). Inevitably, this form of analysis reduced the number of observations to the number of patients. We therefore checked the result on a categorical level using Fisher’s exact test. All (5/5) patients with a bad outcome had NfHSMI35 levels in the CSF above the upper reference limit, whereas only 25% (3/12) with a favourable outcome had abnormally increased NfHSMI35 levels in the CSF (p = 0.025; fig 4). This result was reinforced by the inverse correlation between the individual mean NfHSMI35 levels in the CSF and the GOS at 3 months (r = −0.65, p = 0.004).

Mean concentrations of (ng/ml) of antibody SMI35 used to measure protein NfH (NfHSMI35) in the CSF from patients with subarachnoid haemorrhage, with a good versus bad outcome. Each dot represents the mean value per patient derived from the entire observation period. The median, 25–75% box and 0–100% whisker box are shown. The dashed horizontal line indicates the cut-off level at 0.73 ng/ml.17
Optimising the sampling time for detecting axonal damage
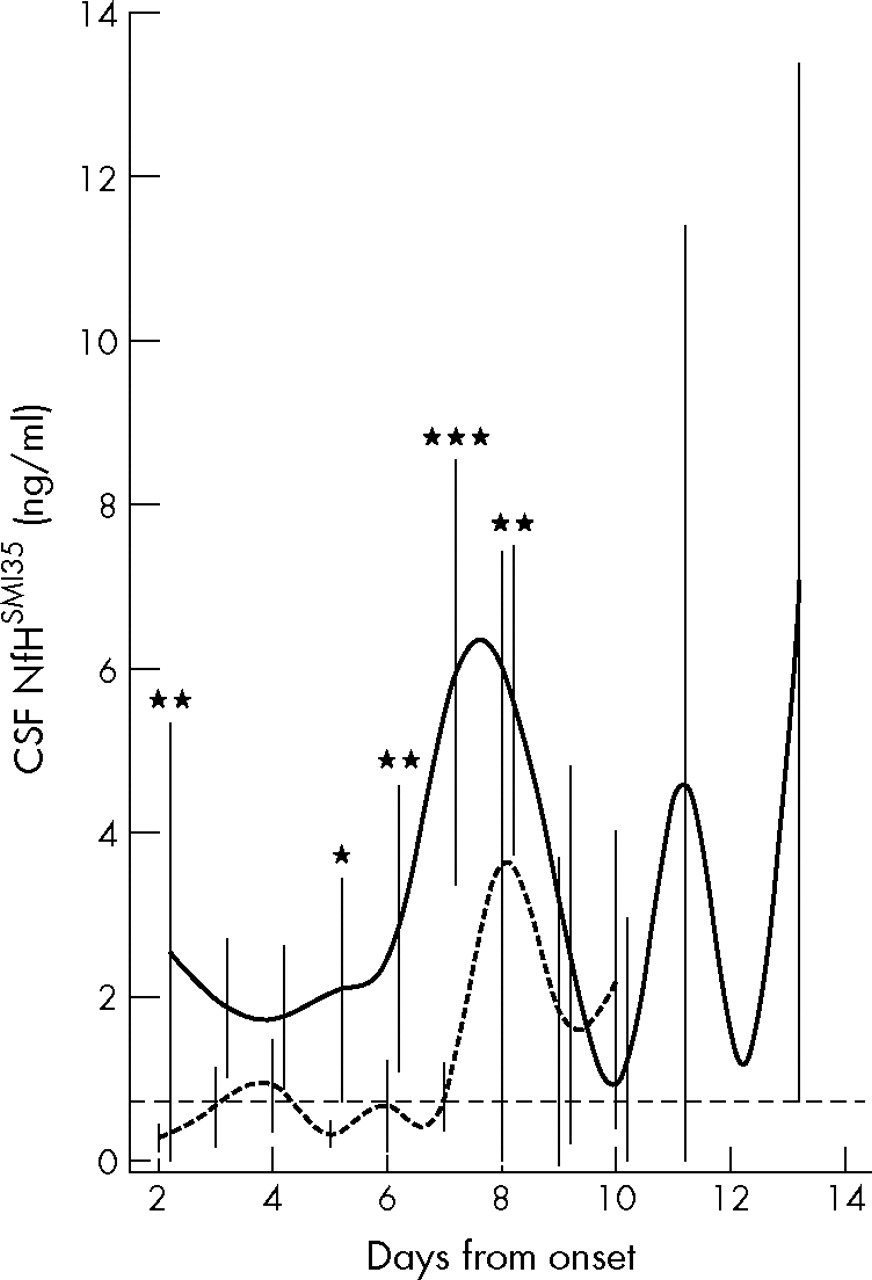
We extended our longitudinal data analysis because it would be relevant for future studies to have selected for sampling of CSF those days most likely to show a meaningful difference between patients with favourable outcome and those with an unfavourable outcome. Figure 5 shows the pooled data for both groups. We found a significant difference in the NfHSMI35 profile in the CSF over time between the two groups (general linear model, F = 8.00, p<0.0001). This result was not influenced by the repeated measurements if time was taken as a fixed effect (mixed linear models, compound symmetry, F = 4.28, p = 0.0002). We therefore proceeded to the re-analysis in an attempt to identify the most relevant days separating the two groups. The re-analysis showed that NfHSMI35 levels in the CSF were considerably higher in patients with a bad outcome on day 2 (1.23 v 0.23 ng/ml; p = 0.002), day 5 (1.51 v 0.28 ng/ml; p = 0.042), day 6 (1.80 v 0.35 ng/ml; p = 0.007), day 7 (6.17 v 0.55 ng/ml; p<0.0001) and day 8 (5.81 v 1.23 ng/ml; p = 0.002).

Daily concentrations (ng/ml) of antibody SMI35 used to measure protein NfH (NfHSMI35) in the CSF from patients with subarachnoid haemorrhage, with bad (continuous line) versus good (dotted line) outcome. The means (SEM) are shown in the graph the text refers to the median values. Differences between the curves are indicated as *p<0.05; ***p<0.001. The dashed horizontal line indicates the cut-off level at 0.73 ng/ml.17
NfHSMI35 levels in the CSF correlate with severity of injury
Previously, we reported a correlation between CSF biomarkers and severity of injury.10,11 Such a correlation was also found in this study for the NfH levels in the CSF and the severity of the injury as assessed by the World Federation of Neurological Surgeons (r = 0.63, p = 0.006) and the Glasgow Coma Scale (r = −0.61, p = 0.009).
DISCUSSION
This study provides evidence that NfHSMI35 levels in the CSF rise within 7 days after SAH, suggesting the development of axonal degeneration in these patients. This is important because loss of central white matter axons determines, at an anatomical level, the extent of a likely irreversible neurological deficit in a patient. The consequences on a personal as well as socioeconomic level cannot be overestimated.
Primary outcome
The working hypothesis that axonal degeneration may be related to the degree of recovery is backed up by the finding that patients with SAH having a bad functional recovery (GOS 1–3) have NfHSMI35 levels about nine-fold higher than those who do better (GOS 4–5). The NfHSMI35 levels in the CSF from patients with an unfavourable recovery (3.3 ng/ml) are comparable to those from our previous reports (3.4 ng/ml, table 2 in Petzold et al;1 and 3.2 ng/ml, calculated from fig 8 in Petzold et al17). One group investigated the neurofilament light chain (NfL, using clone DA2 from Zymed, San Francisco, California, USA) instead of the heavy chain (NfH) and found median NfL concentrations of 67.0 ng/l in the CSF of 13 patients with SAH of age comparable to that of our study cohort (30–65 years, see fig 3B in Van Geel et al21). NfL levels in lumbar CSF were 7.8-fold higher than those of the control group (median NfL in the CSF, 8.5 ng/l). This difference is comparable to our results on ventricular CSF, sampled 13 days after the bleed.
We focused on NfHSMI35 rather than NfL because NfL is unstable.21–23 NfHSMI35 is more stable because phosphorylation of the protein protects against protease activity.24,25 Proteolytic breakdown of the neurofilament and subsequent axonal disintegration after an ischaemic insult has been shown experimentally.26 Stys and Jiang26 showed that this could be prevented either by specifically blocking the CNS isoform of calpain I and calpain II or by blocking calcium influx into the axon. This may be of biological importance, as discussed below.
The proportion of patients with unfavourable recovery (31%) is higher than expected from population-based studies (see table 3 in Hop et al27), but it has to be remembered that all of our patients had secondary hydrocephalus, which in itself adversely affects outcome.28 Clinical outcome studies showed a residual neurological and neuropsychological deficit in 17–40% of patients with SAH.3,29,30 More subtle deficits in the long-term physical, neurocognitive, psychiatric and psychological outcome are being increasingly recognised.31–34 In future studies, it would be important to test whether patients who gain independence (GOS 4–5) but have abnormally high NfHSMI35 or NfL levels perform less well in these areas.
The fluctuations observed in NfHSMI35 levels in the CSF after day 8 in this study are explained by the two patients with unfavourable recovery, who mainly contributed to these time points. The extraventricular drain was removed earlier in patients with a favourable outcome. We do not believe that this introduced a bias for the working hypothesis, as the primary reason for early removal of the extraventricular drain was influenced by the clinical improvement in the patient, with a subsequently better outcome. We would expect that in these patients, NfHSMI35 values in the CSF would continue to decrease.
Severity of injury
We found a correlation between severity of injury (World Federation of Neurological Surgeons and Glasgow Coma Scale) and NfHSMI35 levels in the CSF. This is in line with our previous observations that peak levels of other biomarkers (S100B, τ protein, apolipoprotein E) correlated with the Glasgow Coma Scale.10,11 Whereas no comparable data exist for NfHSMI35 levels in the CSF, the literature on S100B is extensive.35–43 The assumption that the extent of the initial damage to the brain is reflected both in the clinical score and in the degree of cellular disintegration, with release of cell-type-specific proteins used as biomarkers, seems reasonable.
Limitations of the study
A limitation of this study is that longitudinal sampling of the CSF with up to two samples each day was possible only by including patients who required extraventricular drainage for hydrocephalus. This introduced a selection bias. We have not specifically investigated NfHSMI35 levels in the CSF in a large cohort of patients with hydrocephalus. In a previous study, we included six patients with benign intracranial hypertension as controls.1 The NfHSMI35 values in the CSF from these six patients with benign intracranial hypertension were all within the normal range (0–0.25 ng/ml). Given that the maximal increase described in proteins in the lumbar-to-ventricular CSF was 1:3.5 (for S100B19), we assume that the NfHSMI35 levels in the ventricular CSF from patients with benign intracranial hypertension may not be significantly increased. We do not know whether this is true for other types of hydrocephalus. We cannot exclude the possibility that the presence of hydrocephalus or the presence of the extraventricular drain catheter itself did influence the NfHSMI35 levels in the CSF. This is an important issue that will need to be dealt with in future studies because of its potential implications in the management of the disease. This does not permit the generalisation of the findings to all patients with SAH.
Another limitation of this study is that the documentation of the clinical or CT scan evidence for delayed cerebral ischaemia was not standardised and was not rigorous. Also, transcranial Doppler examinations were not carried out systematically and our data were not strong enough to investigate a possible temporal relationship between occurrence of proximal vasospasm and the development of delayed cerebral ischaemia and change in NfHSMI35 levels in the CSF. Furthermore, no validated techniques allowing for easy and continuous assessment of distal vasospasm are currently available. Distal vasospasm may be under-recognised. As distal vasospasm is diffuse and affects a large region of the cortex, it may emerge as an important complication of SAH. New methods, such as measurement of cerebral tissue oxygenation, near-infrared spectroscopy and microdialysis, may allow these questions to be dealt with in future studies.
For ethical reasons, our study did not include ventricular CSF from healthy controls. The lumbar CSF samples from our previously published reference population were anonymised, preventing us from obtaining any more details from these patients with regard to the clinical diagnosis and evolution (fig 7 in Petzold et al17). From this population, we calculated an upper reference limit of 0.73 ng/ml for NfHSMI35 concentration in the lumbar CSF. As the reference population contained patients with neurological problems rather than healthy controls, this upper reference limit has to be regarded as conservative and may be higher than an upper reference limit established from the lumbar CSF from healthy controls. Having established a reference limit, we then proceeded to quantify NfHSMI35 levels in the CSF from a second cohort of patients with neurological problems such as cluster headache, amyotrophic lateral sclerosis, demyelinating disease, disc prolapse, space-occupying lesion, Guillain–Barré syndrome and SAH (fig 8 in Petzold et al17). All patients with SAH had pathologically increased NfHSMI35 levels in the ventricular CSF, a finding that was later confirmed for NfL levels in the lumbar CSF by van Geel et al.21
The sample size of this study is small, which influences the statistical power. On the basis of the results of the overall mean NfHSMI35 levels in the CSF, a future study would need to recruit 34 patients with SAH with a bad outcome and 17 patients with a good outcome to obtain a minimal power of 0.9 with a two-sided α of 0.01.
Mechanisms of secondary axonal degeneration
Because secondary axonal degeneration in SAH takes place while the patient is in hospital, it may be amenable to treatment. Importantly, the mechanisms of axonal degeneration likely to be responsible have been studied in great detail over the past decade (for a recent review, see Stys44 and references therein). It is therefore intriguing to reflect on the possible mechanism of action of the calcium antagonist nimodipine (60 mg every 4 h), the only drug with evidence for improving the outcome in SAH.4 The experimental data suggest that nimodipine may act directly on the axon by preventing Ca2+ release from intracellular storage by blocking the ryanodine receptors and thereby reducing axonal degeneration.44,45 As the proteolytic breakdown of neurofilament after an ischaemic insult is mediated by calcium,26 NfHSMI35 levels in the CSF may be a valuable biomarker for early detection of both primary axonal injury and secondary axonal damage. Whereas primary axonal injury may be directly related to an ischaemic insult during the initial bleed, multiple factors may be responsible for secondary axonal damage. The longitudinal measurement of NfHSMI35 levels, along with other biomarkers such as NfL,21 glial fibrillary acidic protein,46 S100B,35–43 τ protein10 and probably many others, may be used in future studies to investigate possible relationships with metabolic, infectious, toxic or nutritional complications. All these need to be considered along with the most likely cause, ischaemia.
CONCLUSION
Our findings suggest that in the future, NfHSMI35 levels in the CSF may be a valuable biomarker and a surrogate outcome measure for neuroprotective treatment trials on patients with SAH. Future studies aiming to avoid a selection bias of patients with hydrocephalus would need to rely on a lumbar puncture. Serial lumbar punctures are difficult to obtain. Our longitudinal data analysis suggest that two lumbar punctures, taken on days 2 and 7, may provide the most relevant information for detecting the onset of secondary axonal damage. Samples taken later will probably show even higher NfH levels in the CSF as axonal degeneration continues. Targeted NfHSMI35 levels in the CSF should be combined with estimation of NfHSMI35 concentration from blood.18,47
Acknowledgments
We thank Ms Donna Grant for help with some of the ELISAs.
REFERENCES
Footnotes
-
Funding: Data collected at the University of Pittsburgh Medical Center were supported in part by a project funded by the NIH NINR R01NR0433.
-
Competing interests: None declared.