Article Text

Abstract
Background and aim: Epidemiological studies of multiple sclerosis suggest a trend of increasing disease prevalence in susceptible populations. The reasons for this are unclear and may be the results of methodological differences between studies, incomplete ascertainment or advances in technologies that allow the increased identification of early or mild disease. In addition, direct comparison of cross sectional prevalence estimates performed in different epochs in ethnically and geographically distinct populations may be inappropriate.
Methods: Using detailed phenotypic information and standardised methodology, a geographically defined Welsh population was resurveyed after a significant interval, establishing contemporary prevalence rates and examining demographic and clinical data to determine causes of changing disease frequency.
Results: Disease prevalence increased 45% from 101 to 146 per 100 000 population over 20 years. The greatest increase was observed in women between the ages of 45 and 54 years. No significant increase in disease frequency was observed in the male population overall, or within specific age groups. There was no demographic evidence for a pattern of earlier age at onset or diagnosis to explain increased disease frequency or decrease in mean age of the prevalent population. In addition, we failed to identify a pattern of recognition of patients with less severe disability. Although there was a modest 13% increase of 2.2 years in mean disease duration, and eight new previously prevalent patients were identified, the main cause of rising disease frequency was related to a 2.8-fold increase in disease incidence for women over 23 years from 2.65 to 7.30/100 000/year increasing the sex ratio of incident patients from 1.8 to 4.3 (women:men).
Conclusion: Recent change in disease incidence and prevalence in this population is likely to be the result of environmental factors that have been operative in the past few decades in women alone and infers avoidable risk factors. Modelling of current overall incidence suggests a further increase in prevalence to 260 per 100 000 population within the next 20–40 years. Further studies are needed in order to identify recent changes in sex specific environment and lifestyle that confer susceptibility.
Statistics from Altmetric.com
Epidemiological studies of multiple sclerosis (MS) are an important source of information for development and allocation of health care resources. They can also be of value in identifying changes in disease characteristics over time and may allow the identification of a representative unselected epidemiological sample from which disease phenotype can be analysed and the natural history of the disease documented. As a result, numerous cross sectional prevalence analyses have been performed throughout the world with widely variable results commonly explained by ethnic differences in disease susceptibility and/or exposure to differing, and as yet unidentified, environmental factors. However, the accuracy and completeness of studies such as these are often difficult to analyse as well as their relevance for future resource planning. Furthermore, in the few areas where serial prevalence analyses have taken place, disease frequency has rarely been stable and a consistent rise in patient numbers is more commonly observed over time. The reasons for this are unclear and the relative contribution of incomplete ascertainment, rising incidence, increasing disease duration, differing application of diagnostic criteria, availability of health care technologies and changing characteristics of the at risk population is largely unclear. Accurate assessment of these factors can only be achieved over a significant time interval in stable populations of sufficient size, which are re-examined at intervals employing standardised methodology.
Furthermore, disease phenotype may also be unstable over time so that employing cross sectional epidemiological data may not accurately predict future clinical needs of the affected population. Temporal patterns of changing disease expression have previously been documented in Asian populations with decreasing optico-spinal presentation and increasing classical MS phenotype,1 2 as well as more recently changing sex ratios over a period of 50 years in a North American cohort.3 These observed changes are unlikely to have an isolated genetic aetiology but are more likely to be related to changing environmental factors. To date, no such analysis of changing phenotype in Caucasian, Northern European populations has been undertaken and simple comparison of disease expression in geographically and temporally distinct populations is problematic. However, serial analysis of stable populations over significant time intervals will allow effective comparison if detailed phenotypic data are available.
The UK lies in a region of high prevalence and has recorded one of the highest disease frequencies in the world at 258 per 100 000 population4 but with most epidemiological studies of virgin populations reporting rates of between 845 and 203 per 100 000 population.6 A few regions have been subject to reanalysis and have also demonstrated sequential rises in prevalence but are commonly performed after an interval that is too short to allow detailed analysis of clinical and demographic changes over time.5 7–12
In this study, we have examined the results of serial epidemiological analysis in a stable population in South East Wales over a period of 20 years between 1985 and 2005. Following a similar methodology, we have documented changes in disease frequency and analysed demographic and clinical characteristics to determine the relative contribution of factors which may lead to rising disease frequency as well as analysing clinical changes in disease expression.
METHODS
Study area
Cardiff unitary authority is in South East Wales and lies at a latitude of 51° 30′ 0 N and a longitude of 3° 12′ 0 W and covers an area of 13 900 hectares. It comprises the district of Cardiff in the east of South Glamorgan as well as, in the north west, a small part of the district of Taff-Ely in Mid Glamorgan. Cardiff is bordered to the west by the rural district of the Vale of Glamorgan, to the east by the city of Newport, to the north by the South Wales Valleys and to the south by the Severn estuary and Bristol Channel. The Vale of Glamorgan is Wales’ most southern unitary authority. It lies immediately west of Cardiff and covers 33 700 hectares. Specific study area was determined using post codes. Following the initial study performed in 1985, prevalence day for reanalysis was set as 1 January 2005.
Study population
Population estimates for the study area, derived from census data, have increased by 13% from 376 718 in 1985 to 424 633 in 2001, representing the most recent available estimate. The region is currently served by 71 general practices (GP). The University Hospital of Wales, situated in the city of Cardiff, has been the major tertiary referral centre for neurology in Wales since 1976 as well as serving a local population of approximately 1.3 million. Census data from this population suggest that the ethnic mix of the resident population between 1981 and 2001 has remained relatively stable, rising from 4.4% to 6.7%. The number of residents born in Wales fell from 81.3% to 75.2% over the same period with the difference being almost entirely composed of inward migration from English born residents.
Case ascertainment
Efforts were made wherever possible to follow similar methodology and data collection employed in 1985.12 As a result, five main ascertainment sources were utilised which included GP notifications, hospital episode statistics, consultant neurologists and the 1985 prevalence study as well as a large departmental database. The principle difference with the original study was the omission of two sources comprising the MS society and community nurses and physiotherapists since in the 1985 study no patient was solely identified from the latter source and only one from the former.
GPs in Cardiff and the Vales of Glamorgan were invited to participate by letter and telephone: 63/71 (89%) GP surgeries agreed to take part in the study. Cases were identified in the majority of practices from computerised records by coded databases. A list of all inpatient episodes coded with the term MS was obtained for all hospitals within the Cardiff and Vale NHS. Consultant neurologists were asked to notify any patients in their care with a diagnosis of MS. A list of patients as well as detailed clinical and demographic data were available from the 1985 study.12 In addition to departmental records, a dedicated MS database has been kept prospectively of all patients seen by the department of neurology since 1999 and also includes data from 1985.
A provisional list of cases was obtained from the sources outlined above. Confirmation of residence and whether the patient was alive on the prevalence day were obtained by checking patients against the NHS Administrative Register.13 Patients who had moved out of the study area or had died prior to the prevalence day were excluded. The Poser diagnostic criteria14 were used to classify patients in order to allow for effective comparison with prior studies together with the McDonald criteria.15 An additional category of “classification unknown” was included as in other published studies, including the 1985 prevalence study.12 This group included patients in whom a diagnosis of MS had been made by a neurologist but details were not available in the hospital notes in order to place them firmly into a single diagnostic category. Incidence data were derived from analysis of the departmental database representing the sum data from all sources listed above and containing details of more than 2200 patients. Incident patients were defined by year of diagnosis and residence within the study area.
Data collection
Data were collected by a member of the study team and updated for all prevalent patients within the departmental database. Core clinical information within this database includes date and clinical features at disease onset, date of diagnosis, features of subsequent relapses, paraclinical investigations, sex, date of birth, address, general practitioner and family history. Minimum data sets for each additional visit include date seen, relapse status, disease course, Expanded Disability Status Scale (EDSS) measurement and relapses since last review, and this information allows effective comparison with similar raw data from the 1985 study. Approximately 1000 patient contacts for the regional population with MS are documented annually. Diagnosis was in each case determined by a consultant neurologist as had also been the case in 1985. For the 8.9% of patients diagnosed by a consultant neurologist outside of the regional service, previous and current hospital records were reviewed by a member of the study team (NR, CH, GI, TP). Local hospital and/or general practice records were also examined for each patient and a diagnosis confirmed retrospectively and clinical information updated.
Statistical methods
Ninety-five per cent confidence intervals (CI) were calculated for prevalence and incidence using Wilson’s method.16 Spearman’s correlation was used to examine the correlation between year and incidence of MS. Clinical features, including mean age at disease onset, mean age at diagnosis and at the prevalence day, and disease duration at the prevalence day were compared using t tests. The proportion of men and women with disease in 1985 and 2005 as well as the proportion of patients presenting with weakness, sensory disturbance, ataxia, brainstem and sphincter dysfunction and optic neuritis were compared using the χ2 test.
RESULTS
Case ascertainment
The commonest source of ascertainment was general practice records, which detected 455 (73.4%) prevalent cases. An existing MS hospital database identified 382 (61.6%), consultant neurologists identified a further 71 (11.5%), hospital coding statistics identified 236 (38.1%) and prior epidemiological studies detected 130 (21.0%) cases. As a sole source of referral, 55 (8.9%) were identified only from an existing MS hospital database, 84 (13.5%) only from general practice records, 11 (1.8%) only from consultant neurologists, 14 (2.3%) only from hospital coding statistics and 21 (3.4%) solely from a prior local epidemiological survey. In comparison with the 1985 study, the main source of ascertainment was the departmental index, identifying 95%, hospital coding statistics identified 61%, GPs 77%, MS society 19% and community nurses 3.6%.
Prevalence
A total of 620 patients were identified with MS according to Poser criteria, providing a prevalence of 620/424 633 or 146.0/100 000 (95% CI 135.0 to 158.0). Twenty-two (3.5%) patients were from non-Caucasian ethnic minority groups. Standardisation to the 1985 population structure reduced this value slightly to 144.6/100 000 (95% CI 133.6 to 156.5). A total of 515 (83.1%) had clinically definite MS, 31 (5.0%) had laboratory supported definite MS, 64 (10.3%) had clinically probable MS, two (0.3%) had laboratory supported probable MS and eight (1.3%) patients were unable to be classified accurately because of lack of information. The prevalence of those with clinically or laboratory supported definite disease was 546/424 633 or 128.6/100 000 (95% CI 118.2 to 139.8). Application of McDonald criteria resulted in no change in overall prevalence: (92.1%) patients had “MS”, 41 (6.6%) had possible MS and eight (1.3%) were unclassifiable.
The highest prevalence was observed in those aged between 55 and 64 years with a prevalence of 319.9 (95% CI 269.1 to 380.2). Table 1 details age and sex related prevalence rates. The highest prevalence of 445.7 (95% CI 372.9 to 532.6) was found in women between the ages of 45 and 54 years. In men, the highest prevalence of 234.8 (95% CI 176.1 to 313.0) was in the age group 55 to 64 years. The overall prevalence in women was 198.2 (95% CI 180.5 to 217.6) and in men 89.1 (95% CI 77.0 to 103.1).
Clinical features
Mean age of the patients was 50.8 years (SD 14.4, range 18–90). Mean delay from disease onset to diagnosis was 5.03 years and mean disease duration was 18.96 years from disease onset (SD 12.81, range 0.59–61.0).
Details of timing and site of disease onset were known in 573 (92.4%) of the cases. Mean age at onset was 31.4 years (SD 11.2, range 8.7–72.2). There were 439 women and 181 men, providing a sex ratio of 2.4:1 (women:men). A total of 529 cases (92.3%) had a relapsing disease course and 44 (7.7%) progressive onset disease, and 491 (79.2%) patients had disability data recorded within 1 year of the prevalence day. Mean EDSS was 5.2 (median 6.0). One hundred and thirty-three (27.1%) had mild disability (EDSS ⩽3), 101 (20.6%) had moderate disability but were still mobile without support (EDSS 3.5–5.5), 155 (31.6%) were still ambulatory but required assistance to mobilise (EDSS 6.0–7.5) and 102 (20.8%) were chair bound or more severely disabled (EDSS ⩾8).
Incidence
A total of 582 incident (152 men, 430 women) patients were identified over 23 years. Figure 1 illustrates the incidence per 100 000 per year of MS each year for all cases, and for men and women between 1985 and 2007. Overall incidence ranged from 4.25 (95% CI 2.6 to 6.9) per 100 000 population per year in 1985 to 9.65 (95% CI 7.1 to 13.1) per 100 000 in 2007 with a significant increase over time (r = 0.93, p⩽0.0001). Incidence in men was stable over the period of study, ranging between 1.03 and 2.5 per 100 000 (r = 0.33, p = 0.13) but the incidence in women significantly increased gradually from 2.65 (95% CI 1.4 to 4.9) in 1985 to 7.30 (95% CI 5.1 to 10.4) in 2007 (r = 0.93, p<0.0001). The sex ratio of incidence patients also rose gradually from 1.8:1 (women:men) between 1985 and 1987 to 4.3:1 (women:men) between 2005 and 2007. Mean incidence over the 23 years was 6.31 (men 1.65, women 4.66) per 100 000.
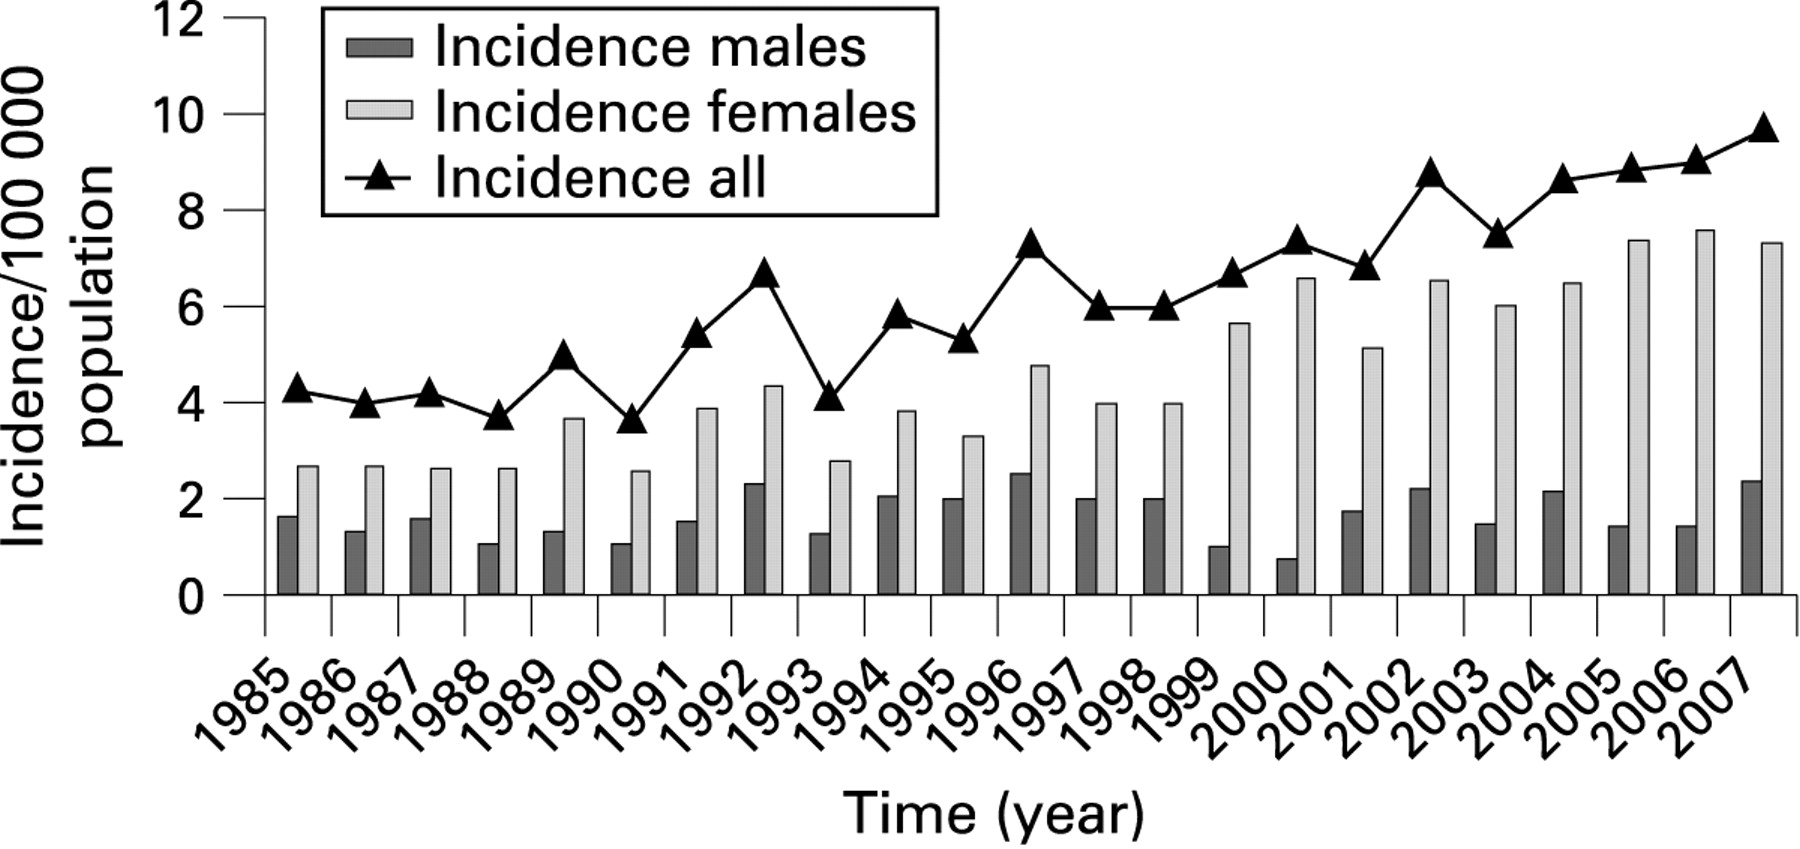
Annual incidence of multiple sclerosis (MS) in Cardiff and the Vale from 1985 to 2005 in all cases and in men and women.
Demographic changes over time
Table 1 illustrates age and sex specific prevalence rates for 1985 and 2005 for definite and probable MS, demonstrating a significant change in disease frequency, increasing by 45% over 20 years from 101 to 146 per 100 000. This change was most marked in women within the 45–64 year age groups. No significant increase in frequency was observed in the male population overall or within specific age groups. Patients from ethnic minority groups rose slightly from 1.7% to 3.5%, reflecting the change in the background population. There was no demographic evidence of a pattern of earlier diagnosis to explain increased disease frequency (fig 2) and no significant difference in mean age at disease onset, mean age at diagnosis or mean age at the prevalence day (table 2). In addition, we failed to identify a contemporary pattern of identification of patients with less severe disability; 295 (77.4%) patients in 1985 and 491 (79.2%) patients in 2005 had disability data recorded within 1 year of the prevalence day. The distribution of disability scores is shown in table 3. There was no significant difference in the proportion of patients in each of the groups from 1985 and 2005 (p = 0.14). There was also no evidence of an increased frequency of patients in less secure diagnostic categories using the Poser criteria although there was a small decrease in the number of patients with classification unknown (5.5% vs 1.3%). However, there was a modest increase of 2.2 years in mean disease duration from 16.8 to 19.0 years (p = 0.006).

Age at disease onset distribution of prevalent patients in the 1985 cohort (A) and the 2005 cohort (B).
DISCUSSION
In this epidemiological reanalysis of a Welsh population, we have demonstrated a significant rise in prevalence from 101/105 (95% CI 91 to 112) for definite and probable disease to 146/105 (95% CI 135 to 158) over a period of 20 years. While it is not unusual to observe increased disease frequency in subsequent surveys, the reasons for this have rarely been examined in depth and the time intervals between surveys or the patient numbers have often been too small to derive detailed conclusions.4 17 18 In this study, we have examined the role of a number of demographic issues that might contribute to rising disease frequency and concluded that the most relevant factor in this population has been an increase in disease incidence which has solely been operative in women.
Improved case ascertainment is frequently cited as an important cause of apparent increases in prevalence as a result of improving medical informatics technology. All GPs involved in this study used computerised records with patient specific disease being coded and easily searchable. In contrast, surveys undertaken prior to the use of coded computerised records largely relied on GPs recalling patients under their care with MS and therefore may have underestimated the true number of patients. However, in the subsequent monitoring of our population, only eight patients (1.8%) were identified that had previously been prevalent in 1985 and missed in the initial survey, making it an unlikely cause of changing prevalence. Alternatively, changing demographics of the background population and groups at risk of developing disease can contribute to changes in disease frequency. However, the Welsh population appears relatively stable with no great change in place of birth of residents in the study area between 1981 and 2001 according to census data. The main change has been a slight increase in ethnic minority groups from 4.4% to 6.7% but this is only likely to have had the effect of diluting the increase in disease frequency in the Caucasian population. Appropriate statistical corrections were made for minor changes in age group structure.
A further factor that may influence disease frequency is application of differing diagnostic criteria. Only one other study in the UK examining a population in Plymouth, Devon19 has sought to compare the more recent McDonald diagnostic criteria, which endeavour to integrate MRI findings and make diagnosis of primary progressive MS more secure, with the more traditionally applied Poser criteria. Although this study observed a lower overall proportion of patients with clinically definite MS according to Poser criteria and a lower proportion of patients classified as “MS” with McDonald criteria in comparison with the Plymouth study, there was no significant impact on overall prevalence. In our study, we found the same number of patients with MS regardless of the criteria used but using the McDonald criteria a greater proportion of patients had definite disease. This suggests that while application of the McDonald criteria has the effect of elevating patients to a more secure diagnostic classification, the variable application of the more contemporary diagnostic criteria is unlikely to have an impact on overall disease frequency. However, it may also be the case that modern diagnostic criteria would enable a diagnosis to be confirmed in patients with neuroinflammatory disease which would not previously have been recognised, even as suspected disease. It is difficult to disprove this as a potential confounding factor but the stable distribution of disability would seem to make this unlikely.
We also sought to examine demographic trends which may have impacted on disease frequency. No significant change in mean age at disease onset and, more importantly, mean age at diagnosis after an interval of 20 years was identified between the two prevalent cohorts in our study nor was the proportion of patients identified with mild, moderate and severe disability. This would seem to argue against earlier detection and diagnosis despite advances in, and availability of, modern technologies which allow more sensitive and specific investigations. The only difference in the two cohorts that we were able to identify was in mean disease duration. There was a modest increase in mean disease duration of 2.2 years from 16.8 to 19.0 years and this extended survival is likely to impact on prevalence estimates and is probably the result of improved medical management and the introduction of disease modifying therapeutic interventions. It has been suggested that mean survival for MS can be estimated by doubling disease duration at the prevalence day.20 Application of this method suggests that mean survival in our population has increased from 33.5 years to 37.9 years over the past 20 years, equivalent to a 13% increase in mean survival time. However, this would only account for an additional estimated 49 cases being identified, increasing prevalence from 101 to 114/105 which would not in isolation explain the 45% increase in prevalence observed.
In the earlier study of South Glamorgan prevalence in 1988, Swingler and Compston attempted to retrospectively estimate the incidence of MS in South Glamorgan between 1947 and 1984, concluding that there had been a significant rise during that time and this trend appears to have continued. Incidence for definite or probable disease has increased in a gradual pattern within this population over the past 22 years from 5.4 to 7.9/105/year, representing 515 new diagnoses of which 384 were women. This 45% increase in incidence matches the increase in prevalence and is the most likely cause of increasing disease frequency. In addition, there has also been a gradual change in the proportion of women diagnosed, with the sex ratio increasing from 1.9 to 4.61 (women:men). The changing demographic profile of this incident population is not likely to be the result of genetic factors alone but suggests changing environmental risk factors that have been operative in women alone over the past two decades. This also infers that a significant component of the increasing risk for MS in the female population may be avoidable and more detailed analysis of sex specific environment and lifestyle changes is required. Furthermore, if disease duration, population density and current incidence levels remain stable, a further increase in prevalence to around 260 per 100 000 within the next 20–40 years could be predicted.
Not only is the incidence higher than previously reported in South Wales, it is also higher than reported in many other UK studies, with reports of incidence for MS of 4.47/105 in Southern Ireland,21 5.12/105 in North West Ireland,21 6.5/105 in Northern Ireland,22 4.4/105 in Leeds 5 and 4.8–5.9/105 in Cambridgeshire.8–10 Incidence rates from Scotland appear to be generally higher with incidence reported as 10.1/1056 in the Border regions and 12.2/1056 in Lothian. Rates in Glasgow appear to be lower at 5.7/105.23
Scotland and Ireland, two other Celtic nations, have also recently reported a high prevalence of MS, the most recent estimation for Northern Ireland being 230/100 000,24 and are relatively higher than studies of a similar latitude in England. Studies have suggested that in England, at least, an apartheid social structure benefited the people of the Anglo-Saxon race at the expense of the native Celtic genes. Certainly, a strong genetic barrier has been noted between Central England and North Wales based on high resolution Y chromosome haplotypes.25 It is possible that those with Celtic genes are more susceptible to MS, which may account for the higher prevalence in these three nations although the impact of repeat prevalence surveys in all these studies is unclear.
This study has shown evidence for an increasing incidence and prevalence in South East Wales. Although it has not been possible to control entirely for completeness of ascertainment and changing ability to diagnose MS, both of which are potential confounding factors, examination of the demographic data suggest this has occurred largely as a result of increasing incidence in women. The reasons for this are unclear but strongly suggest sex specific environmental factors operative in the past few decades. Further long term monitoring of population based cohorts is likely to be of benefit in monitoring the degree and reasons for future changes.
Acknowledgments
The authors would like to acknowledge Dr Annabel Hennessey for her role in the 1985 prevalence study, the general practitioners who kindly agreed to take part and the Office of Population Censuses and Surveys.
REFERENCES
Footnotes
Competing interests: None.
Ethics approval: Ethics approval was obtained.