Article Text

Abstract
Objective: Oligoclonal band (OCB) negative multiple sclerosis (MS) is well recognised but uncommon, studied in only a few usually small case series. These reached differing conclusions on whether its clinical features or course differ from OCB positive disease. The study hypothesis was that a definitive study would not only be of clinical and prognostic value but also potentially offer information about the possible role of CSF oligoclonal immunoglobulins in MS disease processes.
Methods: A collaborative cohort of well documented patients in southwest England and south Wales was used to identify and analyse a large group of patients with OCB negative MS and make comparisons with age and sex matched OCB positive controls.
Results: An approximate minimum 3% of patients with MS were OCB negative. They were significantly more likely to exhibit neurological or systemic clinical features atypical of MS (headaches, neuropsychiatric features and skin changes). Non-specific MRI, blood and (other) CSF abnormalities were also more common, emphasising the need for continued diagnostic vigilance, although the incautious application of McDonald diagnostic criteria in OCB negative cases renders categorisation as “definite” MS more likely. Studying the uniformly assessed Cardiff group (69 patients), we found the prognosis for neurological disability was significantly better for OCB negative cases. The age adjusted hazard ratio for OCB negative and OCB positive subjects to reach Disability Scale Status (DSS) 4 and DSS 6 was, respectively, 0.60 (95% CI 0.39 to 0.93; p = 0.02) and 0.51 (95% CI 0.27 to 0.94; p = 0.03).
Conclusion: There are clear clinical differences between OCB negative and OCB positive MS, in particular a better prognosis for disability. This is consistent with a secondary but nonetheless contributory role in disease process for intrathecally synthesised immunoglobulins.
Statistics from Altmetric.com
Approximately 95% of patients with multiple sclerosis (MS) have CSF immunoglobulins in oligoclonal patterns or bands (OCB), implying intrathecal immunoglobulin synthesis and B cell related immune processes.1 2 MS without OCB is pathologically proven3 but unusual (although variable geographically: in the Far East, 35–45% of patients with “conventional” MS show no OCB).4
Concerning outcome, relatively small Western studies have offered mixed messages. One Finnish study of 15 OCB negative patients concluded that a chronic progressive course was more likely.5 Another Scandinavian study (17 OCB negative patients) suggested a more benign outcome.6 A UK study7 (12 cases, three subsequently becoming OCB positive) reported less disability than matched controls.
We studied OCB negative MS in a large patient pool in southwest England and south Wales, aiming to address the following questions: could there be alternative diagnostic explanations for apparent OCB negative MS; does application of the McDonald diagnostic criteria affect the apparent certainty of diagnosis in OCB negative individuals; and, more particularly, are there differences in clinical or investigation features, and/or in the clinical course, especially prognosis?
METHODS
Subjects
We performed a retrospective case analysis of relevant hospital records from Frenchay Hospital, Bristol, UK and the University Hospital of Wales, Cardiff, UK. Both are regional neurological centres that cover defined catchment areas with consultants covering local smaller hospitals (district general hospitals) and the central teaching hospital. The majority of patients in these areas who are referred to a neurologist with a presumptive diagnosis of MS would be seen in either of these two centres. We identified all patients ever diagnosed as having MS with negative OCB (analysed only using isoelectric focusing in both centres) over a 16 year period. Case ascertainment in Bristol was achieved by identifying all CSF results and cross referencing these patients with a list of patients with a diagnosis of MS provided by the hospital diagnostic coding database. Controls from Bristol were identified by sampling patients who were OCB positive and with a diagnosis of MS using the same two sources of information and matching them on sex and closest date of birth to the cases. Cases and controls from South Wales were obtained by interrogating a comprehensive clinical MS database held by NR, again matching by sex and date of birth. We could only address potential differences in prognosis with the Cardiff database, for which prospectively collected Disability Scale Status (DSS) data have been collected at each clinic visit since 1999.
Patient records were scrutinised for retrospective diagnostic accuracy, in particular looking for MS mimics, potential diagnostic alternatives or other “red flags”,8 concentrating on features considered “atypical” for MS9 (neuropsychiatric features, seizures, movement disorders and headaches). Patients were classified according to the criteria of Poser and colleagues10 and McDonald and colleagues.11 12 Other investigation findings (neurophysiology, CSF, blood tests and MRI) were noted, and use of disease modifying treatments and patient response. (Concerning MRI findings, the terms “normal”, “typical”, “non-specific” and “consistent” were based on neuroradiology reports, not our own observations, to reflect more accurately the “real life” situation when confronted with patient and notes.)
Statistical methods
Comparisons between groups were made using the χ2 test or analysis of variance for categorical and continuous variables, respectively. In the Cardiff subgroup, we undertook a survival analysis to compare disease natural history in the two groups. We calculated the time interval from disease onset to reach either DSS 4 (onset of impaired mobility) or DSS 6 (requirement for walking aids). Subjects who had not progressed to either level were censored at the date of the last follow-up.
Initially, we examined survival function graphically using Kaplan–Meier plots, comparing median survival times and incidence rates. We then compared groups more formally by fitting several Cox proportional hazard models, which also allowed us to undertake multivariable analyses. This calculates the hazard ratio (95% confidence interval (CI) and p value) of groups assuming the hazard remains proportional over time. A hazard ratio >1 indicates an increased risk of the outcome; <1 a reduced risk. We tested the proportionality assumption in two ways—visually examining the log–log plots to see if the curves were parallel, then testing whether the log hazard ratio was constant over time by comparing the χ2 value for the scaled and non-scaled Schoenfeld residuals.13 We examined whether other demographic factors (age group (<30, 30–39, ⩾40 years), gender, MRI features and clinical presentation) predicted prognosis. We classified presenting signs and symptoms into the following groups: long tract, brainstem, cerebellar and optic neuritis.
In addition, to compare our results with those of Imrell and colleagues,14 we also repeated our analysis using the data in a cross sectional fashion and deriving the MS Severity Scale (MSSS)15 for all patients with a disease duration >1 year. We then directly compared the difference in MSSS for OCB negative and OCB positive patients with those reported by Imrell and colleagues using fixed (inverse variance method) and random effects models (DerSimonian and Laird method).16
RESULTS
We identified 100 OCB negative MS patients, 69 from South Wales and 31 from Bristol; 56 females and 44 males (female to male ratio 1.27:1), with a mean follow-up of 72 months (range 1–420). Mean age at onset of first MS symptom was 37.5 years (range 16–66). Application of the Poser criteria categorised 69 patients as clinically definite MS, 31 clinically probable MS and none laboratory supported definite MS. According to the McDonald criteria, 88 cases had definite MS and the other 12 possible MS (table 1).
In the control group of 100 OCB positive patients, all patients were McDonald criteria definite MS while 93 were Poser clinically definite MS and seven were laboratory supported definite MS. The commonest presenting feature of OCB negative and positive MS was limb sensory disturbance, followed by ocular manifestations, cranial nerve signs and limb motor disturbance.
Atypical clinical features
Atypical neurological and systemic features (table 2) were both commoner in the OCB negative group (19% more atypical features; 95% CI 7.5 to 30.5%, p = 0.002), headaches being the commonest. However, no evidence for an alternative diagnosis to MS was apparent, and none emerged in the mean 6 year follow-up at either specialist neurosciences centre.
Investigations
Blood tests
Eleven of 76 OCB negative patients (14%) had a weakly positive antinuclear factor (range 1/25–1/280) and two (3%) a weakly positive antineutrophil cytoplasmic antibody (<1/80). Fifty-seven of 59 (97%) anticardiolipin antibody tests were normal; two (3%) showed mild elevations in IgM and IgG. All 54 tests for the lupus anticoagulant were negative. Three of 61 (5%) patients had elevated C reactive peptide levels, with two of these three patients also having a raised plasma viscosity. One of 36 serum angiotensin converting enzyme results was elevated (on two occasions: 73 and 64 iu/l). Eleven of 77 patients (14%) had raised plasma viscosity or erythrocyte sedimentation rate; six (8%) significantly (sedimentation rate >20 mm/h or plasma viscosity >1.79). None of these differed from the control group.
CSF
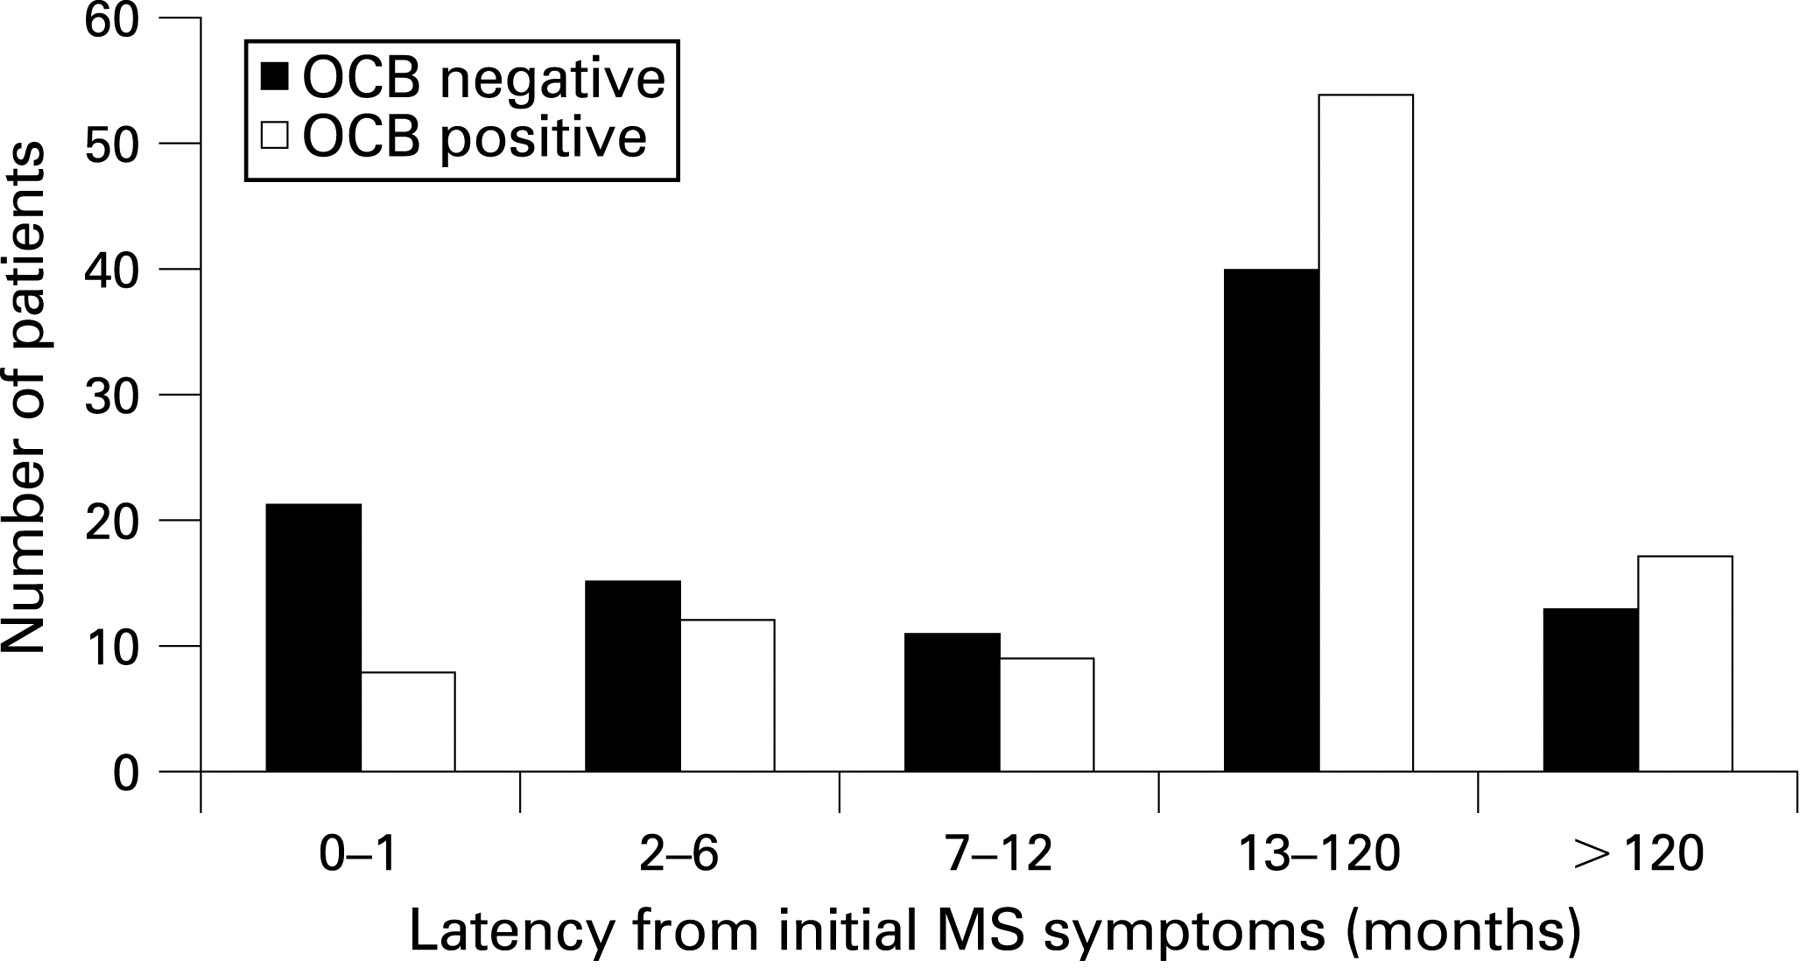
The latency between first ever symptom and CSF analysis was slightly but not significantly shorter in the OCB negative group (χ2, p value on 4, df = 0.06) (fig 1).
In OCB negative patients, the result of other CSF constituents was available in 99/100 cases, and included elevations in lymphocytes (>5 cells/ml) in seven individuals (mean 51 cells/ml, range 6–180), protein (>0.6 g/l) in 17 (mean 1.3 g/l, range 0.60–1.94) and both in four. Protein results did not differ significantly between patient groups but 17/100 control patients had a CSF lymphocytosis (6–42 cells; mean 16 cells/ml) so that OCB negative cases had a 9.9% reduced risk of lymphocytosis (95% CI 1% to 18.8%; p = 0.03).
MRI
Nine of 93 available brain MRI results in OCB negative patients (8.6%) were recorded as “normal”, 48 (52%) as “typical of MS” and 37 (40%) as “non-specific white matter lesions”; the values in the OCB positive were 0, 87/99 (87.9%) and 12 (12.1%) (fig 2).

Thirty-six of 40 spine scans (89.5%) were abnormal with cervical or thoracic changes “consistent with demyelination” in OCB negative patients; 24/29 (82%) in OCB positive patients. OCB negative cases were 36% less likely to have a “typical” MRI brain (95% CI 24% to 48%; p<0.0001).
Neurophysiology
Forty-nine of 81 (60%) OCB negative patients had unequivocally delayed visual evoked potentials (ie, >2SD beyond mean), two (2.5%) had equivocal results and 37.5% were normal. Thirty-one of 60 (52%) control patients had unequivocally delayed visual evoked potentials. These differences were not significant (p = 0.12).
Disease course
Nine OCB negative patients had monophasic disease, 11 primary progressive and 80 relapsing–remitting disease; 51 remained relapsing–remitting at the time of the study and 29 evolved to secondary progression. (The nine patients with monophasic disease were diagnosed as having MS based on dissemination in time or space on repeat MR brain imaging.) The control group included two patients with monophasic illness, five with primary progressive illness and 93 with relapsing–remitting onset disease, 37 of whom had evolved to secondary progressive disease. These differences were not statistically significant.
Disability ratings
In the 69 Cardiff patients, median survival time for all patients to reach DSS 4 was 9.9 years (interquartile range 4.1–17.6) and DSS 6.0 was 17.7 years (interquartile range 9.2–29.9). OCB negative cases took longer to reach DSS 4 and DSS 6. The incidence rate for DSS 4 was 6.1 and 8.8 per 100 person years for OCB negative and OCB positive patients, respectively. The median time for OCB negative and positive patients to reach DSS 4 was 12.2 and 7.2 years, respectively, hence OCB negative cases took 5 years longer to reach this end point. Similar findings were seen for DSS 6 with an annual incidence of 3.2 and 4.5 per 100 person years and a difference of 8.4 years in median time to DSS 6 (fig 3; median survival time 19.3 and 10.9 years for OCB negative and positive patients, respectively). Other variables associated in both groups with a better prognosis were young age group, cerebellar features and a normal or non-specific MRI.

There was no evidence that the proportionality assumption was invalid either graphically or on empirical testing (p>0.19). The age adjusted hazard ratio for OCB negative compared with OCB positive patients was 0.60 (95% CI 0.39 to 0.93, p = 0.02) and 0.51 (95% CI 0.27 to 0.94, p = 0.03) to reach DSS 4 and DSS 6, respectively. This suggests that OCB negative patients were almost half as likely to reach DSS 4 and DSS 6 over the follow-up period compared with OCB positive patients. Further multivariable adjustment for MRI and cerebellar features resulted in little change to the results (hazard ratio for DSS 4 was 0.65, p = 0.06; hazard ratio for DSS 6 was 0.52, p = 0.04).
We noted that the latency for obtaining CSF was shorter for OCB negative patients. It was therefore possible that some of these cases may have been misclassified as false negatives. We found almost identical results when we repeated the survival analyses for EDSS 4, both excluding any patient (negative or positive) with a CSF latency period of <1 month (hazard ratio 0.60, 95% CI 0.38 to 0.95, p = 0.03) or adjusting for CSF latency period (hazard ratio 0.57, 95% CI 0.37 to 0.89, p = 0.01).
Finally, we calculated the MSSS for our patients. The mean score was 5.5 and 6.4 for OCB negative and OCB positive patients, respectively (mean difference −0.91, 95% CI −1.80 to −0.04; p = 0.04) supporting what we had observed in the survival analysis, that OCB negative cases had slower progression. A non-parametric Kruskal–Wallis test produced the same result (p = 0.04).
The standardised mean difference in MSSS scores for our patients was −0.36 (95% CI −0.70 to −0.02) while in the Imrell study it was 0.03 (95% CI −0.20 to 0.26). The pooled analysis showed that the standardised mean difference between OCB negative compared with OCB positive patients was −0.14 (95% CI −0.52 to 0.23, p = 0.5; from random effects model but fixed effects very similar) but there was evidence of heterogeneity, which means the pooled estimate should be treated with caution (p value for heterogeneity = 0.05).
DISCUSSION
Our study has highlighted that OCB negative patients have clinical, neuroradiological and prognostic differences compared with OCB positive patients. The presence of OCB “upgrades” Poser categorisation from “probable” to “definite” MS in 66% of cases.17 However, CSF analysis received less emphasis in the McDonald criteria11 (and less still in their revised version).12 We found that, using Poser criteria, 69% of OCB negative patients had “clinically definite” MS while by the revised McDonald criteria 88% were classifiable as “definite MS”. The potential dangers of inappropriate reliance on MS diagnostic criteria have been clearly and persuasively described.18 Our findings indicate that such likelihood is greater using the newer MacDonald criteria than using Poser: the potential diagnostic added value of spinal fluid examination should not be neglected lightly.
Systemic and clinically atypical neurological features were commoner in OCB negative cases but no cases were found in whom an alternative diagnosis emerged, notwithstanding regular follow-up at the specialist neurology centre for a mean of 6 years after presentation. MS-like presentations being well recognised in such disorders as cerebral vasculitis,19 neuropsychiatric lupus,20 Behçet’s disease,21 neurosarcoidosis22 and Sjögren’s syndrome,23 extreme and continued diagnostic vigilance is required in OCB negative MS with “atypical” features.
Eleven OCB negative patients had weakly positive antinuclear factor titres. In 1972, Fulford et al coined the term “lupoid sclerosis”, suggesting an overlap syndrome between systemic lupus erythematosus and MS.24 More recently, antiphospholipid syndrome has also been suggested to include a phenotype strongly resembling MS.20 However, definitive histopathological studies repeatedly confirm that CNS lupus is a distinct disorder with no evidence of primary demyelination,25 careful analyses clearly confirming antiphospholipid syndrome likewise to be an entirely distinct nosological entity.20 Low titre antinuclear antibody positivity is common26; further testing is warranted only with antinuclear antibody titres greater than 1:160.27 The absence of more specific anti-DNA antibodies (as in all of our cases) and/or of both lupus anticoagulant activity and antiphospholipid antibodies further militates against connective tissue disease.
Previous smaller studies suggested that OCB negative MS carried a relatively more favourable long term prognosis, with milder disability,7 27 28 while a larger report of 83 cases found no significant difference.14 Our larger dataset clearly suggests that OCB negative cases have a better prognosis—OCB negative cases were almost half as likely to reach either DSS endpoint compared with OCB positive patients, and this appeared independent of MRI and other clinical features. This difference remained even after adjusting or excluding patients with a short latency period for CSF collection. Imrell et al’s Swedish study showed no difference in disease progression, as assessed by the MSSS.14 This converts a single cross sectional disability score into a ranked severity measure accommodating disease duration. We repeated our analysis using the MSSS, and still found OCB negative patients had a better prognosis. However, there was some evidence of heterogeneity between our results and the Swedish data, most likely since Imrell et al chose a large unselected case series of patients from the neurology department of Karolinska University as their control sample while we age and sex matched our controls to the OCB negative cases. Our control group was almost 6 years older than the Swedish controls (32.1 years) and had an almost equal male to female ratio compared with the Swedish cohort (1/2.6 men to women). Older age and male gender are both associated with poorer prognosis29 and this probably explains why our control group had a worse prognosis than average, as indicated by an MSSS greater than 5, in comparison with the Swedish control group (MSSS 4.8). It is important that further datasets are examined to determine whether our findings can be used to generalise and, if confirmed, there may be a case for routine lumbar puncture which could conceivably contribute to prognostic risk stratification of patients (eg, prior to recruitment into trials).
This study identified 100 cases within a total population of approximately 2.5 million, and an MS population of some 3000, giving a minimum value of approximately 3%: comparable with that of Zeman et al (3.1%)7 and the more recent Swedish value of 5.5%.14 It is possible that not every MS case in our catchment population was seen at either of our two centres, but we believe it is unlikely that this would have biased our results as for this to have occurred one would have to assume that OCB negative cases with a worse prognosis were selectively referred to other units, which is most unlikely.
Are there implications for understanding tissue damage in MS? Other studies show that OCB negativity is commoner if assessed early in the disease course: some patients acquire bands.7 Thus isolated optic neuritis is OCB positive in a smaller proportion of cases (36−69%)30–32 than MS, and monophasic demyelination in other sites also has a lower frequency of OCB positive results (approximately 45%).28 As subclinical disease activity precedes first clinical expression of MS, we may reasonably speculate that the proportion of individuals who are OCB positive at the “true” onset of the disease is smaller still (and conceivably zero). Perhaps B lymphocytes or plasma cells become sequestered in the CNS as a secondary phenomenon. In the majority of patients with clinically isolated syndromes (81%), clonally expanded intrathecal B cells are found, often appearing before oligoclonal banding, suggesting that recruitment into the CNS of germinal centre differentiated B lymphocytes occurs after the onset of inflammatory demyelination and is the first stage in the development of intrathecal immunoglobulin synthesis.33 34
Therefore, bands appear in the majority of patients after disease onset, which implies that intrathecal immunoglobulin synthesis is not a primary process in the pathogenesis of MS. Importantly, however, the putatively secondary nature of this response by no means implies lack of pathogenetic significance. Our findings clearly imply otherwise: intrathecal immunoglobulin synthesis adversely affects disease course, implying greater (or earlier) tissue damage. Again, several lines of evidence support this by implicating antibodies in tissue damage.35 36
In conclusion, we have been able to offer answers, some speculative, to all of the questions we posed. OCB negative MS patients are not exceptionally rare but are more likely to exhibit atypical clinical features. The higher frequency of non-specific MRI, blood test and (other) CSF abnormalities, all emphasise the need for constant diagnostic vigilance—notwithstanding the observation that the incautious application of the McDonald diagnostic criteria could favour a categorisation of definite MS in OCB negative cases, so encouraging an unjustified confidence in the diagnosis. The prognosis for neurological disability is better in OCB negative cases. Collectively, these findings may support a secondary but nonetheless serious contributory role in tissue damage for intrathecally synthesised immunoglobulins.
Acknowledgments
The authors are very grateful for the enthusiastic support and cooperation of their colleagues in neurology departments throughout the southwest of England and south Wales. We would like to thank Kerstin Imrell for providing unpublished data from his publication.
REFERENCES
Footnotes
Competing interests: None.
Funding: FGJ was generously supported by the Neurological Research Fund established by Dr MJ Campbell.
Ethics approval: Ethics approval was obtained.