Article Text

Abstract
Objectives Amyotrophic lateral sclerosis (ALS) is a fatal disease characterised by combined upper and lower motor neuron degeneration. An early and accurate diagnosis is important for patient care and might facilitate the search for a more effective therapy. MRI was used to study the whole cortical mantle, applying an unbiased surface based approach to identify a marker of upper motor neuron involvement in ALS.
Methods Surface based cortical morphology analyses were performed on structural, 3T MRI data of 45 patients with ALS and 25 matched healthy controls in a case control study design. These analyses consisted of measuring cortical thickness, surface area and volume. The effects of disease progression were examined by correlating cortical measures with progression rate and by longitudinal measures in 20 patients.
Results Cortical morphology analyses revealed specific thinning in the precentral gyrus, considered the primary motor cortex, in patients with ALS compared with controls (p=6.3×10⁻⁸). Surface area was reduced in the right inferior parietal region (p=0.049) and volume—the product of cortical thickness and surface area—was reduced in the right precentral gyrus (p=0.031). From these findings, it appears that cortical thickness is superior in detecting the degenerative effects of ALS. Relative cortical thinning in temporal regions was related to faster clinical progression (right inferior temporal gyrus: p=3.3×10⁻⁴).
Conclusions Cortical thinning of the primary motor cortex might be a diagnostic marker for upper motor neuron degeneration in ALS. Relative thinning in temporal regions was associated with a rapidly progressive disease course.
Statistics from Altmetric.com
Introduction
Amyotrophic lateral sclerosis (ALS) is a fatal neurodegenerative disease characterised by the loss of motor neurons in the cortex, brainstem and spinal cord, leading to progressive muscle weakness. There is as yet no definitive diagnostic test available for ALS. Diagnosis is mainly on clinical grounds based on internationally recognised El Escorial criteria after excluding ALS mimics using laboratory testing and imaging.1 During the early stages, or in atypical presentations, both false positive and false negative diagnoses are common. The average time from onset of symptoms to a confirmed ALS diagnosis can be as long as 12–18 months, which is about one-third of the expected survival time.2 3 An early and accurate diagnosis in patients with ALS is important for patient care as it shortens the phase of diagnostic uncertainty and enables early initiation of multidisciplinary care and treatment with riluzole. In addition, it facilitates the search for an effective drug, allowing more patients to become eligible for inclusion into clinical trials at an earlier phase of the disease course.4 5
The El Escorial diagnostic criteria use a combination of upper motor neuron and lower motor neuron signs to establish levels of diagnostic certainty. These criteria have, however, been criticised for their low sensitivity in the early stages of disease, even in patients in whom there is a strong clinical suspicion for ALS.5 6 Lower motor neuron loss can be assessed by electromyographic examination to improve diagnostic certainty. A similar objective marker for upper motor neuron involvement would facilitate the diagnosis of ALS. This holds in particular for patients with clinically uncertain upper motor neuron features such as asymmetric reflexes or reflexes in wasted muscle groups, or pure lower motor neuron syndromes that may evolve into clinical ALS at later stages.7–9 Such a marker for loss of upper motor neurons is not yet available in routine clinical practice.
In ALS, MRI of the brain and spinal cord is mostly used in the diagnostic process in order to exclude ALS mimic syndromes. In some ALS patients, high signal intensity is evident along the corticospinal tract on T2 weighted, FLAIR and proton density MR images, but these signs are non-specific for ALS.10 Computational MRI techniques have been shown to be more successful in demonstrating and quantifying the degenerative effects of ALS. Techniques mostly applied include voxel based morphometry (VBM) to quantify grey matter volume,11–23 and diffusion tensor imaging to assess the integrity of white matter connections.10 18 22–24 Currently, the neuroimaging field in ALS is moving to an advanced level, from confirming differences at a group level to a marker for assessing the upper motor neuron in the individual patient.25
In the present study, we examined the potential of cortical morphology MRI measures as objective markers for upper motor neuron involvement in a large cohort of patients with ALS compared with controls using a surface based approach. This method allows for disentangling effects on whole brain cortical thickness, surface area and volume. In addition, the cortical effects of disease progression were studied, possibly allowing for identification of endophenotypes with enhanced vulnerability to the neurodegenerative effects of ALS.
Methods
Participants
A total of 45 consecutive patients with ALS, and 25 age and gender frequency matched healthy controls were enrolled in the study. Subject demographics and clinical information are listed in table 1. All subjects gave their informed written consent, in line with the Declaration of Helsinki, and the study was approved by the medical ethics committee for research into humans of the University Medical Centre Utrecht. MRI scans were performed within 6 months after diagnosis in 32 ALS patients (71%), recruited from the outpatient clinic for motor neuron diseases of the University Medical Centre, Utrecht and Radboud University Medical Centre, Nijmegen (The Netherlands) from January 2009 to December 2010. All patients were diagnosed according to the revised El Escorial criteria (possible, probable laboratory supported, probable or definite ALS).1 Subjects with a history of brain injury, epilepsy, psychiatric illness and other neurodegenerative diseases were excluded. Clinical status of the patients was evaluated using the revised ALS Functional Rating Scale (ALSFRS-R) and disease progression rate was assessed (48−ALSFRS-R score/disease duration (months)). Since bulbar involvement has been found to correlate with more extensive cortical involvement, we calculated the bulbar score based on the ALSFRS-R (assessing speech, salivation and swallowing). Furthermore, to examine possible longitudinal effects, patients were invited for a follow-up MRI. In total, 20 patients underwent follow-up scanning sessions after 3–10 months.
Demographic and clinical features of the participants
Data acquisition
To examine the neuroanatomical profile in ALS, structural imaging data sets were acquired on high field 3 T Philips Achieve Medical Scanner. A high resolution T1 weighted image was acquired for surface based morphology. Acquisition parameters were: three-dimensional FFE using parallel imaging; TR/TE=10/4.6 ms, flip angle 8°, slice orientation sagittal, 0.75×0.75×0.8 mm voxel size, FOV=160×240×240 mm and reconstruction matrix=200×320×320 covering whole brain.26
Data analysis
Surface based cortical morphology measures were performed using the well validated and freely available FreeSurfer software package V.4.5.0 (http://surfer.nmr.mgh.harvard.edu/). In short, firstly, for each individual T1 weighted scan, segmentation of grey and white matter was followed by three-dimensional reconstruction of the grey matter surface, the cortical mantle. Secondly, cortical thickness at every small region of the cortical mantle (vertex) was determined by computing the distance between the white matter and grey matter surface reconstructions.27 Thirdly, a group average anatomical image and surface rendering was constructed by spherical normalisation of the surface renderings to standard space. All individual datasets (both for patients with ALS and healthy controls) were then normalised to the computed group average anatomical surface, allowing for group comparison between patients with ALS and matched, healthy controls at each small fragment of cortical surface, which is called ‘vertex-wise comparison’ between patients and controls.
In addition to vertex-wise comparison, we performed a ‘region-wise comparison’ between patients and controls. Regional changes in cortical morphology were examined for each of the 70 anatomical cortical regions in the brain measuring cortical volume (expressing the volume of a brain region in mm3), thickness (expressing the average thickness of a brain region in mm) and surface area (expressing the surface area of a brain region in mm2). The anatomical cortical regions were defined by means of an automatic parcellation of the cortical surface.28 29
Statistical analysis
Whole brain vertex-wise analysis of cortical thickness was performed using a General Linear Model (GLM) examining differences between patients and controls including age as a covariate. The resulting significance levels per vertex were plotted on a group averaged brain template. Statistical maps for patients versus controls (ALS—controls) were thresholded at 2, meaning vertices with p<0.01 (uncorrected) were highlighted, marking the cortical areas with significant changes.
Region-wise group comparison of cortical morphology (cortical volume, thickness and surface area) was performed using GLM included in the R software package for statistical computing (http://www.R-project.org, R 2.11.1 GUI 1.34). Cortical morphology measures for each region were evaluated separately to detect region specific differences between patients and controls taking age and whole brain average cortical thickness or surface area (for volume and surface area) as covariates.30 Regions with a p value of 0.05 or lower were taken as significant. To control for multiple testing, each p value was tested according to the Benjamini and Hochberg false discovery rate. Regions with a false discovery rate corrected p value equal to or below 0.05 were considered to be ‘whole brain significant’.
In order to examine the relation between the average cortical thickness in the 70 anatomical regions and disease progression rate, we used a GLM including whole brain average cortical thickness as a covariate. Longitudinal effects were examined using a random effects model for repeated measurements, to account for intersubject and intrasubject variation. The model was designed to identify the brain regions attributing to the ALSFRS-R score, including disease duration and whole brain average cortical thickness as covariates.
Results
Whole brain cortical imaging
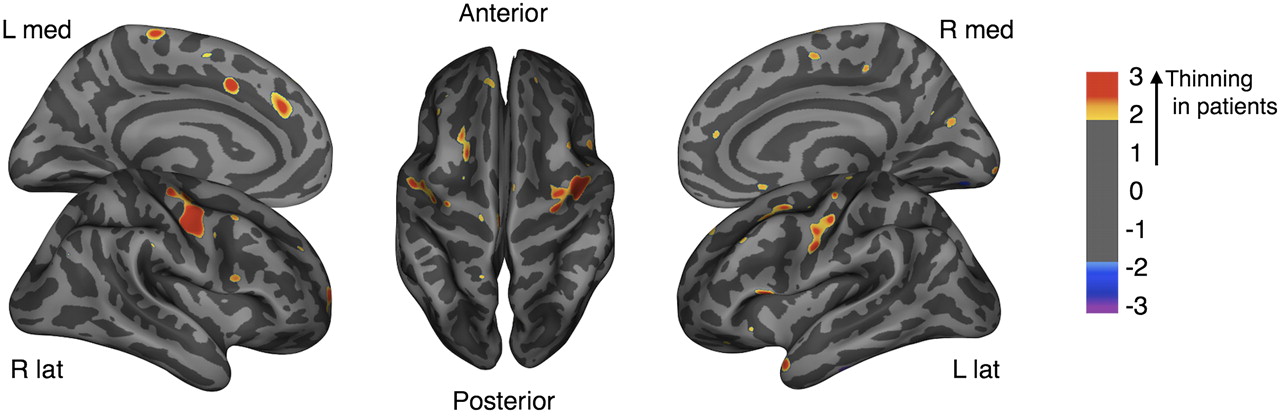
The unbiased whole brain vertex-wise comparison of cortical thickness between ALS patients and controls showed significant thinning of the precentral gyrus, the primary motor region, in patients (figure 1). Region-wise analyses in which the 70 anatomical regions of the brain were compared for cortical morphology measures between patients and controls, also showed whole brain significant cortical thinning in the left and right precentral gyrus (left p=4.5×10⁻⁵; right p=7.8×10⁻⁴) (figure 2A). Cortical surface area did not reveal any whole brain significant effects of ALS, in particular, no effects were found in the cortical motor regions, and the pattern of differences between patients and controls was not symmetrically distributed (figure 2B; right inferior parietal, p=0.049). Regional cortical volume (figure 2C) is the product of surface area (figure 2B) and average cortical thickness of a given region (figure 2A). Based on our findings, these two variables (thickness and surface area) are independent of each other, as also supported by previous studies on cortical morphology.31 32 Effects found with cortical volume are, therefore, diluted effects, caused either by changes in cortical thickness or surface area. This is illustrated by our finding of reduced cortical volume in the right precentral gyrus (p=0.031) which was, in contrast with thickness, not whole brain significant (figure 2).

Cortical thickness in patients with amyotrophic lateral sclerosis compared with healthy controls. Differences in cortical thickness between patients and controls were projected onto an average brain template in a vertex-wise analysis. Areas showing cortical thinning in patients with amyotrophic lateral sclerosis (p<0.01) are coloured yellow/red. The precentral gyrus demonstrates cortical thinning on both sides.
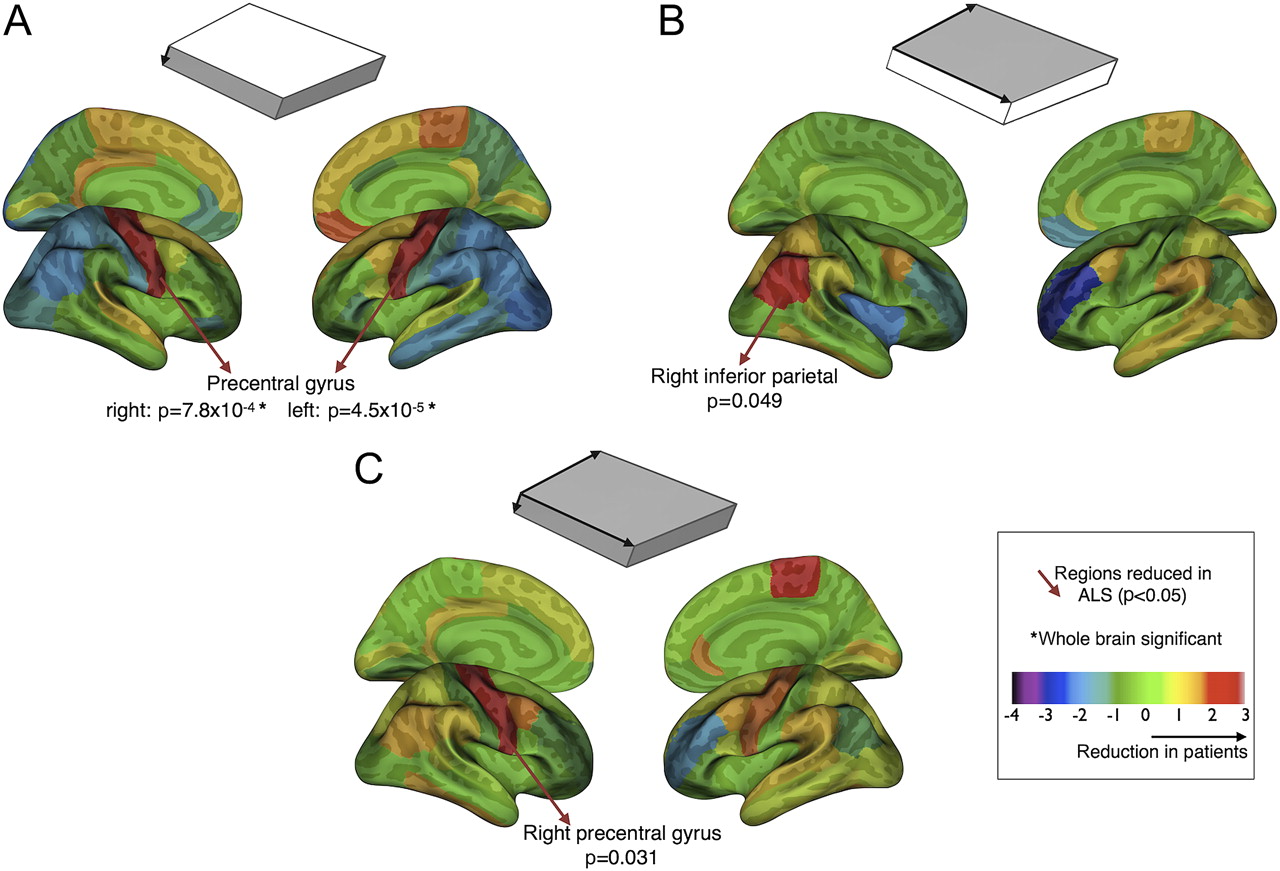
Cortical morphology. Cortical morphology measures (cortical thickness, surface area and cortical volume) were compared between patients and controls in a region-wise analysis. The t values per region were plotted on an average brain template. The yellow/red regions showed a reduction in patients compared with controls, and the blue/purple regions an increase. The regions which showed a significant reduction (p<0.05) were indicated as well as the regions reaching whole brain significance. (A) Cortical thickness showed significant thinning of the precentral gyrus bilaterally, whole brain significant. (B) Surface area comparison between patients and controls shows a different pattern of effects compared with cortical thickness. Only the inferior parietal region (on the right) showed a reduced surface area. (C) Cortical volume—as a product of cortical thickness and surface area—showed a reduced volume in the right precentral gyrus. This effect appeared to be driven by the cortical thinning found in this region. Cortical thickness and surface area are independent modalities, together composing cortical volume. ALS, amyotrophic lateral sclerosis.
Cortical thickness and clinical characteristics
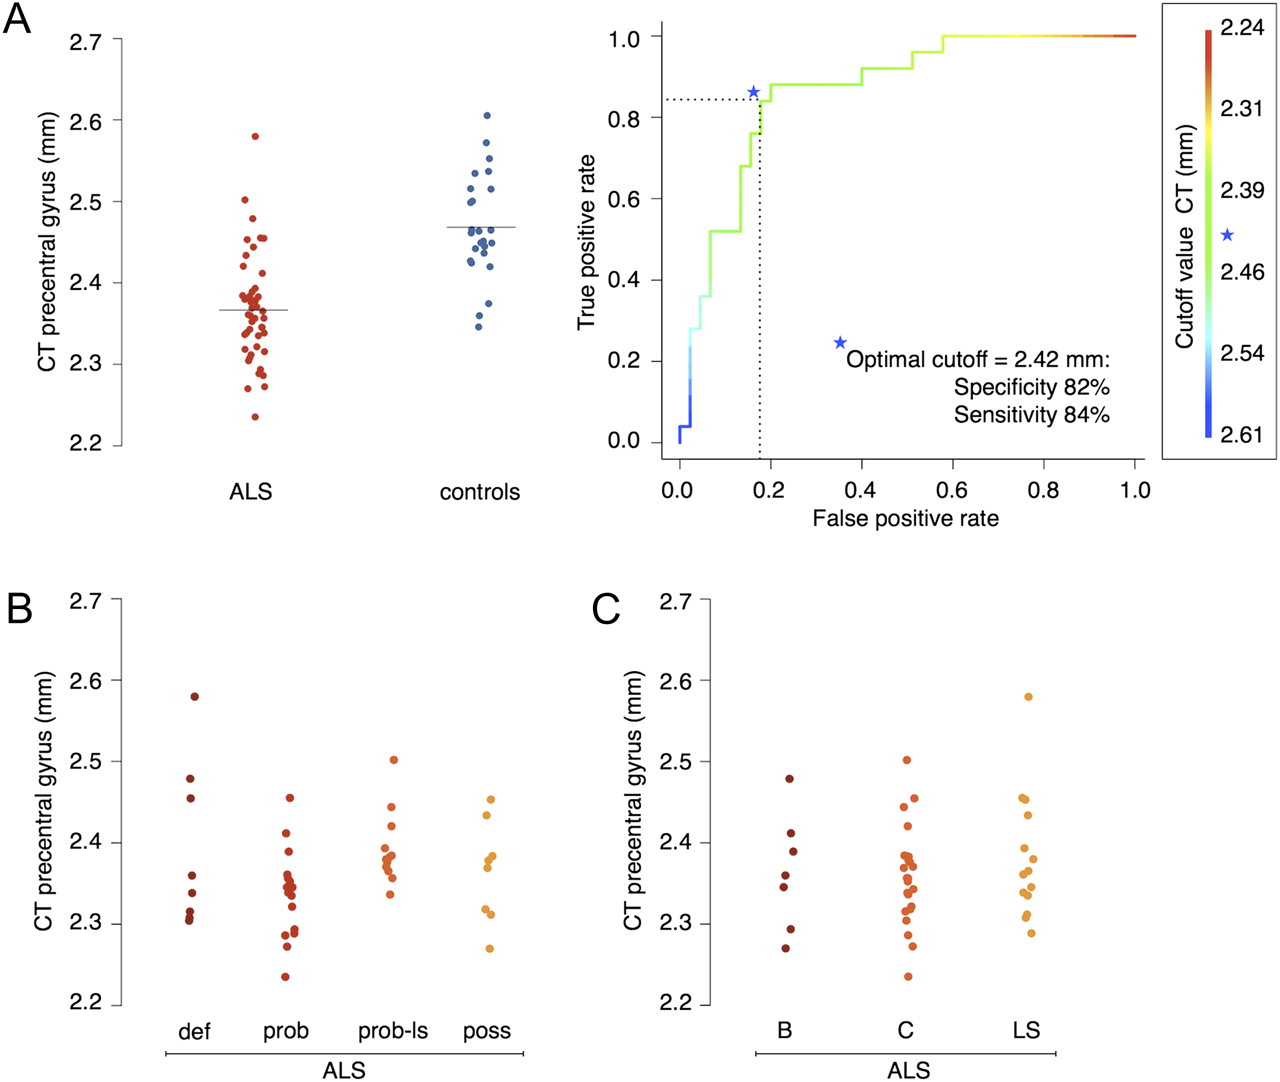
We further explored the individual average cortical thickness in the precentral gyrus (left and right)—corrected for age and whole brain average cortical thickness—in relation to clinical characteristics. As shown in figure 3A these measures largely distinguished patients with ALS from healthy controls (p=6.3×10⁻⁸). An explorative receiver operating characteristic curve showed an optimal cutoff value of 2.42 mm average cortical thickness in the precentral gyrus, corresponding to a specificity of 82% and a sensitivity of 84% (figure 3A). It is important to note that this proposed diagnostic accuracy should be validated in a (neuromuscular) disease control group; as such these findings are, to a certain extent, over inflated. No significant relation was found for the thickness in the precentral gyrus with diagnostic El Escorial category, ALSFRS-R score, disease duration, site of onset, number of regions showing upper motor neuron signs clinically or bulbar score (figure 3B).

Cortical thickness and clinical characteristics The average of left and right cortical thickness in the precentral gyrus was plotted for each individual participant. (A) Patients with amyotrophic lateral sclerosis (ALS) (red) demonstrated significant cortical thinning in the precentral gyrus compared with the healthy control subjects (blue) (p=6.3×10⁻⁸). The discriminating value of cortical thickness in the precentral gyrus between patients and controls was explored with a receiver operator characteristic curve. The optimal cutoff value was 2.42 mm with a specificity of 82% and a sensitivity of 84%. The colours of the curve correspond with the cutoff values of cortical thickness (in mm) displayed on the right side. (B) Comparing the different diagnostic categories, cortical thinning in the precentral gyrus was consistent in all categories. (C) The site of onset was also found to be unrelated to cortical thickness in the precentral gyrus. B, bulbar onset; C, cervical onset; CT, cortical thickness; def, definite ALS; LS, lumbosacral onset; poss, possible ALS; prob, probable ALS; prob-ls, probable laboratory supported ALS.
In addition, we examined in a post hoc analysis the effect of bulbar score on cortical thickness in extramotor regions, using a GLM. Several temporal regions were found to show cortical thinning related to bulbar involvement: left and right parahippocampal (left p=0.046; right p=0.034), right insula (p=0.0027), right temporal pole (p=0.0090), left entorhinal (p=0.022) and left superior temporal (p=0.049); none of these regions were whole brain significant.
Cortical thickness and disease progression
Regional cortical thickness measures were analysed for their relation with disease progression rate. Bilateral temporal regions (inferior and middle temporal gyrus) showed a significantly negative correlation between cortical thickness and progression rate, indicating that temporal thinning is associated with a faster disease progression (right inferior temporal gyrus p=3.3×10⁻⁴; whole brain significant) (figure 4A). Besides temporal regions, a single frontal region, being the right pars triangularis, was found to be associated with disease progression rate (p=0.021) (figure 4A).

Cortical thickness and disease progression. (A) All anatomical regions were analysed for their relation with disease progression rate. Cortical thickness in the middle and inferior temporal gyrus showed an inverse relation with progression rate. The right inferior temporal gyrus demonstrated whole brain significance, further illustrated by a box plot comparing cortical thickness in this region between patients with a high disease progression rate (>0.5; n=22) and patients with a low disease progression rate (<0.5; n=23). (B) The longitudinal analysis revealed parietal and frontal regions related to the clinical decline in amyotrophic lateral sclerosis (ALS). Despite the nearly symmetrical pattern of effects, none of the regions reached whole brain significance. CT, cortical thickness; progression rate=48−ALSFRS-R/disease duration (months). ALSFRS-R, ALS Functional Rating Scale-Revised.
Longitudinal analysis was performed in a subset of 20 patients who were able and willing to undergo a follow-up MRI scanning session. The ALSFRS-R score in these patients had significantly declined during the follow-up (ALSFRS-R score 41.5 at the first versus 36.8 at the second MRI; p=0.002). Longitudinal cortical thinning was found in the following regions: isthmus cingulate left (p=0.0049), lateral occipital left (p=0.024), pars orbitalis right (p=0.033), supramarginalis left (p=0.040) and lateral orbitofrontal left (p=0.045). None of these regions reached whole brain significance but the pattern of effects (figure 4B) approached a symmetrical involvement of frontal and parietal regions.
Discussion
The main finding of this unbiased whole brain cortical imaging study was the significant cortical thinning in the precentral gyrus in ALS, which was demonstrated using vertex-wise and region-wise approaches. The precentral gyrus is considered the primary motor region and therefore this finding appears to be a radiological correlate of upper motor neuron signs observed clinically in patients with ALS. Another important finding of this study is that patients with ALS, showing relative cortical thinning in temporal regions, were found to have a more progressive disease course.
The strong and specific cortical thinning of the precentral gyrus suggests focal degeneration of primary motor areas in ALS. Up till now, studies on grey matter changes have mainly focused on measuring grey matter density as a proxy for cortical volume using VBM (see supplementary table 1, available online only).11–23 A previous study performed cortical thickness measures in ALS using a region of interest approach including the precentral, postcentral and lateral occipital cortex.33 This study reported significant cortical thinning in the precentral gyrus in 14 patients with ALS compared with 12 controls. No significant cortical thinning was found in the control regions, which supports our findings. This study simultaneously performed diffusion tensor imaging measures on the corticospinal tract which also showed degenerative changes. As ALS is a motor neuron disease, it is striking that the primary motor areas have not been consistently reported in VBM studies. Divergent results could be due to true neurostructural heterogeneity in ALS, clinical variety in the studied patients and methodological differences. The present study may have some advantages over previous reports. Firstly, in most grey matter studies, magnetic field strength was 1.5 T, rather than 3 T. Secondly, the sample sizes were limited to a maximum of 26 patients with ALS. Thirdly, volumetric measures with VBM were found to have a lower signal to noise ratio and were relatively insensitive to cortical atrophy localised in brain sulci compared with cortical thickness measures.34 Fourthly, degeneration in the primary motor areas appears to affect primarily thickness and therefore effects on the three-dimensional measure volume can get weakened. These differences could explain the current cortical imaging study showing strong and specific grey matter effects.
Longitudinal measures of cortical thickness, unexpectedly, did not show further cortical thinning of primary motor areas. This could be due to insufficient follow-up time or structural loss that was mostly completed by the time of diagnosis. The latter phenomenon has been observed in other neurodegenerative diseases such as Parkinson's disease where 70–80% of striatal dopamine neurons are lost before symptoms occur.35 Recently, a cortical thickness study in Alzheimer's disease showed cortical thinning was present before the clinical manifestations, as we suggest here for ALS.36 37 Cortical thickness measurements in ALS might, therefore, have the potential to be a marker for upper motor neuron involvement in the diagnostic phase and possibly the preclinical phase. Similar to electromyographic examination revealing (subclinical) lower motor neuron involvement, it would be of interest to study the reliability of cortical thickness as a diagnostic upper motor neuron marker, including ALS mimics. Previous neurophysiological studies have revealed cortical hyperexcitability preceding clinical symptoms, suggesting ALS might have its origin in the brain.38 Our findings are in support of this ‘dying forward’ hypothesis in which corticomotoneurons induce anterograde excitotoxic motoneuron degeneration.39 An alternative hypothesis for cortical thinning present before the time of diagnosis could be that a thinner motor cortex is a risk factor for developing ALS. The risk factor hypothesis poses a number of questions for future research, including the genetic background and environmental influences on the morphology of the motor cortex. A previous study on risk factors for Alzheimer's disease demonstrated the apolipoprotein E allele to be associated with the thickness of the entorhinal cortex in children and adolescents.40 This striking relation between genetics and imaging measures demonstrates the feasibility and relevance of this type of research.
No relation was found between our main outcome measure—cortical thinning in the precentral gyrus—and clinical characteristics. This poor consistency between clinical observations and imaging or neurophysiological upper motor neuron markers is known from pathological studies. For example, patients suffering from motor neuron disease without upper motor neuron involvement clinically can still show degenerative effects in the brain—apart from the spinal cord—typical of ALS.41 As clinical assessment lacks objectivity and can be masked by lower motor neuron signs, an objective upper motor neuron measure would contribute to the diagnostic process. This could explain the observed cortical thinning in patients with (just) possible ALS and the lack of correlation with the El Escorial criteria. In addition, the lack of progressive cortical thinning with advancing disease is in support of the idea that cortical thinning might be present before the time of diagnosis. Another important clinical feature is the presence of bulbar symptoms, which has been associated with more extensive cortical involvement, observed in both pathological studies42 and neuropsychological assessments.43 We found bilateral temporal thinning (ie, parahippocampal) to be related to the presence of bulbar symptoms. This finding corresponds with previous pathological studies in which temporal lesions and/or inclusions have been observed in relation to bulbar region involvement.42 As such, our findings appear to be in agreement with post mortem studies in ALS.
Cortical thinning in temporal regions was also found to be associated with a rapidly progressive disease course. From epidemiological studies, co-occurrence of frontotemporal dementia and even executive dysfunction is an unfavourable prognostic factor supporting our finding.44 None of our subjects had noticeable cognitive impairment but in the absence of formal neuropsychological testing it is unclear whether the relative temporal thinning was accompanied by (subclinical) cognitive impairments. Alternatively, this structural heterogeneity with apparent clinical implications could suggest an endophenotype of ALS demonstrating enhanced vulnerability to neurodegeneration. The symmetrical involvement of neighbouring temporal regions increases the reliability of these findings. Relative cortical thinning in temporal regions might be considered a stratifier for randomising patients in clinical trials.
Longitudinal analysis did not reveal—whole brain significant—cortical thinning in regions over time. Nevertheless, the pattern of effects (figure 4B) does show a nearly symmetrical involvement of parietal and frontal regions which are part of the default mode network (isthmus cingulate, pars orbitalis, supramarginalis and lateral orbitofrontal).45 This network is believed to integrate cognitive and emotional processing and has previously been demonstrated to be involved in ALS.46 Although speculative, these data could support involvement of the default mode network in the disease course of ALS.
The lack of cognitive testing is a potential weakness. In addition, we did not include patients with ‘mimic disorders’, which we need to differentiate from ALS in clinical practice. However, it is not expected for the most common ALS mimics (cervical myeloradiculopathy, multifocal motor neuropathy) to show significant cortical thinning in primary motor regions. Future research should focus on the external validity of cortical thickness measures for ALS in a study following the STARD statement (http://www.stard-statement.org/). The recent international collaboration in the ALS neuroimaging research field could facilitate such steps towards a diagnostic marker.25
We conclude from whole brain cortical morphology analysis that cortical thickness of primary motor regions (precentral gyrus) may be a potent marker for central motor neuron degeneration in ALS. Progression of disease does not introduce further cortical degeneration of the motor cortex although relative cortical thinning in temporal regions was found to be associated with a rapidly progressive disease course.
Acknowledgments
The authors thank the participants in this study and especially the patients with ALS for spending precious time on ALS research.
References
Supplementary materials
Supplementary Data
This web only file has been produced by the BMJ Publishing Group from an electronic file supplied by the author(s) and has not been edited for content.
Files in this Data Supplement:
- Download Supplementary Data (PDF) - Manuscript file of format pdf
Footnotes
MPH and LHB contributed equally to the manuscript.
Funding The current study was supported by the ‘Prinses Beatrix Fonds’ and the Netherlands ALS Foundation.
Competing interests None.
Ethics approval The study was approved by the medical ethics committee for research into humans of the University Medical Centre Utrecht.
Provenance and peer review Not commissioned; externally peer reviewed.