Article Text

Abstract
Objectives About a half of patients with frontotemporal dementia (FTD) has deposition of phosphorylated TDP-43 protein (pTDP-43) in the brain. We studied pTDP-43 and total TDP-43 levels in plasma and cerebrospinal fluid (CSF) in healthy controls and patients with FTD, including those carrying a repeat expansion in the C9orf72 gene or a mutation in GRN.
Methods We included 88 plasma samples of 10 C9orf72 expansion carriers, 5 GRN mutation carriers, 51 patients with FTD without a known mutation and 22 healthy controls. We also obtained CSF samples from 25 patients with FTD (2 with C9orf72 expansion and 3 with a GRN mutation) and 22 healthy controls. We measured pTDP-43 and total TDP-43 levels using sandwich ELISA.
Results Patients carrying the C9orf72 repeat expansion or a GRN mutation had significantly higher plasma and CSF levels of pTDP-43 than the remaining patients with FTD (p<0.05). In addition, plasma pTDP-43 levels were higher in patients with FTD carrying a C9orf72 expansion or GRN mutations than in healthy controls (p<0.05).
Conclusions Our study shows that plasma pTDP-43 levels may be increased in some genetic forms of FTD known to be associated with TDP-43 proteinopathies.
- DEMENTIA
- ALS
- CSF
- FRONTAL LOBE
- GENETICS
Statistics from Altmetric.com
Introduction
Frontotemporal dementia (FTD) comprises a group of clinical syndromes characterised by varying degrees of behavioural disturbances, personality changes and language impairment.1 Based on the topographical distribution and networks involved, three syndromes have been described: behavioural variant FTD (bvFTD), semantic dementia (SD) and progressive non-fluent aphasia (PNFA).2 These clinical syndromes overlap with some extrapyramidal syndromes and motor neuron disease (MND). FTD syndromes are associated with a spectrum of underlying histopathologies usually grouped under the umbrella term of frontotemporal lobar degeneration (FTLD).3 The neuropathology of FTLD is heterogeneous and most cases can be classified according to the protein deposited in inclusion bodies in the central nervous system.4 According to this nomenclature, cases can be assigned to one of three major molecular subgroups: FTLD-TDP, FTLD-tau or FTLD-fused in sarcoma (FUS), depending on whether inclusions contain TAR DNA-binding protein-43 (TDP-43), tau, or FUS, respectively. Family history is common in FTD, suggesting a strong genetic influence.5 Mutations in GRN (MIM: 138945) and MAPT (MIM: 157140) genes have been described to cause FTD.3 ,6–8 Recently, a hexanucleotide repeat expansion in C9orf72 (MIM: 614260) has been shown to be the most common genetic cause of FTD and MND.9–12
TDP-43 was identified in 2006 to be one of the major protein components of the ubiquitinated inclusions present in approximately half of the cases of FTLD and most cases of amyotrophic lateral sclerosis (ALS).13 ,14 Mutations in the TARDBP (MIM: 605078) gene, which encodes for TDP-43, were subsequently identified in a few cases of ALS and FTD-MND.15 ,16 In spite of their low frequency, mutations in TARDBP confirm the primary role of the protein in disease pathogenesis. The presence of TDP-43 inclusions as a protein signature across several neurodegenerative disorders has led to the adoption of the term TDP-43 proteinopathies. Despite the varying clinical presentation of each TDP-43 proteinopathy, they possibly share a common disease mechanism, biomarkers and therapeutic strategies. It is still difficult, however, to accurately predict the presence of a TDP-43 proteinopathy based on the clinical syndrome alone. Therefore, the search for biomarkers for TDP-43 proteinopathies would greatly facilitate early diagnosis and help in the differential diagnosis of FTLD-TDP with other forms of FTLD or other neurodegenerative diseases, a critical step for the introduction of disease-modifying drugs.17 Previous studies have investigated the role of plasma and cerebrospinal fluid (CSF) TDP-43 levels as a biomarker in patients with FTD or ALS, with variable results.18–21 In one of these studies,19 an ELISA was also developed to measure TDP-43 protein phosphorylated at the residues S409/410, which appeared to be more reliable than total TDP-43 to distinguish FTLD-TDP from other forms of FTLD or from Alzheimer's disease (AD). However, whether phosphorylated TDP-43 (pTDP-43) is increased in CSF or in plasma of genetic forms of FTD remains unknown.
In the present study, we measured pTDP-43 and total TDP-43 levels in plasma and in CSF in a group of patients with FTD and in controls. We included subjects with mutations in GRN and subjects with the hexanucleotide repeat expansion in the C9orf72 gene, both disorders known to be TDP-43 proteinopathies.
Patients and methods
Patients
We included patients diagnosed with FTD followed in four specialised neurological referral centres in Spain (HSCSP, HC, FACE, HSE). Some of the samples were obtained from patients enrolled in the Genetic Counselling Program for familial dementias at Hospital Clínic, Barcelona.22 All patients diagnosed with bvFTD fulfilled the new revised criteria23 and those with SD or PNFA accomplished the primary progressive aphasia international consensus criteria.24 All patients and their caregivers were evaluated by a neurologist with experience in neurodegenerative diseases, who reviewed the medical and neurological history, and performed a complete neurological examination. Healthy control subjects were selected among the patients’ caregivers. The control subjects had no known neurological or psychiatric illness or memory or other cognitive complaints, and they showed normal performance for age in neuropsychological testing. Plasma pTDP-43 levels were determined in 88 subjects: 10 carriers of the C9orf72 repeat expansion (7 bvFTD, 2 FTD-MND and 1 asymptomatic individual), 5 symptomatic GRN mutation carriers (two cases with GRN p.C366fsX1, one with GRN p.V279GfsX5, one with GRN c.709-1G>A and another with GRN p.C139R), 51 patients with a clinical diagnosis of FTD and 22 healthy controls (table 1). Among the 51 patients with FTD, 27 (52.9%) had bvFTD (two with bvFTD-MND), 7 (13.7%) had SD and 17 (33.3%) had PNFA. In this group, a C9orf72 repeat expansion had been excluded and mutations in GRN and MAPT had been discarded in those with family history of dementia. Among the five patients with a GRN mutation, three fulfilled criteria for bvFTD, one for SD and the other for PNFA. Some of these cases have been published previously.25–27
Characteristics of the study patients with plasma measurements
CSF samples from 25 patients with a clinical diagnosis of FTD and 22 control subjects were also included. Two patients with FTD carried a C9orf72 repeat expansion and three subjects carried a GRN mutation (two cases with the GRN p.C366fsX1 and one with the GRN p.C139R mutation, table 2).
Baseline characteristics of the study patients with CSF measurements.
Plasma and/or CSF samples were obtained after written informed consent was given by the subjects or their relatives. The local ethical standards committee on human experimentation approved the study.
Plasma and CSF collection and processing
Blood samples were drawn and processed as previously described.26 CSF was obtained by lumbar puncture following standard procedures, collected in a 15 mL polypropylene tube, and processed in less than 30 min. Samples were centrifuged at 1700 g for 10 min (4°C) and immediately frozen at −80°C until use. All CSF samples were analysed for total tau (t-tau), phospho tau (p-tau), and amyloid-β42 (Aβ42) by ELISA (INNOTEST, Innogenetics, Ghent, Belgium) following the manufacturer's instructions. None of the patients or control subjects included had an AD CSF profile defined by Mattsson et al28 equation (Aβ42/p-tau)/(3.694+0.0105x t-tau).
Phosphorylated TDP-43 ELISA assay
Plasma and CSF pTDP-43 levels were measured in duplicate using a commercially available ELISA kit (pTDP-43 ELISA Kit, E9442h EIAab, Wuhan, China) following the manufacturer's instructions. This assay uses a rabbit polyclonal antibody raised against human TDP-43 protein as a capture antibody and a biotinylated rabbit polyclonal antibody against TDP-43 phosphorylated at Ser409 (antiphospho-TDP-43 (pSer409), Cat. Num. SAB4200223 Sigma-Aldrich, Saint Louis, Missouri, USA) as a detection antibody. The standard provided by the manufacturer consists of recombinant human TDP-43 phosphorylated at Ser409. Due to the absence of a well-established assay for TDP-43, we expressed the results as relative units generated from concentration values normalised to a control sample (plasma or CSF) loaded onto all plates. The interassay coefficients of variation for plasma and CSF measurements were 25.4% and 17.1%, respectively. The plasma and CSF samples were tested undiluted. We performed a 4-parameter logistic fit to generate the standard curve, following the manufacturer's recommendations (see online supplementary figure S1). MasterPlex ReaderFit software (MiraiBio Group, Hitachi Solutions America, San Francisco, USA) was used for ELISA calculations.
In order to characterise this ELISA assay, we measured pTDP-43 levels in brain homogenates from two cases with confirmed FTLD-TDP and two controls without any evidence of TDP-43 pathology (see online supplementary figure S2A–F). Brain samples were processed, and soluble and insoluble fractions were obtained. We observed a marked increase in pTDP-43 levels in the insoluble fraction in brain homogenates from FTLD-TDP compared with controls, whereas no difference was found in the soluble fraction (see online supplementary figure S2G).
Total TDP-43 ELISA assay
Total TDP-43 was measured in plasma and CSF using a commercially available ELISA kit (Human TDP-43, KE00005, Proteintech Group, Chicago, USA) following the manufacturer's instructions. The assay uses a rabbit polyclonal antibody raised against amino acids 1-262 of human TDP-43 protein (CatNo. 10782-2-AP, Proteintech Group, Chicago, USA) as a capture antibody and a mouse monoclonal antibody raised against amino acids 203-212 of human TDP-43 (CatNo. 60019-2-Ig, Proteintech Group, Chicago, USA) as a detector antibody. The standard provided by the manufacturer consists of a His-tag recombinant human full-length TDP-43 protein (CatNo. ag13119, Proteintech Group, Chicago, USA). Due to the absence of a well-established assay for TDP-43, we expressed the results as relative units generated from concentration values normalised to a control sample (plasma or CSF) loaded onto all plates. The interassay coefficients of variation for plasma and CSF measurements were 14.3% and 15.8%, respectively. Total TDP-43 levels in human brain homogenates were also measured using this assay. We did not find differences in total TDP-43 levels in either soluble or insoluble fractions between FTLD-TDP cases and controls (see online supplementary figure S2H).
Human brain samples and immunochemistry procedures
Human brain samples were obtained from the ‘Institut de Neuropatologia’, Hospital Universitari de Bellvitge, Barcelona. We included brain samples from two patients with neuropathological criteria for FTLD-TDP4 and two age-matched controls (see online supplementary figure S2).
For immunochemistry purposes, dewaxed sections were boiled in citrate buffer (20 min) to retrieve antigenicity. Endogenous peroxidases were blocked by incubation in 10% methanol-1% H2O2 solution (15 min) followed by 3% normal horse serum solution. Primary antibodies against TDP-43 (Abnova) and TDP-43 phospho 403-404 (TDP-43P; Cosmo Bio) were used at dilutions of 1:600 and 1:2500, respectively, at 4°C overnight. Following incubation with the primary antibody, the sections were incubated with EnVision+ system peroxidase (Dako Corporation, Glostrup, Denmark) for 30 min at room temperature. The peroxidase reaction was visualised with diaminobenzidine and H2O2. The immunoreaction results in a brown precipitate. Sections were slightly counterstained with haematoxylin, dehydrated and cover-slipped for microscopic observation.
For pTDP-43 and total TDP-43 ELISA assays, frozen samples of the frontal cortex from two patients with FTLD-TDP and two controls were used. Tissue was processed using previously described procedures29 with some modifications. In brief, 100 mg of frozen tissue was homogenised with a mechanical homogeniser in 1 mL of Tris-Triton extraction buffer (Tris 50 mmol/L, pH 7.4, 400 mmol/L NaCl, 2 mmol/L EDTA, 0.1% Triton X-100) with protease inhibitors (Complete; Roche, Indianapolis, Indiana, USA). The soluble fraction was obtained after centrifugation at 14 000 rpm for 5 min at 4°C. The resulting pellet was resuspended in 70% formic acid and then recentrifuged at 22 000 rpm for 5 min at 4°C. The supernatant was then neutralised with 1 mol/L Tris buffer (pH 11), and used for the ELISA assays. Protein concentration in these samples was determined using the Bradford assay. Soluble fractions were diluted at 1:1000 in the pTDP-43 ELISA assay and at 1:500 in the total TDP-43 ELISA assay. Insoluble fractions were diluted at 1:100 in both assays.
DNA extraction, genetic analysis and Southern blotting
DNA was extracted from whole blood using previously described standard protocols. All patients had been previously investigated for the presence of the GGGGCC hexanucleotide repeat expansion in C9orf72 gene, and those with a positive family history of dementia were screened for mutations in GRN and MAPT genes, as previously described.26
A non-radioactive Southern blotting protocol was used to estimate the hexanucleotide repeat expansion size.30 Briefly, a total amount of 20 µg of blood-derived DNA was digested with XbaI and electrophoresed on a 0.8% agarose gel. DNA was transferred to a positively charged nylon membrane (Roche Applied Science) by capillary blotting. Hybridisation was carried out at 45°C overnight using a 954 base pairs probe labelled with digoxigenin. Ready-to-use CDP-Star (Roche Applied Science) was used as the chemiluminescent substrate through the transparency technique and signals were visualised on a KODAK Image Station 4000MM PRO (Carestream Health, Rochester, New York, USA). The median number of repeats was used for statistical analysis.
Statistical analysis
The χ2 test was used to compare differences in categorical variables and one-way analysis of variance (ANOVA) was used to compare age and age at onset between groups. Mini-Mental State Examination (MMSE), Global Deterioration Scale (GDS), pTDP-43 and total TDP-43 levels were evaluated by non-parametric statistical analysis (Kruskal-Wallis and Mann-Whitney post hoc test). Correlation analysis of plasma and CSF pTDP-43 and total TDP-43 levels, age, age of onset, disease duration, MMSE, GDS and median C9orf72 GGGGCC hexanucleotide repeat number were performed using the Spearman's r test. Statistical significance for all the analyses was set at 5% (α=0.05). All data were analysed using Statistical Package for the Social Sciences (SPSS, Chicago, USA).
Results
Plasma pTDP-43 and total TDP-43 levels in patients with FTD and controls
Table 1 summarises demographic and clinical data of all patients with plasma sample included in this study.
Family history of dementia was present in 39.2% of patients in the FTD group, and in 100% of subjects with the C9orf72 expansion and GRN mutations. Patients carrying the C9orf72 expansion were significantly younger than the other patients (p<0.001, one-way ANOVA). Their age of onset of the disease was also earlier than that of patients with FTD without mutations (p<0.001, one-way ANOVA). The three groups (C9orf72, GRN and FTD) did not differ in disease duration or GDS score, but patients with FTD had a lower MMSE, suggesting a more advanced stage of the disease (table 1).
We next investigated whether pTDP-43 plasma levels were influenced by demographic variables. In the entire cohort (n=88), plasma pTDP-43 levels were not influenced by gender (p=0.983, Mann-Whitney) but they correlated inversely with age (Spearman's r=−0.318, p=0.003). In symptomatic subjects (we excluded healthy controls and the C9orf72 asymptomatic patient, n=65), plasma pTDP-43 levels were not influenced by disease duration (p=0.500, Spearman), MMSE (p=0.070, Spearman) or GDS (p=0.242, Spearman) scores, but they correlated inversely with age of disease onset (Spearman's r=−0.37, p=0.002). No differences in plasma pTDP-43 levels were observed between the three syndromes of FTD (bvFTD, SD, PNFA). When we analysed plasma pTDP-43 levels according to genetic status, we found that levels differed between groups, although there was considerable variability and overlap (p=0.002, Kruskal-Wallis). Subjects carrying a C9orf72 repeat expansion (n=10) or GRN mutations (n=5) had significantly increased levels of plasma pTDP-43 compared with subjects with FTD without a mutation (n=51) and with controls (n=22) (p<0.05, Mann-Whitney, figure 1A, table 1). An ANOVA adjusted for age and age of onset confirmed the statistically significant difference in pTDP-43 levels between patients with the mutation and those without the mutation. We also calculated the upper 99% CI of the control group and found that 6 out of 10 (60%) subjects in the C9orf72 group and 4 out of 5 (80%) subjects in the GRN group were above this value compared with 8 out of 51 (15.7%) in the FTD group (figure 1A). The levels of pTDP-43 in the C9orf72 and the GRN groups did not correlate with age, age of onset, disease duration, FTD subtype or MMSE score. Noticeably, the only asymptomatic subject carrying the C9orf72 expansion had the lowest plasma pTDP-43 levels (figure 1A).

Plasma pTDP-43 and total TDP-43 levels in control subjects, patients with frontotemporal dementia (FTD) without mutations and subjects with the C9orf72 repeat expansion or GRN mutations. (A) pTDP-43 levels are higher in C9orf72 and GRN groups than in controls and FTD groups (p<0.05, Mann-Whitney). Significant differences between control versus C9orf72 (p=0.002), control versus GRN (p=0.026), FTD versus C9orf72 (p=0.004) and FTD versus GRN (p=0.022) groups. No differences were found between control versus FTD (p=0.204) and C9orf72 versus GRN (p=0.903) groups. (B) Patients carrying GRN mutations had statistically significant decreased plasma total TDP-43 levels compared with controls and FTD groups (p=0.046 and p=0.015, respectively, Mann-Whitney). Patients carrying the C9orf72 repeat expansion had statistically significant decreased plasma total TDP-43 levels compared with FTD group patients (p=0.016, Mann-Whitney) and a trend towards decreased levels compared with controls (p=0.096, Mann-Whitney). The short horizontal bars indicate the median pTDP-43 or total TDP-43 levels per group. The arrow corresponds to the asymptomatic subject carrying a C9orf72 repeat expansion. The dashed horizontal line indicates the 99% upper confidence level for the control group. *p<0.05; **p<0.01.
Next, we measured total TDP-43 levels in plasma in this cohort (except 1 patient with FTD for whom no sample was available; n=87). In the entire group, plasma total TDP-43 levels were not influenced by gender (p=0.610, Mann-Whitney) but they showed a trend towards a positive correlation with age (Spearman's r=+0.21, p=0.051). In symptomatic subjects (n=64), plasma total TDP-43 levels were not influenced by disease duration (p=0.119, Spearman), MMSE (p=0.391, Spearman) or GDS (p=0.966, Spearman) scores, but they correlated positively with age of disease onset (Spearman's r=+0.26, p=0.037). No differences in plasma total TDP-43 levels were observed between the three syndromes of FTD (bvFTD, SD, PNFA). When we analysed plasma total TDP-43 levels according to genetic status, we found that, unlike pTDP-43, total TDP-43 levels were slightly decreased in the C9orf72 (n=10) and the GRN groups (n=5) compared with the FTD group (n=50, p=0.016 and p=0.015, respectively, Mann-Whitney, figure 1B, table 1). Subjects with GRN mutations also showed decreased levels of plasma total TDP-43 levels compared with controls (p=0.046, Mann-Whitney). Plasma pTDP-43 levels correlated inversely with plasma total TDP-43 levels in the entire group (Spearman's r=−0.23, p=0.030).
We next tested whether plasma pTDP-43 or total TDP-43 levels were associated with the number of GGGGCC repeats in subjects with the C9orf72 expansion. To address this issue, we applied a non-radioactive Southern blot technique in blood-derived DNA samples from the 10 subjects carrying the C9orf72 expansion.30 We did not find any correlation between plasma pTDP-43 or total TDP-43 levels and the median number of repeats (see online supplementary figure S3).
CSF pTDP-43 and total TDP-43 levels in patients with FTD and controls
We subsequently investigated the differences in pTDP-43 and total TDP-43 levels in CSF. Table 2 shows demographic and clinical data and CSF AD biomarkers. pTDP-43 and total TDP-43 levels in CSF were not influenced by gender or age in the entire group or by the age of onset, disease duration, MMSE or GDS scores in FTD cases. CSF pTDP-43 levels in C9orf72 expansion or GRN mutation carriers were slightly increased compared with the remaining patients with FTD (p=0.022 and p=0.014, respectively, Mann-Whitney; figure 2A, table 2) but not compared with controls (p=0.144 C9orf72 vs control; p=0.094 GRN vs control). Four out of 5 (80%) mutation carriers were above the upper 99% CI of the control group compared with 2 out of 20 (10%) subjects in the FTD group. We also measured total TDP-43 levels in CSF samples and we did not find differences between groups (p=0.466, Kruskal-Wallis, figure 2B, table 2). No correlation was observed between pTDP-43 and total TDP-43 levels in CSF.

Cerebrospinal fluid pTDP-43 and total TDP-43 levels in control subjects and patients with frontotemporal dementia (FTD). (A) pTDP-43 levels in patients carrying the C9orf72 expansion or GRN mutations are higher than those in patients with FTD without mutations (p=0.022 and p=0.014, respectively, Mann-Whitney). (B) No differences in total TDP-43 levels were found between groups. Patients with C9orf72 (n=2) are depicted with a white circle and those with a GRN mutation (n=3) with a white triangle. The dashed horizontal line indicates the 99% upper confidence level for the control group. *p<0.05.
Association between plasma and CSF pTDP-43 levels
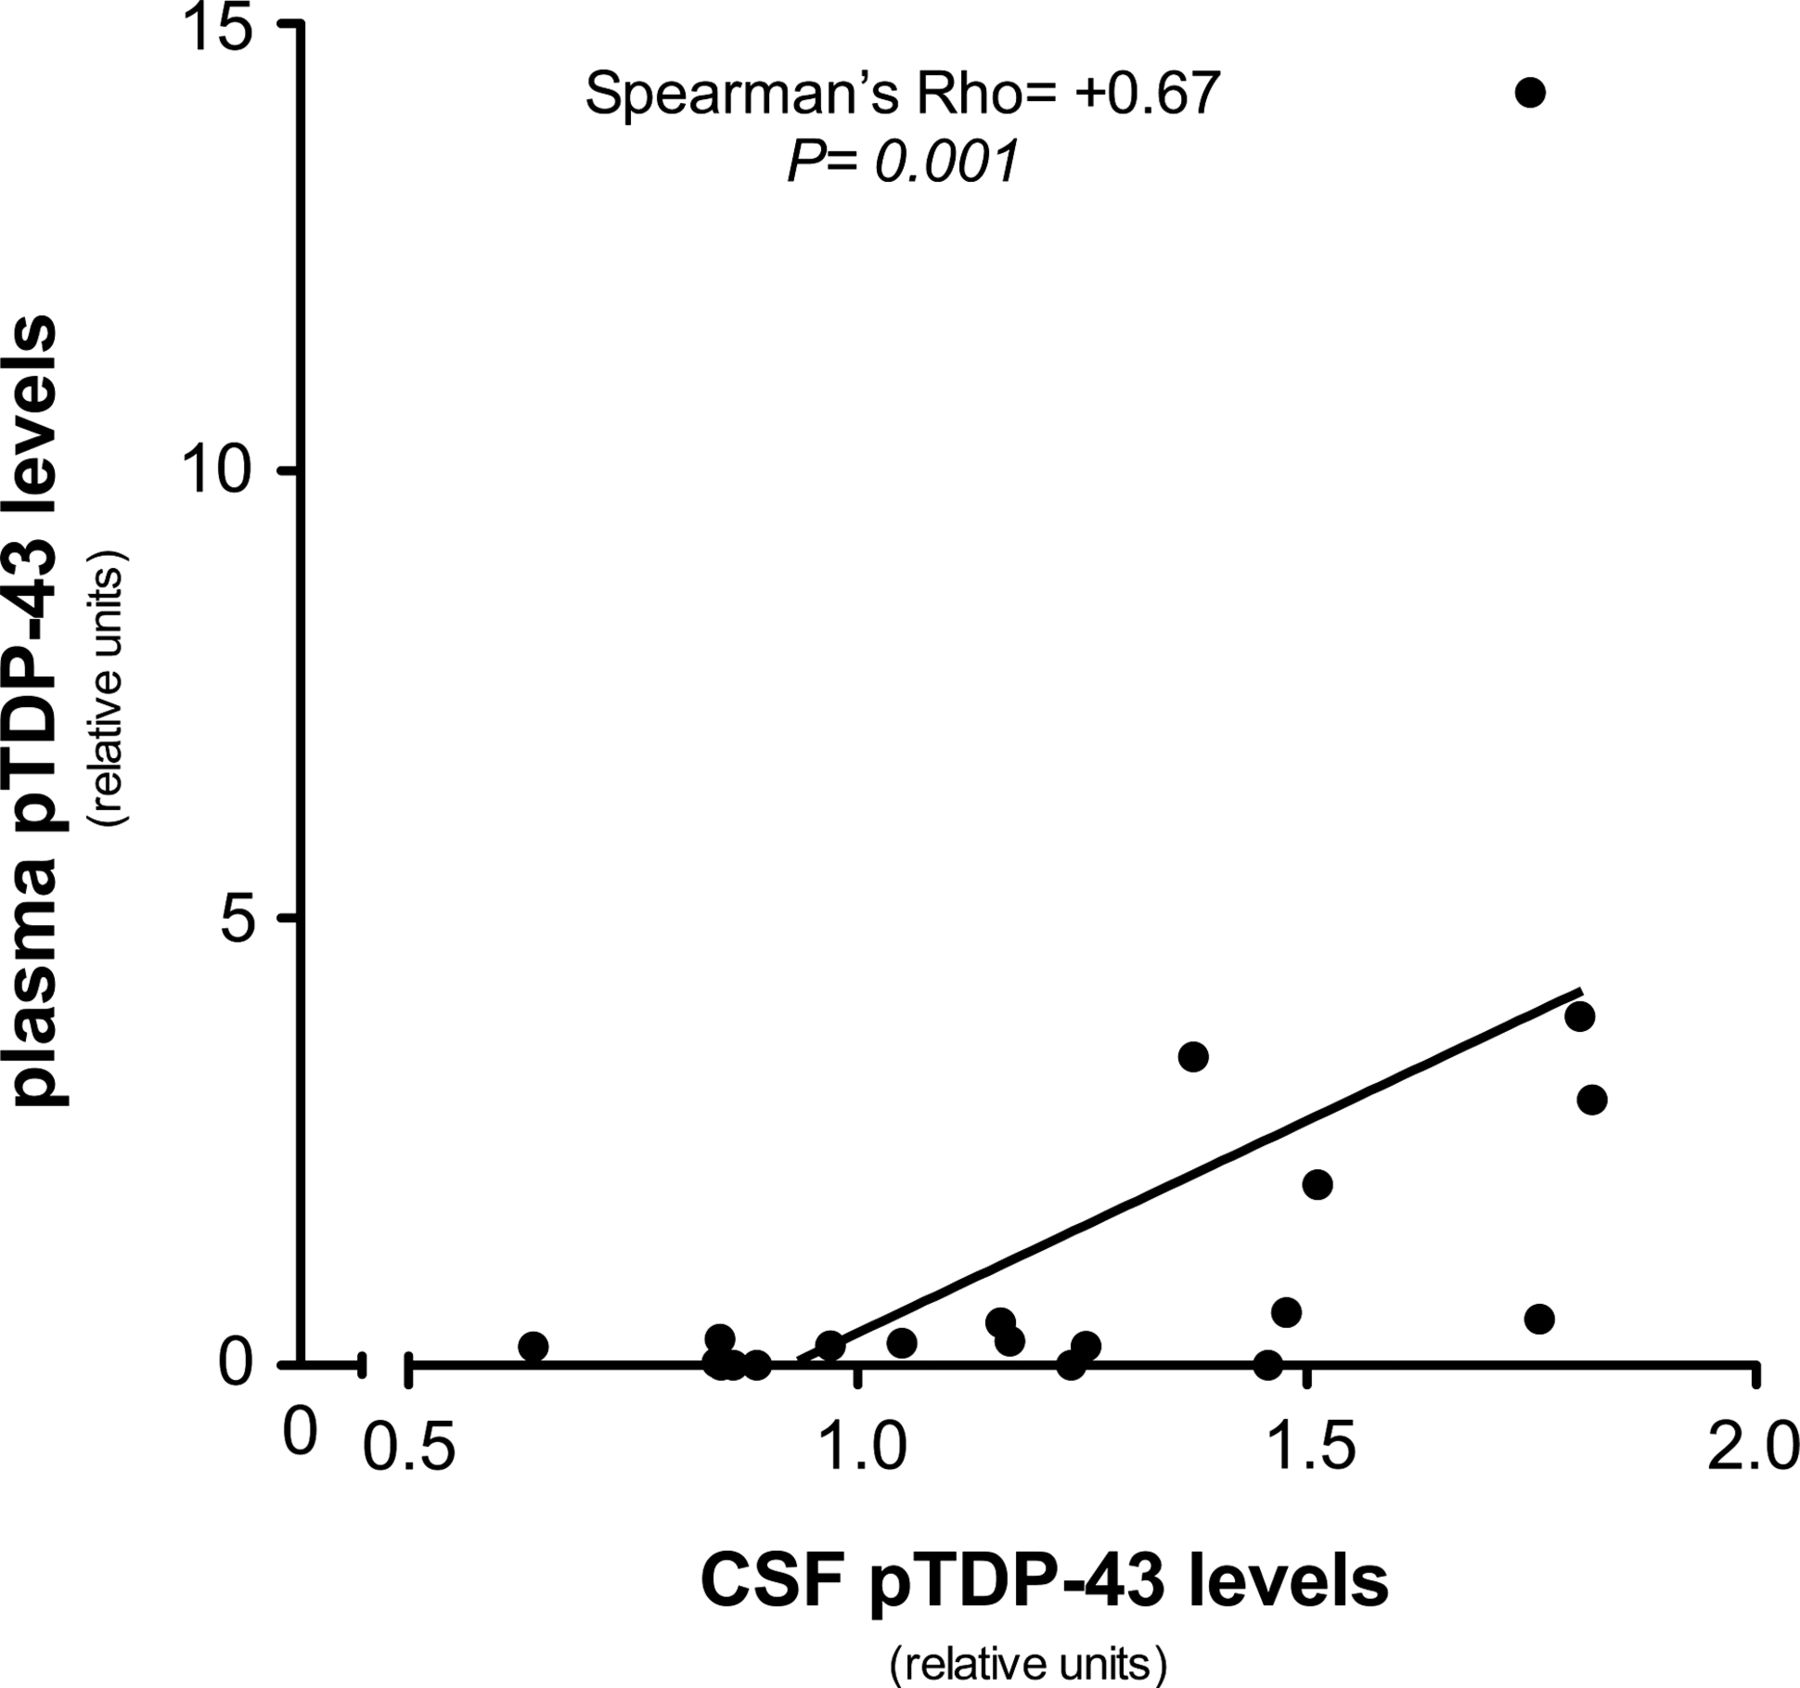
We next examined pTDP-43 levels in the subset of patients with FTD (n=20) for whom plasma and CSF were drawn at the same time point. Despite the reduced number of samples, plasma and CSF pTDP-43 levels correlated with each other (Spearman's r=+0.673, p=0.001, figure 3). However, plasma and CSF total TDP-43 levels did not correlate with each other (Spearman's r=+0.096, p=0.688, n=20).
Correlation between plasma and cerebrospinal fluid (CSF) pTDP-43 levels. The y-axis represents plasma pTDP-43 and the x-axis represents CSF pTDP-43. A positive correlation between plasma and CSF levels was detected (Spearman's r=+0.673, p=0.001). Plasma and CSF samples of each patient were obtained at the same time.
Discussion
The main finding in this study is that patients with FTD with the C9orf72 repeat expansion or GRN mutations had higher plasma levels of pTDP-43 than patients with FTD without mutations or healthy controls. Conversely, subjects with the C9orf72 repeat expansion or GRN mutations had lower plasma levels of total TDP-43 than patients with FTD without mutations. CSF pTDP-43 levels were also higher in patients with FTD with mutations than in those without mutations. Another relevant finding in our study is that plasma and CSF pTDP-43 levels correlated positively with each other, although plasma and CSF total TDP-43 did not.
The discovery of a reliable biomarker to detect FTLD-TDP is an essential step to perform an accurate diagnosis and ultimately to develop therapeutic strategies aimed at altering the natural course of the disease. This is particularly important in FTLD since this condition is known to be associated with several underlying pathologies that can present with the same clinical syndrome.31 The search for biomarkers in neurodegenerative diseases over recent decades has yielded some positive results. The measurement of plasma and serum progranulin levels in FTD has proved to be a reliable biomarker to identify symptomatic and asymptomatic carriers of GRN mutations.32–34 However, we have recently shown that plasma progranulin levels are not influenced by the C9orf72 repeat expansion.26 Progranulin probably represents the most reliable plasma marker in neurodegenerative diseases, but other promising biomarkers are being investigated. CSF analysis has shown to be useful in the diagnosis of AD. The pattern of reduced Aβ42 and increased t-tau and p-tau levels accurately predicts AD pathology.28 ,35 CSF examination can also be used to differentiate AD from FTLD with acceptable specificity.36–38 However, in FTD, current CSF biomarkers are more useful to exclude AD than to confirm the pathophysiological process characteristic of FTLD. In our study, we only included cases without an AD CSF profile that could have biased our sample. Some other CSF biomarkers that have been tested in FTLD yielded variable results.17 There is, therefore, a great need to develop markers to diagnose FTLD, detect the underlying pathology in vivo, and eventually better guide the future application of specific disease-modifying therapies.
TDP-43 is a 414-aminoacid protein that is usually located in the cell nucleus. It belongs to the heterogeneous ribonucleoprotein family and it presumably participates in several cell functions such as DNA transcription, mRNA splicing, mRNA export/import or miRNA synthesis and regulation.39 TDP-43 inclusions in the brain and/or spinal cord in FTLD consist of abnormally aggregated, ubiquitinated and hyperphosphorylated TDP-43.13 ,14 In particular, the importance of phosphorylation of the serine residues S409/410 of TDP-43 has been highlighted as a consistent feature in pathological inclusions of all TDP-43 proteinopathies.40
Previous studies have measured plasma TDP-43 and pTDP-43 in FTD.18 ,19 They mainly found that levels of TDP-43 (total and pTDP-43) in plasma are elevated in subjects with FTLD-TDP. More importantly, they demonstrated a good correlation between plasma pTDP-43 levels and brain deposition of pTDP-43.19 These results suggest that plasma pTDP43 levels could represent a good in vivo biomarker of TDP-43 pathology.
In this study, we found that subjects carrying a repeat expansion in C9orf72 or a GRN mutation had significantly higher plasma pTDP-43 levels than those from control subjects and the remaining patients with FTD. In contrast, total TDP-43 levels in plasma were decreased in subjects carrying a repeat expansion in C9orf72 or a GRN mutation. Three different hypotheses can be postulated to explain these results. First, since C9orf72 expansion and GRN mutation carriers are known to be FTLD-TDP and plasma pTDP-43 correlates with brain pTDP-43 deposition,19 higher levels of plasma pTDP-43 may consequently reflect an increase in brain pTDP-43 burden compared with the remaining FTD cases (in whom other underlying pathologies such us FTLD-tau or FTLD-FUS may be present). Second, as we found a correlation between age and plasma TDP-43 levels, higher levels of pTDP-43 in younger subjects may be the result of age rather than mutation status or brain pathology. This seems unlikely, however, since our results remained significant after adjusting for age. Finally, the C9orf72 expansion and GRN mutations could elevate directly or indirectly pTDP-43 levels regardless of the burden of brain deposition of pTDP-43. Our data favour this last hypothesis and suggest that phosphorylated and non-phosphorylated forms of TDP-43 are in equilibrium as they correlate inversely in plasma. It could be speculated that the C9orf72 expansion or mutations in GRN alter the balance between phosphorylated and non-phosphorylated forms of TDP, promoting the former one. This imbalance would consequently explain the increase of plasma pTDP-43 together with the decrease in plasma total TDP-43 levels found in subjects with the C9orf72 expansion or mutations in GRN. Further studies are needed to explain the lack of correlation between pTDP-43 and total TDP-43 levels in the CSF and to explore why levels of CSF total TDP-43 in subjects with the C9orf72 expansion or mutations in GRN are similar to those in other groups.
Our results in patients with FTD without mutations differ from previous studies that have examined TDP-43 in patients with FTD. Two studies in particular have shown an increase in total TDP-43 levels in plasma and CSF in FTD cases compared with controls.18 ,21 Although in our study the levels of total TDP-43 in plasma were slightly increased in FTD compared with controls, none of the comparisons were significant. Differences in the assays used, sample size and study design may explain the discrepancies among findings.
Our study also addresses, for the first time, the relationship between levels of pTDP43 and total TDP-43 in plasma and CSF in FTD cases and controls. The values obtained in CSF were far more homogenous that those in plasma and we did not find differences in pTDP-43 or total TDP-43 levels between FTD cases and controls. The only significant finding was an increase in pTDP-43 levels in subjects with C9orf72 or GRN mutations compared with the remaining patients with FTD. These results should be interpreted with caution due to the low number of patients with the C9orf72 expansion (n=2) and GRN mutations (n=3) and the fact that most values in the whole FTD group were below the upper 99% CI limit of the control group. Of interest, CSF and plasma pTDP-43, but not total TDP-43, correlated in patients for whom both samples were available (n=20). This finding would suggest that plasma and CSF pTDP-43 levels are in equilibrium and would support the role of plasma as a reliable source of biochemical signatures. However, the lack of correlation between total TDP-43 in plasma and CSF remains unclear and deserves further investigation.
The strengths of this study are the inclusion of a well-characterised patient sample of mutation carriers, the use of CSF biomarkers to exclude AD, and the simultaneous measure of plasma and CSF in some patients. Nevertheless, this study has some limitations. First, the reduced sample size may have limited the power to detect differences, especially regarding CSF measurements. Second, the lack of neuropathological confirmation may have biased our results. Finally, the ELISA assays used show large interassay variability, particularly when using plasma samples. This high variability and the overlap among groups in plasma pTDP-43 levels may preclude the application of this assay in clinical settings. Conversely, CSF values were more homogenous and the interassay variability was lower. We acknowledge that these results are preliminary and should be confirmed in larger samples, preferably with pathologically or genetically confirmed cases, and with the use of other assays. To further determine whether pTDP-43 can be used as a reliable plasma biomarker for FTLD-TDP, patients with the C9orf72 expansion or GRN mutations should be compared with patients with mutations in MAPT, known to cause FTLD-tau.
In conclusion, our results suggest that plasma pTDP-43 levels are increased in patients carrying the C9orf72 repeat expansion or GRN mutations, conditions associated with TDP-43 proteinopathies. If confirmed, pTDP-43 levels may represent a reliable plasma biomarker for FTLD-TDP.
Acknowledgments
The authors thank all the patients and their families for their participation. They thank Carolyn Newey for editorial help, and Laia Muñoz and Inés Matas for technical assistance.
References
Supplementary materials
Supplementary Data
This web only file has been produced by the BMJ Publishing Group from an electronic file supplied by the author(s) and has not been edited for content.
Files in this Data Supplement:
- Data supplement 1 - Online supplement
Footnotes
-
Contributors All authors are justifiably credited with authorship, according to the authorship criteria. In detail: MS-C—conception, design, analysis and interpretation of data, drafting of the manuscript, critical revision of manuscript, final approval given; OD-I—analysis and interpretation of data, critical revision of manuscript, final approval given; AL—analysis and interpretation of data, critical revision of manuscript, final approval given; RS-V—analysis and interpretation of data, critical revision of manuscript, final approval given; IH—analysis and interpretation of data, critical revision of manuscript, final approval given; GA—analysis and interpretation of data, critical revision of manuscript, final approval given; SA-A—analysis and interpretation of data, critical revision of manuscript, final approval given; DA—analysis and interpretation of data, critical revision of manuscript, final approval given; JF—analysis and interpretation of data, critical revision of manuscript, final approval given; IF—critical revision of manuscript, final approval given; JvdZ—analysis and interpretation of data, critical revision of manuscript, final approval given; LD—analysis and interpretation of data, critical revision of manuscript, final approval given; CVB—critical revision of manuscript, final approval given; JLM—critical revision of manuscript, final approval given; RB—critical revision of manuscript, final approval given; JC—design, analysis and interpretation of data, critical revision of manuscript, final approval given; AL—conception, design, analysis and interpretation of data, drafting of the manuscript, final approval given.
-
Funding This work was supported by a research grant from ‘Centro de Investigación en Red en Enfermedades Neurodegenerativas’ and by the ‘Fondo de Investigaciones Sanitarias’ (PI09/00098). At the Antwerp site, the genetic screening of C9orf72 for the repeat expansion was funded in part by the Interuniversity Attraction Poles program of the Belgian Science Policy Office; the Methusalem Excellence program of the Flemish Government; the Medical Foundation Queen Elisabeth, the Research Foundation Flanders (FWO), Belgium The FWO provided a postdoctoral fellowship to JvdZ.
-
Competing interests None.
-
Ethics approval The ‘Hospital de la Santa Creu i Sant Pau’ ethical standards committee on human experimentation approved the study. Barcelona, Spain (code: 5/2010).
-
Provenance and peer review Not commissioned; externally peer reviewed.