Article Text

Abstract
Background Clinical, pathological and genetic overlap between sporadic frontotemporal dementia (FTD), Alzheimer's disease (AD) and Parkinson's disease (PD) has been suggested; however, the relationship between these disorders is still not well understood. Here we evaluated genetic overlap between FTD, AD and PD to assess shared pathobiology and identify novel genetic variants associated with increased risk for FTD.
Methods Summary statistics were obtained from the International FTD Genomics Consortium, International PD Genetics Consortium and International Genomics of AD Project (n>75 000 cases and controls). We used conjunction false discovery rate (FDR) to evaluate genetic pleiotropy and conditional FDR to identify novel FTD-associated SNPs. Relevant variants were further evaluated for expression quantitative loci.
Results We observed SNPs within the HLA, MAPT and APOE regions jointly contributing to increased risk for FTD and AD or PD. By conditioning on polymorphisms associated with PD and AD, we found 11 loci associated with increased risk for FTD. Meta-analysis across two independent FTD cohorts revealed a genome-wide signal within the APOE region (rs6857, 3′-UTR=PVRL2, p=2.21×10⁻¹²), and a suggestive signal for rs1358071 within the MAPT region (intronic=CRHR1, p=4.91×10⁻⁷) with the effect allele tagging the H1 haplotype. Pleiotropic SNPs at the HLA and MAPT loci associated with expression changes in cis-genes supporting involvement of intracellular vesicular trafficking, immune response and endo/lysosomal processes.
Conclusions Our findings demonstrate genetic pleiotropy in these neurodegenerative diseases and indicate that sporadic FTD is a polygenic disorder where multiple pleiotropic loci with small effects contribute to increased disease risk.
Statistics from Altmetric.com
Introduction
Frontotemporal dementia (FTD) is a neurodegenerative disorder characterised by progressive impairment of behaviour, cognition and executive function or language.1 Recent converging evidence suggests clinical, pathological and genetic overlap between FTD and other common neurodegenerative diseases including Alzheimer's disease (AD) and Parkinson's disease (PD).
From a clinical perspective, FTD and AD can sometimes be difficult to distinguish at onset or during disease progression:2 non-cognitive manifestations such as mood changes, psychosis and variable social conduct can characterise the initial phases of AD patients.3 Similarly, cognitive dysfunctions such as changes in abstract thinking or poor judgement, planning and difficulty in completing tasks become evident in either condition as the disease progresses.4 This might partially reflect the fact that FTD and AD are associated with progressive impairment of similar brain circuits (frontal, prefrontal or temporal lobes and/or subcortical regions).5 Of note, among the primary progressive aphasia (PPA) cases in FTD, logopenic progressive aphasia (LPA) has been suggested as an atypical early presentation of AD.6 In addition, the subtype called FTD and parkinsonism linked to chromosome 17 (FTDP-17)—linked to mutations in the microtubule-associated protein tau (MAPT)7 and progranulin (GRN) genes8—shows parkinsonian-like syndrome,9 while dementia features can be found in up to 30–80% of PD cases (Parkinson's Disease Dementia (PDD)) in later stages of the disease.10
From a pathological perspective, abnormal intracellular accumulation of the tau protein is seen in FTD and AD.11 Additionally, TDP-43 pathology has been reported in AD and FTD at different disease stages,12 and in some rare PD cases associated with variability in leucine-rich repeat kinase 2 (LRRK2).13
From a genetic perspective, distinct genetic and genome-wide scale studies have suggested potential genetic overlap between FTD, AD and PD at specific loci. The MAPT gene on chromosome 17 has been extensively investigated in FTD11 and has been recently implicated in AD14 and PD,15 suggesting that tau pathology might jointly contribute to FTD, AD and PD. In addition, genome-wide association studies (GWAS) have revealed that common genetic variants within the HLA region on chromosome 6 increase risk for FTD,16 AD17 and PD.18
Evaluating genetic overlap between complex traits is based on the concept that gene(s) or genetic variant(s) can influence more than one distinct phenotype (=genetic pleiotropy).19 Availability of large-scale genetic data sets (eg, genome-wide summary statistics) is a key to estimate the level of genetic overlap, or genetic pleiotropy, across diverse traits including groups of related disorders.20
We have recently developed methods to evaluate genetic pleiotropy across different disorders (identifying novel genetic variants associated with various conditions including multiple sclerosis and AD).14 ,21 ,22 In the current work, we sought to apply these methods taking advantage of existing large-scale genetic data (ie, summary statistics) for FTD,16 AD23 and PD24 to identify genetic overlap, that is, pleiotropic effects, across these neurodegenerative disorders.
Materials and methods
Participant samples
We evaluated complete summary statistics (p values and ORs) from GWAS data of clinically diagnosed FTD,16 AD23 and PD.24 We used AD-GWAS summary statistic data from the International Genomics of AD Project (IGAP Stage 1), which consisted of 17 008 AD and 37 154 controls with genotyped or imputed data at 7 055 881 SNPs (see table 1 for additional details).23 We obtained PD-GWAS summary statistic data from the International Parkinson's Disease Genomics Consortium (IPDGC) consisting of 5333 cases and 12 019 controls with genotyped and imputed data at 7 689 524 SNPs (see table 1 for additional details).24
Summary data from all GWAS used in the current study
We examined FTD summary statistic GWAS data (discovery+replication phase) from the International FTD-Genomics Consortium (IFGC).16 As our discovery cohort, we used the IFGC phase I cohort (table 1), consisting of 2154 FTD cases and 4308 controls with genotyped and imputed data at 6 026 384 SNPs.16 To replicate our findings from the discovery analyses using IFGC phase I, we assessed the p values of pleiotropic SNPs (conditional FDR<0.05; see the ‘Statistical analysis’ section) within the IFGC phase II sample. The IFGC phase II sample consisted of 1372 FTD cases and 5094 controls genotyped using a partially custom-designed Illumina NeuroX chip (see table 1 for details).16 The IFGC multicenter GWAS has been described in detail elsewhere.16 Briefly, 44 international research groups contributed samples to this two-stage clinical FTD-GWAS. We evaluated genetic data from patients clinically diagnosed with behavioural variant FTD (bvFTD), semantic dementia (SD), progressive non-fluent aphasia (PNFA) and FTD with motor neuron disease (FTD-MND). As described in the original study, we excluded any cases with clinically diagnosed LPA, progressive supranuclear palsy (PSP) or corticobasal degeneration (CBD). In this study, MAPT and GRN mutation carriers were excluded whereas individuals with C9orf72 expansions were not excluded because this locus was identified subsequent to original sample collection. The relevant institutional review boards or ethics committees approved the research protocol of the individual GWAS used in the current analysis, and all human participants gave written informed consent.
Statistical analysis
Using recently developed statistical methods to evaluate pleiotropic effects, we evaluated single nucleoide polymorphysms (SNPs) associating with FTD, AD and PD. These methods have been described in extensive detail in a number of recent publications.14 ,17 ,22 Briefly, for given associated phenotypes A and B, pleiotropic enrichment of phenotype A with phenotype B exists if the proportion of SNPs or genes associated with phenotype A increases as a function of increased association with phenotype B. To assess enrichment, we constructed fold-enrichment plots of nominal −log10(p) values for all FTD-SNPs and a subset of SNPs determined by the significance of their association with PD and AD. In fold-enrichment plots, the presence of enrichment is reflected by an upward deflection of the curve for phenotype A if the degree of deflection from the expected null line is dependent on the degree of association with phenotype B. To assess for polygenic effects below the standard GWAS significance threshold, we focused the fold-enrichment plots on SNPs with nominal −log10(p)<7.3 (corresponding to p value>5×10⁻⁸). The enrichment can be directly interpreted in terms of true discovery rate (TDR=1−false discovery rate [FDR]).22
To identify specific loci involved in FTD and AD or FTD and PD, we computed conjunction FDR.17 Conjunction FDR, denoted by FDRtrait1& trait2, is defined as the posterior probability that a SNP is null for either phenotype or both simultaneously, given the p values for both traits are as small, or smaller, than the observed p values. A conservative estimate of the conjunction FDR is given by the maximum statistic in taking the maximum of FDRtrait1|trait2 and FDR trait2|trait1.17 We used an overall FDR threshold of<0.05, which means five expected false discovery per hundred reported. Additionally, we constructed Manhattan plots based on the ranking of conjunction FDR to illustrate the genomic location of the pleiotropic loci.17
To identify specific FTD loci, we computed conditional FDR.14 ,22 The standard FDR framework derives from a model that assumes the distribution of test statistics in a GWAS can be formulated as a mixture of null and non-null effects, with true associations (non-null effects) having more extreme test statistics, on average, than false associations (null effects). The conditional FDR is an extension of the standard FDR, which incorporates information from GWAS summary statistics of a second phenotype to adjust its significance level. The conditional FDR is defined as the probability that a SNP is null in the first phenotype given that the p values in the first and second phenotypes are as small as, or smaller, than the observed ones. It is important to note that ranking SNPs by standard FDR or by p values both give the same ordering of SNPs. In contrast, if the primary and secondary phenotypes are related genetically, conditional FDR re-orders SNPs and results in a different ranking than that based on p values alone. We used an overall FDR threshold of <0.05, which means five expected false discovery per hundred reported. Additionally, we constructed Manhattan plots based on the ranking of conditional FDR to illustrate the genomic location of the pleiotropic loci. In all analyses, we controlled for the effects of genomic inflation by using intergenic SNPs.14 ,22 Detailed information on fold-enrichment and conditional Q-Q plots, Manhattan plots and conditional FDR can be found in prior reports.14 ,22
For loci with conditional FDR<0.05, we performed a fixed effects, inverse variance weighted meta-analysis across the discovery and replication FTD cohorts (IFGC phases I and II, total n=3526 FTD cases and 9402 healthy controls) using the R package meta (http://CRAN.R-project.org/package=meta).25 Briefly, the fixed effects, inverse variance weighted meta-analysis summarises the combined statistical support across independent studies under the assumption of homogeneity of effects. Individual study β estimates (log ORs) are averaged, weighted by the estimated SE.
Expression quantitative trait loci
For the expression quantitative trait loci (eQTL) analyses, we used data generated within the Braineac (http://www.braineac.org) and GTEx (http://www.gtexportal.org/home/) projects. Briefly, in braineac, eQTL data were generated from 101 neuropathologically defined controls in the following 10 brain regions: cerebellar cortex, frontal cortex, hippocampus, medulla (specifically inferior olivary nucleus), occipital cortex (specifically primary visual cortex), putamen, substantia nigra, thalamus, temporal cortex and intralobular white matter. In GTEx, eQTL data were available for the following 10 brain regions: anterior cingulate cortex (BA24; n=72), caudate (basal ganglia; n=100), cerebellar hemisphere (n=89), cerebellum (n=103), cortex (n=96), frontal cortex (BA9; n=92), hippocampus (n=81), hypothalamus (n=81), nucleus accumbens (basal ganglia; n=93) and putamen (basal ganglia; n=82).
Each eQTL was within ± 1 MB of each SNP, and the significance threshold was p<1×10⁻⁵ as per website curators.
Results
Polygenic enrichment in FTD as a function of AD and PD
We observed enrichment for FTD-SNPs (IFGC phase I) across different levels of significance of association with AD and PD (figure 1). For progressively stringent p value thresholds of FTD-SNPs (ie, increasing values of nominal −log10PFTD≥6), we found 140-fold and 120-fold pleiotropic enrichment as a function of AD (−log10PAD≥3.0) and PD (−log10PPD≥3.0) SNPs, respectively (figure 1). Although decreased in magnitude, we observed a similar pattern of enrichment for AD-SNPs and PD-SNPs conditional on FTD-SNPs suggesting symmetric genetic overlap between the three neurodegenerative diseases (see online supplementary figure S1).
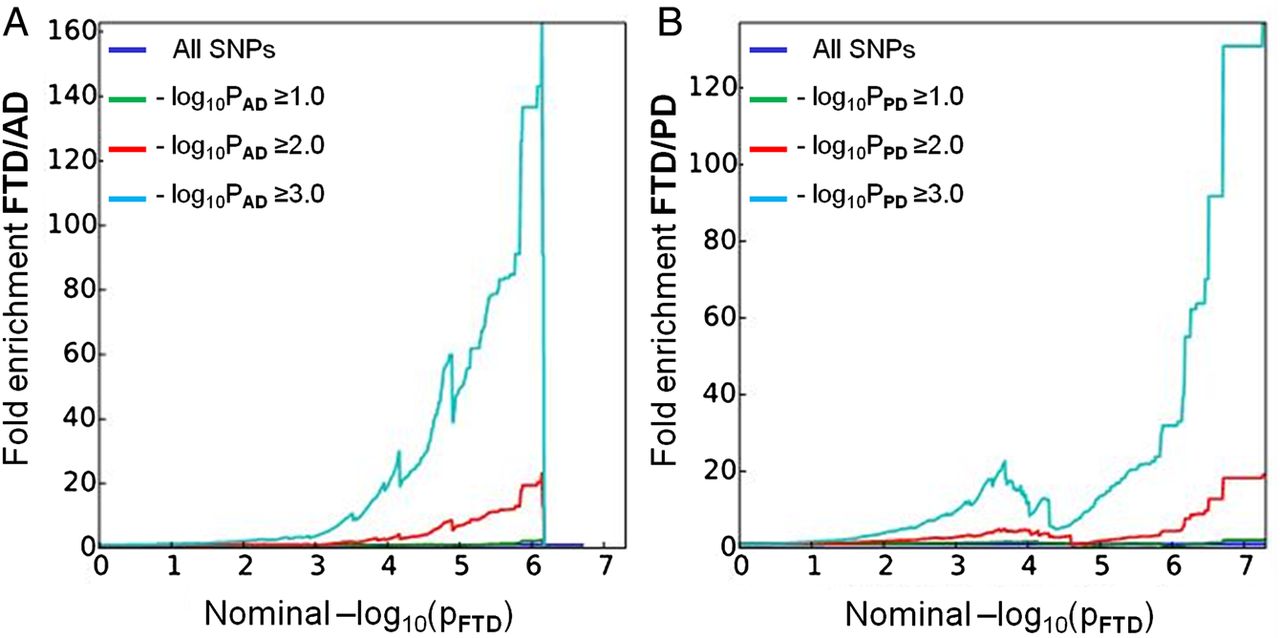
Fold-enrichment plots of enrichment versus nominal −log10 p values (corrected for inflation) in FTD below the standard GWAS threshold of p<5×10⁻⁸ as a function of significance of association with AD (A) and PD (B) and at the level of −log10(p)≥0, −log10(p)≥1, −log10(p)≥2 corresponding to p≤1, p≤0.1 and p≤0.01, respectively. Blue line indicates all SNPs. AD, Alzheimer's disease; FTD, frontotemporal dementia; GWAS, genome-wide association studies; PD, Parkinson's disease.
supplementary data
Conjunction FDR identifies shared FTD loci
At a conjunction FDR<0.05, we identified 11 SNPs that were associated with FTD and AD or PD (figure 2A and table 2). These included rs405509 (chromosome 19; intergenic; closest gene=APOE; conjunction trait=AD; min conjunction FDR=0.0052) and rs9268877 (chromosome 6; intergenic; closest gene=HLA-DRA; conjunction trait=PD; min conjunction FDR=0.048). We also found two pleiotropic loci in the MAPT haplotype-region, namely rs199528 (chromosome 17; intronic=WNT3; conjunction trait=PD; min conjunction FDR=0.018) and rs1358071 (chromosome 17; intronic=CRHR1; conjunction trait=PD; min conjunction FDR=0.02). We detected additional shared loci between FTD and PD on chromosomes 4 (rs7664889, intronic=SCARB2), 10 (rs676768, intronic=VWA2), 12 (rs10784359, intronic=SLC2A13), 13 (rs2893253; intergenic; closest gene=EFNB2) and 18 (rs12964543, intronic=ZNF532) (table 2).
Overlapping loci between FTD, PD and AD at a conjunction FDR<0.05

‘Conjunction’ (A) and ‘conditional’ (B) Manhattan plots of conjunction and conditional –log10 (FDR) values for FTD (black) and FTD given AD (FTD|AD, red) and PD (FTD|PD, green). SNPs with conditional and conjunction –log10 FDR>1.3 (ie, FDR<0.05) are shown with large points. A black line around the large points indicates the most significant SNP in each LD block, and this SNP was annotated with the closest gene, which is listed above the symbols in each locus. For additional details, see online supplementary information. AD, Alzheimer's disease; FTD, frontotemporal dementia; LD, linkage disequilibrium; PD, Parkinson's disease.
Conditional FDR identifies novel FTD loci
To identify novel SNPs associated with FTD, we ranked IFGC phase I FTD-SNPs conditional on their genetic association with AD and PD (conditional FDR), particularly focusing on those SNPs that did not reach genome-wide significant levels in the previous FTD-GWAS. At a conditional FDR <0.05, we found 13 novel FTD susceptibility loci: 11/13 polymorphisms were available for replication purposes within the IFGC2 cohort (7 actual SNPs and 4 proxies with linkage disequilibrium (LD) r2≥0.7 and within 500 kb distance from the reference SNP (based on HapMap 22/21)) (figure 2b, table 3). Then, meta-analysis across IFGC phase I and II cohorts revealed one genome-wide significant locus (p<5×10⁻⁸): rs6857 on chromosome 19 (3’-UTR=PVRL2; conditioning trait=PD; reference allele=T; OR=1.34; 95% CI 1.23 to 1.45; p=2.21×10⁻¹²) (table 3, figures 3A and 4B). We also found one suggestive locus (at p<5×10⁻⁷) on rs1358071 within the MAPT region on chromosome 17 (intronic=CRHR1; conditioning trait=PD; reference allele=A; OR=1.19; 95% CI 1.11 to 1.27; p=4.91×10⁻⁷) (table 3, figures 3B and 4B).
Novel SNPs showing association with FTD at conditional FDR<0.05

Forest plots for (A) rs6857 on chromosome 19 and (B) rs1358071 on chromosome 17.

(A) MAPT-locus on chromosome 17. The two SNPs, rs1358071 and rs199528, are shared between FTD and PD. Either SNP is in LD with rs1052553 whose major allele (A) tags the H1 MAPT-haplotype. The major alleles of rs1358071 and rs199528 are also the effect alleles, and they are in LD with rs1052553 (r2=0.75 and 0.84, respectively). Thus, the effect at this locus is H1 driven. (B) APOE locus. The two haplotypes a and b are depicted. Haplotype a is the one driven by rs6857 with 13 SNPs in LD (r2∼0.8; font color: blue). Haplotype b is the one driven by rs405509 with 10 SNPs in LD (r2∼0.8; font color: black). Rs6857 and rs405509, and the respective haplotypes a and b, are in LE (r2∼0.1). FTD, frontotemporal dementia; LD, linkage disequilibrium; LE, linkage equilibrium; PD, Parkinson's disease.
Expression quantitative trait loci
We evaluated potential biological relevance for each of the identified conjunction and conditional FDR SNPs (rs7664889, rs9268877, rs676768, rs10784359, rs2893253, rs199528, rs1358071, rs12964543, rs405509, rs4417745, rs1328032, rs2446406, rs7184882, rs6857, rs302665 and rs10507789) in human brain tissues assayed for genome-wide gene expression. There were 20 eQTLs in the Braineac data set, while data extracted from GTEx indicated up to 144 significant eQTLs (table 4). These were driven by rs199528 and rs1358071 (chr 17; MAPT-haplotype locus) and by rs9268877 (chr 6; HLA locus). No eQTLs were found for rs405509 and rs6857 (chr19; APOE locus).
Summary of eQTL in brain from Braineac and GTEx
The eQTL data from Braineac and GTEx were cross-supportive in different brain regions, including frontal and temporal cortices, jointly indicating influence on expression levels of LRRC37A2, KANSL1, LRRC37A4 and CRHR1 for rs199528 and rs1358071; conversely, changes in expression of HLA-DPA1 (from Braineac in frontal cortex), and HLA-DRB1 and HLA-DQA2 (from GTEx in subcortical regions and cerebellum) were evident for rs9268877 (table 4).
Discussion
The current work shows that several genetic markers are jointly associated with increased risk for FTD, AD and PD. By leveraging recently developed and validated genetic methods, our findings indicate potential shared genetic architecture among these neurodegenerative diseases and suggest the polygenic nature of sporadic FTD where multiple pleiotropic loci with small effect size contribute to increased disease risk. To the best of our knowledge, this is the first large-scale study assessing genetic overlap between sporadic FTD and AD, and sporadic FTD and PD.
Using the conjunction FDR (which identifies loci jointly associated with two traits), we found eight polymorphisms specific to FTD-PD and one to FTD-AD; through the conditional FDR (which leverages secondary phenotypes, eg, AD and PD, to improve statistical power for gene discovery) we identified 13 novel FTD associated loci. Of note, all nine conjunction FDR loci were also detected in the conditional FDR analyses supporting the notion that the shared polymorphisms increase risk for developing sporadic FTD. Across all analyses, we found notable relevance for the HLA, MAPT and APOE regions.
Building on prior work implicating the involvement of the immune system in PD26 and AD,17 we found that rs9268877, on chromosome 6, intergenic between HLA-DRA and HLA-DRB5, is a shared marker between FTD and PD. The risk allele of this SNP was robustly associated with changes in expression of HLA-DPA1 (increased expression), HLA-DRB1 (increased expression) and HLA-DQA2 (decreased expression) in brain tissues. HLA-DPA1 is an HLA class II α chain paralogue presenting peptides derived from extracellular proteins;27 this is of particular relevance as impairment of clearance of extracellular debris might increase risk of developing a neurodegenerative condition,28 including FTD and PD. While HLA-DRB1 has functions similar to HLA-DPA1, HLA-DQA2 belongs to the HLA class II α chain family located in intracellular vesicles: it plays a central role in the peptide loading of MHC class II molecules and releasing the class II-associated invariant chain peptide (CLIP) molecule from the peptide-binding site. This prevents the binding of self-peptide fragments prior to MHC II localisation within the endolysosome.29 Taken together, these data support and further elucidate details about the role of immune system and endolysosomal processes in FTD and PD.
Our results also point to the MAPT region as jointly involved in PD and FTD through two SNPs on chromosome 17 mapping to WNT3 (wingless-type MMTV integration site family member 3; rs199528) and CRHR1 (corticotropin releasing hormone receptor 1; rs1358071). The risk alleles of both markers, which tag the H1 MAPT-haplotype (figure 4a), are associated with robust expression changes of LRRC37A2 (decreased expression), KANSL1 (decreased expression), LRRC37A4 (increased expression) and CRHR1 (decreased expression). The LRRC37A (leucine-rich repeat containing 37 member) genes encode plasma membrane proteins that pass from the Golgi to the endoplasmic reticulum (ER) and extracellular areas through vesicle transport30 reiterating that intracellular vesicle trafficking is a sensitive and potentially vulnerable process in the brain. The KANSL1 (KAT8 regulatory NSL complex subunit 1) gene encodes a nuclear protein targeting the DNA and involved in histone acetylation with the MLL1 and NSL1 complexes: disruption, mutations or haploinsufficiency of this gene have been associated with the 17q21.31 microdeletion syndrome.31 CRHR1 encodes a G protein-coupled receptor for neuropeptides involved in diverse physiological processes including stress and immune responses.32 Overall, these data strongly suggest that the H1 MAPT-haplotype contributes to increased risk for FTD and PD and its effect is likely mediated by modulating changes in the expression profiles of functionally important cis-genes.
We found evidence for involvement of the APOE region in FTD. We detected a genome-wide significant association signal in sporadic FTD for rs6857 (3′UTR in PVRL2; p value=2.21×10⁻¹²) and identified rs405509, intergenic between TOMM40 (translocase of outer mitochondrial membrane 40) and APOE (apolipoprotein E), as jointly associated with FTD and AD. Rs6857 and rs405509 are in linkage equilibrium (LE; r2=0.1) and are part of two separate haplotypes (figure 4b): (1) one spanning 12 kb (including 13 SNPs [rs142042446, rs12972156, rs12972970, rs34342646, rs283811, rs283815, rs71352238, rs184017, rs2075650, rs34404554, rs11556505, rs778934950 and rs59007384] with r2∼0.8) and encompassing PVRL2 and TOMM40 for rs6857 (haplotype a), and (2) one spanning 14 kb (including 10 SNPs [rs157584, rs71337246, rs7157588, rs7157590, rs1160985, rs760136, rs741780, rs1038025, rs34215622 and rs7259620] with r2 ∼0.8) and encompassing TOMM40 and APOE for rs405509 (haplotype b). Our data indicate that rs6857 increases risk of FTD, while this was not the case for rs405509. No SNP within either haplotype (a or b) was functionally associated with cis-regulatory effects. A large body of evidence implicates APOE as a strong genetic risk factor for AD. Whether it is a genetic modifier of disease risk with non-AD neurodegenerative diseases is still unclear. In this respect, several studies in the literature have highlighted this locus as a potential risk factor, with variable effect size, for a variety of conditions including vascular dementia (VD), amyotrophic lateral sclerosis (ALS), PD and dementia with Lewy bodies (DLB).33 Although early work did not find a clear association between the APOE locus and FTD,34 more recent studies suggest that it might associate with FTD risk35–37 and accelerate frontotemporal brain atrophy.38 Given potential overlap between patients diagnosed with clinical FTD and AD,39 it is unclear whether the current findings reflect a genuine association with FTD or might be inflated by subtle presence of AD or FTD cases in either original study cohort. Nonetheless, these data raise the question whether the detected PVRL2 SNP tags an FTD-specific risk disease haplotype: future work will be required to further characterise the potential role of this locus—in particular, haplotype a—in FTD.
We also detected several pleiotropic loci between FTD and PD, in addition to HLA, MAPT and APOE. The marker on chr 4, rs7664889, is intronic to the SCARB2 (scavenger receptor class B member 2) gene that encodes a glycoprotein locating to the membrane of lysosomes and endosomes further supporting the notion of impacted endolysosomal tracts in FTD and PD. The marker on chromosome 12, rs10784359 maps to the intronic region of SLC2A13 (solute carrier family 2 member 13) a gene which is part of the extended locus that includes LRRK2 indicating that this region may also mediate FTD risk.40
Some limitations might apply to studies of this kind. Particularly, in the original works, the diagnoses of FTD, AD and PD were established clinically. This has the potential to introduce subtle clinical overlap across cohorts, thus assessments in large pathology confirmed cohorts is the next valuable and warranted step to take. However, it must be acknowledged that such ad hoc cohorts are currently not yet available.
Considered together with prior work, our results overall are a first step in the process of decrypting common underpinnings of FTD, AD and PD: they suggest that a subset of genetic markers in the HLA and MAPT-H1 regions (and potentially the APOE cluster) might be jointly involved in these neurodegenerative disorders. In the case of the HLA and MAPT loci, differentially expressed genes in distinct brain regions might account for the clinical and phenotypic differences observed across these disorders.41 Of note, the relevant pleiotropic SNPs that we found in the HLA and MAPT regions do appear to exert their effect by influencing expression changes in cis-genes involved in immune response, endolysosomal processes, intracellular vesicular trafficking and DNA/chromatin-associated metabolism, further supporting the notion of involvement of these processes in neurodegenerative disease, including FTD.42 More work will be needed to further characterise our pleiotropic signals, which might hold promise in the future for developing global preventive and therapeutic strategies for FTD, AD and PD.
In summary, we here identified (1) genetic overlap between FTD and AD and FTD and PD and (2) novel loci influencing FTD pathobiology with small effect size illustrating that a substantial polygenic component contributes to FTD risk.
Acknowledgments
The authors thank the International FTD-Genomics Consortium (IFGC), the International Parkinson's Disease Genomic Consortium (IPDGC) and the International Genomics of Alzheimer's Project (IGAP) for providing summary statistics data for these analyses. Further acknowledgments for IFGC, IPDGC and IGAP are found in the online supplementary material.
References
Footnotes
The IFGC and IPDGC members are listed in the supplementary acknowledgments.
Correction notice Since this paper was first published online the author Gerard S Schellenberg has updated their middle initial to D. The contributor statement has also been updated.
Collaborators from IFGC R Ferrari; D G Hernandez; M A Nalls; J D Rohrer; A Ramasamy; J B J Kwok; C Dobson-Stone; P R Schofield; G M Halliday; J R Hodges; O Piguet; L Bartley; E Thompson; E Haan; I Hernández; A Ruiz; M Boada; B Borroni; A Padovani; C Cruchaga; N J Cairns; L Benussi; G Binetti; R Ghidoni; G Forloni; D Albani; D Galimberti; C Fenoglio; M Serpente; E Scarpini; J Clarimón; A Lleó; R Blesa; M Landqvist Waldö; K Nilsson; C Nilsson; I R A Mackenzie; G-Y R Hsiung; D M A Mann; J Grafman; C M Morris; J Attems; T D Griffiths; I G McKeith; A J Thomas; P Pietrini; E D Huey; E M Wassermann; A Baborie; E Jaros; M C Tierney; P Pastor; C Razquin; S Ortega-Cubero; E Alonso; R Perneczky; J Diehl-Schmid; P Alexopoulos; A Kurz; I Rainero; E Rubino; L Pinessi; E Rogaeva; P St George-Hyslop; G Rossi; F Tagliavini; G Giaccone; J B Rowe; J C M Schlachetzki; J Uphill; J Collinge; S Mead; A Danek; V M Van Deerlin; M Grossman; J Q Trojanowski; J van der Zee; M Cruts; C Van Broeckhoven; S F Cappa; I Leber; D Hannequin; V Golfier; M Vercelletto; A Brice; B Nacmias; S Sorbi; S Bagnoli; I Piaceri; J E Nielsen; L E Hjermind; M Riemenschneider; M Mayhaus; B Ibach; G Gasparoni; S Pichler; W Gu; M N Rossor; N C Fox; J D Warren; M G Spillantini; H R Morris; P Rizzu; P Heutink; J S Snowden; S Rollinson; A Richardson; A Gerhard; A C Bruni; R Maletta; F Frangipane; C Cupidi; L Bernardi; M Anfossi; M Gallo; M E Conidi; N Smirne; R Rademakers; M Baker; D W Dickson; N R Graff-Radford; R C Petersen; D Knopman; K A Josephs; B F Boeve; J E Parisi; W W Seeley; B L Miller; A M Karydas; H Rosen; J C van Swieten; E G P Dopper; H Seelaar; Y A L Pijnenburg; P Scheltens; G Logroscino; R Capozzo; V Novelli; A A Puca; M Franceschi; A Postiglione; G Milan; P Sorrentino; M Kristiansen; H-H Chiang; C Graff; F Pasquier; A Rollin; V Deramecourt; T Lebouvier; D Kapogiannis; L Ferrucci; S Pickering-Brown; A B Singleton; J Hardy; P Momeni
Contributors RF and RSD analysed and interpreted data and wrote the manuscript. YW, JV, SG, AW, CMK, AJS, CCF, JBB, PM, GDS, WPD, LPS, CPH, JSY, LWB, GDR, BLM, OAA, AMD and JH contributed to the conception or design of the work or the acquisition or analysis of data and critically reviewed the drafted manuscript at multiple stages.
Funding This research was supported by grants from the National Institutes of Health (NIH-AG046374, K01 AG049152), Larry J Hilbom Foundation, the Research Council of Norway (#213837, #225989, #223273, #237250/EU JPND), the South East Norway Health Authority (2013–123), Norwegian Health Association and the KG Jebsen Foundation. RSD was supported by the National Alzheimer's Coordinating Center Junior Investigator Award, ASNR Foundation Alzheimer's Imaging Research Grant Program and NIH/NIDA grant U24DA041123. RF is supported by Alzheimer's Society (grant number 284). For IFGC, IPDGC and IGAP funding sources, see online supplemental acknowledgements.
Disclaimer The funding organisations had no role in the design and conduct of the study; collection, management, analysis and interpretation of the data; preparation, review or approval of the manuscript; and decision to submit the manuscript for publication.
Competing interests None declared.
Ethics approval The relevant institutional review boards or ethics committees approved the research protocol of the individual GWAS used in the current analysis, and all human participants gave written informed consent.
Provenance and peer review Not commissioned; externally peer reviewed.