Article Text

Abstract
Background Sleep difficulties are common in people with multiple sclerosis (MS), but whether associations between poor sleep quality and quality of life are independent of MS symptoms, obesity and other MS-related factors remains unclear.
Methods Cross-sectional analyses of data from the Australian MS Longitudinal Study (n=1717). Sleep was assessed using the Pittsburgh Sleep Quality Index, Epworth Sleepiness Scale and International Restless Legs Syndrome Study Group Rating Scale; health-related quality of life using the Assessment of Quality-of-Life 8-D.
Results Poor sleep quality was common (67%), and more common than in community samples. Sleep measures clustered independently within MS symptoms. The clusters ‘fatigue and cognitive’, ‘feelings of anxiety and depression’, ‘pain and sensory’, were independently associated with poor sleep quality. Quality-of-Life utility scores were a clinically meaningful 0.19 units lower in those with poor sleep. Sleep quality, daytime sleepiness and restless leg syndrome were associated with reduced quality of life, independent of MS-related symptoms and body mass index.
Conclusion Poor sleep quality is common in MS and was strongly associated with worse health-related quality of life, independent of other MS symptoms and did not cluster with other common MS symptoms. Improving sleep quality may substantially improve quality of life in people with MS.
- MULTIPLE SCLEROSIS
- SLEEP
- QUALITY OF LIFE
Statistics from Altmetric.com
Introduction
Poor sleep quality is common in people with multiple sclerosis (PwMS) (up to 67%1—more common than in the general community (33%–45%)).2 It is associated with lower health-related quality of life (HRQoL),3 and higher mortality in the community.4 Risk factors for poor sleep in PwMS include disease duration5, disability,6 and MS symptoms, for example, fatigue, cognitive dysfunction, depression and anxiety.7 However, whether poor sleep remains associated with reduced HRQoL after considering MS symptoms remains unclear. As sleep quality is modifiable, improving sleep quality may result in clinically meaningful improvements in health outcomes.
This study (1) assessed whether sleep difficulties are prevalent and more common in PwMS than the general population, (2) examined how sleep related to 13 common MS symptoms and (3) determined whether sleep quality is associated with HRQoL.
Methods
Study samples
We used two surveys (2020) (total response rate 56%) from the Australian MS Longitudinal Study (AMSLS), a large representative cohort of Australians with MS.8 AMSLS was approved by the Tasmanian Health and Medical Human Research Ethics Committee (14183). All participants provided written informed consent.
Data from MAILES,9 an Australian community cohort of older men (n=826); and LIFE, a population–based German cohort of men (n=4420) and women (n=4864)10 were used as comparators.
Measurements
Pittsburgh Sleep Quality Index
Sleep quality over the last month was assessed using the Pittsburgh Sleep Quality Index (PSQI)11 (range 0–21).
Epworth Sleepiness Scale
The ESS assessed level of daytime sleepiness across everyday situations,12 scored on a 0–3 rating scale (range 0–24).
Restless Legs Rating Scale
The International Restless Legs Study Group Rating Scale13 (here, ‘Restless Legs Rating Scale’) assessed severity of restless legs symptoms and impact on sleep in the past week, on a 5-point scale (range 0–40).
MS Symptom Scores
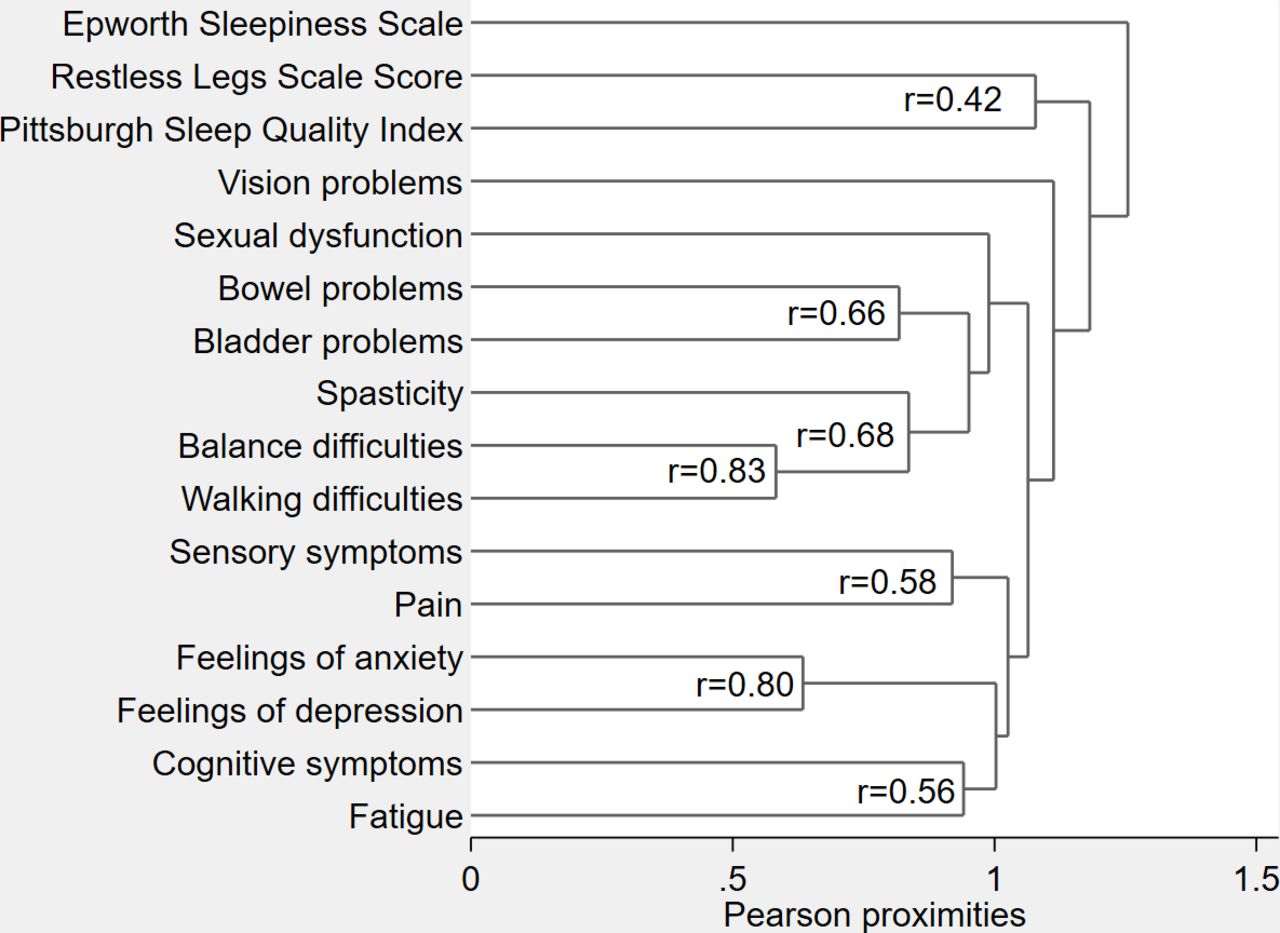
Symptom severity over the previous 4 weeks (vs before they developed MS) of 13 common MS symptoms was assessed using MS Symptom Score (MSSymS),14 using a 0 (no problem) to 10 (worst possible symptom) Numeric Rating Scale (figure 1).
Dendrogram of hierarchical cluster analysis of how MS symptoms group together. Dendrogram presents information on how MS symptoms group together at various levels of similarity. On the left of the dendrogram, each symptom is considered as its own cluster. Horizontal lines extend up for each symptom and at various (dis) similarity values, these lines intersect with lines from other symptoms to form one line. Lines of symptoms continue to combine until all symptoms group together at the right of the dendrogram. Symptoms whose lines intersect towards the left of the figure are more closely related than those whose lines intersect further to the right. MS, multiple sclerosis.
Assessment of quality of life
The Assessment of Quality of Life (AQoL-8D) is a comprehensive multiattribute utility instrument, which captures and assesses HRQoL, allowing billions of health states (2.4×10²³).15 Range is 0–1, where ‘0’ is the anchor point for death and ‘1’ is perfect health.15 The minimum clinically important difference (MCID) for the AQoL-4D is 0.06 utility points (95% CI 0.03 to 0.08).16
Sleep interference
Participants were asked ‘How often do sleep problems interfere with activities of daily living (ADLs)?’ and ‘how often do your sleep problems interfere with social functioning’?, scored on a 0–3 scale, with options ‘not during the past month’, ‘less than once a week’, ‘once or twice a week’ and ‘three or more times a week’.
Insomnia symptoms
Difficulty falling asleep, staying asleep, waking up too early and not being able to go back to sleep due to symptoms related to: (1) restless legs, (2) pain, (3) sensitivity to temperature, (4) needing to go to the toilet and (5) anxiety/stress or low mood were assessed. Responses were scored as for sleep interference.
Clinical and demographic measures
MS disability was measured by the Patient Determined Disease Steps scale17 (range 0 (normal)–8 (bedridden)). Education level, MS type, height and weight were self-reported.
Statistical analysis
Data were analysed using STATA V.17, with p≤0.05 considered statistically significant. Differences between good and poor sleepers and clinical populations were assessed using t-tests and χ2 tests (online supplemental tables 1, 4 and 5). Effect sizes were estimated using Cohen’s d18 (online supplemental table 5).
Supplemental material
Hierarchical cluster analysis was used to assess whether and how the measures of sleep quality clustered with other MSSymS.19 We omitted individual sleep components and reran models as sensitivity analyses.
Associations between PSQI global score and AQoL-8D health utility score were assessed using linear regression and automatically back-transformed using ‘linreg’, a user-defined STATA command. Final multivariate models were selected using backwards selection to remove components until all remaining terms were statistically significant (p≤0.05). Retained symptoms from the first model and sleep-related measures from the second model were included in models 3 and 4. Coefficients have been multiplied by 100 for consistency with other AMSLS publications.20
Models were adjusted for confounders where appropriate. Regression diagnostics were run to ensure assumptions for linear regression were met.
Results
Participant characteristics
Clinical and demographic characteristics of the study cohort are shown in online supplemental table 1.
Non-response bias analyses
Participants who completed both surveys were slightly older (+2.3 years; p<0.05) and had a slightly longer MS duration (+1.2 years; p<0.01). Thus, differences are unlikely to be clinically meaningful. There were no differences in sex or educational attainment.
Characterising sleep difficulties in the AMSLS cohort
Poor sleep quality (PSQI>5) (68%), abnormal levels of daytime sleepiness (Epworth Sleepiness Scale, ESS ≥11, 21%) and symptoms of restless legs (45%), difficulty falling asleep, staying asleep or inability to get back to sleep at ≥3 times weekly, sleep problems interfering with self-reported ADLs (16%) and social functioning (25%) at least weekly were common (online supplemental table 2). Sleep interference was more common in people with poor sleep quality than those with good sleep quality (38% (vs 8%) for ADLs and 33% (vs 6%) for social functioning). All assessments of sleep difficulties listed in online supplemental table 2 were more common in people with poor sleep quality by the PSQI (data not shown).
Relationship between sleep problems and common MS symptoms
Sleep problems did not cluster with other MS symptoms. Rather, all sleep problems clustered independently (figure 1). These results persisted when repeated without the ESS.
Factors associated with poor sleep quality
Being younger, overweight or obese, having a recent MS relapse, higher disability levels and three symptom clusters (‘pain and sensory’, ‘feelings of anxiety and depression’ and ‘fatigue and cognition’) were independently associated with poorer sleep quality in multivariate analyses (online supplemental table 3). Having a university education (vs primary/secondary school education only) was associated with lower PSQI scores (online supplemental table 3).
Comparison between PSQI scores in AMSLS participants versus population norms
In almost all comparisons, sleep quality in MS was worse in both males and females and most age groups (online supplemental tables 4 and 5). Effect sizes were large to very large (Cohen’s d) (online supplemental table 5).
Association between sleep problems and HRQoL
AQoL utility scores were 0.19 units lower in people with poor sleep (PSQI>5, mean 0.57, SD 0.2) compared with those with good sleep (PSQI≤5, mean 0.76, SD 0.18), p<0.001; double the upper limit of the MCID (0.08). Each unit increase in PSQI was associated with 0.019 reduction in AQoL-8D utility scores after adjustment for sleepiness (ESS) and restless legs (table 1, model 2), reducing to 0.0108 after further adjustment for symptoms and body mass index (BMI) (table 1, model 4).
Assessment whether sleep-related measures were associated with health-related quality of life (measured with the overall AQoL-8D utility score), independent of other factors
All three sleep-related measures remained independently associated with AQoL-8D after taking other MS symptoms and BMI into account (table 1, model 4), with increased R2 values when including sleep and symptoms (Table 1).
Discussion
Poor sleep is very common in Australians living with MS (68%), and significantly more common than comparable population samples. Sleep did not cluster with recognised MS symptoms. Sleep-related variables were strongly, meaningfully and independently associated with poorer AQoL-8D utility scores. Therefore, poor sleep is associated with a substantial reduction in HRQoL independent of other common MS symptoms. Interventions that improve sleep may provide substantial benefits for PwMS.
Symptom clusters ‘feelings of anxiety and depression’, ‘pain and sensory’ and ‘fatigue and cognition’ were most strongly and independently associated with sleep quality, with modest effect sizes. Sleep complaints and depression/mood disorders21 are bidirectional longitudinally, and sleep complaints may be prodromal to mood disorders,22 not just the reverse. Pain, fatigue and poor cognition can be temporally associated with each other in real time on the same day, but not across days.23
Participants with poor sleep had average AQoL-8D utility scores 0.19 units lower than those with good sleep. Similarly, after accounting for other factors, every unit increase in PSQI was associated with a 0.0108-unit reductions in HRQoL, explaining up to 63.8% of variance in the overall AQoL-8D utility score.
Strengths include the large, representative8 national sample of PwMS and well-validated measures of correlates of HRQoL. Limitations include no objective measures of sleep, for example, polysomnography. Using wearables, for example, actigraphs24 would add complementary information to sleep quality. Lastly, causal inferences about associations cannot be made from cross-sectional studies.
Sleep has a substantial impact on HRQoL, which warrants development of interventions to improve sleep. Interventions must include strategies to manage MS symptoms, sleep complaints and symptom-independent mechanisms of poor sleep. Further work will aid management of poor sleep and development of sleep interventions, including qualitative research, real-time symptom assessments using Apps and wearables, impact of medication use (including disease modifying therapies), and longitudinal studies examining factors associated with change in sleep.
Conclusion
Poor sleep quality did not cluster with common MS symptoms; and was strongly associated with HRQoL, independent of other symptoms. Improving sleep quality and reducing symptom severity may substantially improve HRQoL in PwMS.
Ethics statements
Patient consent for publication
Ethics approval
This study involves human participants and was approved by Tasmanian Health and Medical Human Research Ethics Committee (reference number 14183). Participants gave informed consent to participate in the study before taking part.
Acknowledgments
We thank Ms Carol Hurst and Dr Kirsty Hawkes for their expertise and attention to detail in collecting and cleaning the data for the MS Nurses and Sleep Study. We sincerely thank all participants of the Australian MS Longitudinal Study for their ongoing support and willingness to complete surveys.
References
Supplementary materials
Supplementary Data
This web only file has been produced by the BMJ Publishing Group from an electronic file supplied by the author(s) and has not been edited for content.
Footnotes
Twitter @DrLauraLaslett
Presented at European Committee for Treatment and Research in Multiple Sclerosis (ECTRIMS), 2021; and Progress in MS Research, Hobart, 2022.
Contributors LLL had full access to all data in the study and takes responsibility for the integrity of the data and the accuracy of the data analysis. Concept and design: CH and IvdM. Acquisition, analysis or interpretation of data: all authors. Drafting of the manuscript: LLL, BVT and IvdM. Critical revision of the manuscript for important intellectual content: All authors. Statistical analysis: LLL Obtained funding: BVT and IvdM.
Funding This study was funded by MS Research Australia.
Competing interests None declared.
Provenance and peer review Not commissioned; externally peer reviewed.
Supplemental material This content has been supplied by the author(s). It has not been vetted by BMJ Publishing Group Limited (BMJ) and may not have been peer-reviewed. Any opinions or recommendations discussed are solely those of the author(s) and are not endorsed by BMJ. BMJ disclaims all liability and responsibility arising from any reliance placed on the content. Where the content includes any translated material, BMJ does not warrant the accuracy and reliability of the translations (including but not limited to local regulations, clinical guidelines, terminology, drug names and drug dosages), and is not responsible for any error and/or omissions arising from translation and adaptation or otherwise.