Article Text

Abstract
Objective To characterise and compare the sociodemographic profiles and the frequency of common comorbidities for adults with chronic migraine (CM) and episodic migraine (EM) in a large population-based sample.
Methods The American Migraine Prevalence and Prevention (AMPP) study is a longitudinal, population-based, survey. Data from the 2005 survey were analysed to assess differences in sociodemographic profiles and rates of common comorbidities between two groups of respondents: CM (ICHD-2 defined migraine; ≥15 days of headache per month) and EM (ICHD-2 defined migraine; 0–14 days of headache per month). Categories of comorbid conditions included psychiatric, respiratory, cardiovascular, pain and ‘other’ such as obesity and diabetes.
Results Of 24 000 headache sufferers surveyed in 2005, 655 respondents had CM, and 11 249 respondents had EM. Compared with EM, respondents with CM had stastically significant lower levels of household income, were less likely to be employed full time and were more likely to be occupationally disabled. Those with CM were approximately twice as likely to have depression, anxiety and chronic pain. Respiratory disorders including asthma, bronchitis and chronic obstructive pulmonary disease, and cardiac risk factors including hypertension, diabetes, high cholesterol and obesity, were also significantly more likely to be reported by those with CM.
Discussion Sociodemographic and comorbidity profiles of the CM population differ from the EM population on multiple dimensions, suggesting that CM and EM differ in important ways other than headache frequency.
- Depression
- epidemiology
- headache
- migraine
- psychiatry
Statistics from Altmetric.com
Introduction
Migraine, a common and disabling disorder, can be subtyped as episodic migraine (EM) or chronic migraine (CM) based on the frequency of headache days. EM refers to a diagnosis of migraine with frequency of headache occurring on fewer than 15 days per month on average. Chronic migraine is listed as a complication of EM in the second edition of the International Classification of Headache Disorders (ICHD-2)1 and is defined as diagnosis of migraine with 15 or more headache days per month over the past 3 months, of which at least eight headache days meet criteria for migraine without aura or respond to migraine-specific treatment.2 CM has been shown to have a prevalence of approximately 1.3–2.4% in population-based studies, but is the most common disorder seen in headache speciality practices.3 4
It has been established that CM can be an especially disabling and burdensome condition. Both clinic and population-based studies have demonstrated that CM, in comparison with EM, results in greater migraine-related disability,5 and impairment in headache related quality of life (HRQoL).6 We previously compared the disability profile, patterns of treatment and healthcare utilisation in a population-based sample of 520 individuals with CM and 9424 with EM from the AMPP 2006 data set.7 Over a 3-month period, more than half (57.4%) of the individuals with CM missed at least 5 days of work or school compared with 24.3% of those with EM (p<0.001). Reduced productivity in household work and chores for at least 5 days over 3 months was reported by 58.1% of respondents with CM compared with 18.2% of respondents with EM (p<0.001). Approximately one-third of the CM sample (36.9%) reported at least 5 days of lost family activities compared with 9.5% of the EM sample (p<0.001). There were also significant differences in healthcare utilisation. The majority of CM sufferers (87.6%) had previously consulted a healthcare professional (HCP) for headache and had at least one healthcare visit in the preceding year (73.6%). Only 20.2% of those with CM reported that they had ever received a diagnosis of CM, chronic daily headache (CDH) or TM. Although almost all CM sufferers meet Headache Consortium Guidelines for preventive treatment,8 only one-third received these treatments.9
Comorbidities of EM have been established in the literature10 and include neurological disorders (eg, stroke and epilepsy),11 psychiatric disorders (anxiety, depression, panic disorder and bipolar disorder),12–14 chronic pain disorders15–17 and other disorders including asthma18 and coronary heart disease.19 In contrast, comorbidities of CM have rarely been studied in population-based samples. Sparse clinic and population studies suggest that increased headache frequency is correlated with increased comorbidity for depression,20 anxiety,21 22 post-traumatic stress disorder,23 chronic pain,15 fibromyalgia23 and other medical disorders.18
Studying comorbidity may provide valuable epidemiological, clinical and biological insights, and help to illuminate distinctions between EM and CM. These comorbidities may contribute to the burden of CM as assessed by productivity loss, impaired HRQoL, healthcare utilisation and emotional burden. In this study, we analysed data from the AMPP study to characterise and compare the sociodemographic profiles and the frequency of common comorbidities for adults with CM and EM in a large population-based sample.
Methods
Study design
The AMPP study is a longitudinal, population-based study based on an annual, mailed questionnaire. The AMPP study was conducted in two phases. In phase 1 (screening), a self-administered questionnaire containing demographic, headache and other related questions was mailed in 2004 to a stratified random sample of 120 000 US households, drawn from a nationwide panel maintained by a US sampling firm. Surveys were returned by 162 562 individuals from 77 879 households. Response rates were similar by gender, geographic region, population density and household income. Of the individual respondents, 30 721 reported at least one severe headache in the past year. From those respondents, a random sample of 24 000 adults (18+ years of age) was selected to participate in Phase 2 (longitudinal follow-up study). Since 2005, these respondents have been surveyed on an annual basis.
Study population
A cross-sectional analysis of the 2005 AMPP study data was utilised to assess differences between two groups of respondents: CM and EM. To be classified as CM, a respondent had to meet ICHD-2 criteria for migraine headache and report an average of 15 or more headache days per month within the past 3 months. Episodic migraine (EM) was defined as respondents meeting ICHD-2 criteria for migraine headache and reporting an average of 14 or fewer headache days per month within the past 3 months.
Description of the survey
The 2005 AMPP survey was a self-administered questionnaire comprising 60 items assessing demographics, headache characteristics, frequency, severity, other necessary information to assign an ICHD-II diagnosis, comorbidities, headache-related burden, impact on work and other aspects of life, health-related quality of life and other information of interest. The survey gathered data on respondents' three most severe types of headaches. The survey has been demonstrated to have a sensitivity of 100% and specificity of 82% for the diagnosis of migraine,24 and sensitivity of 93% and specificity of 85% to the diagnosis of CM.25
Sociodemographics
Sociodemographic data included age, height and weight (for calculation of body mass index (BMI)), gender, race, highest level of education achieved, annual household income, employment status, insurance status and marital status. For most questions such as age, respondents were only allowed to provide a single response. For employment status, respondents were instructed to endorse all applicable responses.
Comorbidities
All conditions (other than depression) were based on self-report of a physician diagnosis (SRPD). Conditions were assessed by respondent endorsement of the item ‘Have you been told by a doctor or any other health professional that you have any of the following health problems?’ Conditions were divided into five categories (psychiatric, pain, respiratory, cardiovascular and other).
Depression was measured both by self-report and using the Patient Health Questionnaire—depression module (PHQ-9),26 a validated measure of Major Depressive Disorder based on DSM-IV criteria.27 The PHQ-9 has two components: assessing symptoms and functional impairment to make a tentative depression diagnosis, and deriving a severity score to help select and monitor treatment. Response options were scored as ‘0’ (not at all), ‘1’ (several days), ‘2’ (more than half the days) and ‘3’ (nearly every day). Total scores (sum of responses) range from 0 to 27, and are categorised into the following levels of depressive severity: none (0–4), mild (5–9), moderate (10–14), moderately severe (15–19) and severe (20–27). Respondents with a score of 10 or more (the highest three categories of depressive symptomology) were categorised as having depression. Like other conditions, self-report of a physician diagnosis of depression (SRPD-depression) was assessed by respondent endorsement of the item ‘Have you been told by a doctor or any other health professional that you have any of the following health problems?’ with ‘depression’ as a response option.
Data analysis
Statistical tests of sociodemographic data included logistic regression, ordered logistic regression, Pearson χ2 test and analysis of variance (ANOVA). Effects of income were adjusted for age and gender, while the effects of education, employment, insurance and marital statuses were adjusted for age, gender and income. All models were parameterised such that the variable listed was predicted from CM and EM in a single model. Reference coding was employed in order to contrast EM and CM in their level, rate of use or probability of the dependent variable. For every analysis, EM was the reference group. A p value of 0.05 was considered statistically significant.
Binary variables (ie, insurance status) were modelled using logistic regression. Ordered variables (ie, education level and income) were modelled using ordered logistic regression. For these effects, ORs indicate how contrasted groups differ in the probability of a higher response category. Normally distributed variables (ie, BMI) were modelled using ANOVA, which contrasts the mean difference in the dependent variable between the contrasted groups. For these tests, the nominal α level employed was 0.05. Nominal variables (ie, marital status) were modelled using the Pearson χ2 statistic, which indicates whether the marginal proportions of the nominal variable are equivalent (or independent) across the contrasted groups.
Comorbid conditions were modelled as dichotomous outcomes in logistic regressions adjusting the EM versus CM contrast for age, gender and income. For these comparisons, the reported CIs and the corresponding p values were presented. Depression was measured both by self-report and through a validated questionnaire. Agreement between the two measures was examined using Tetrachoric correlations.
Results
Description of the sample
Of 24 000 headache sufferers surveyed in 2005, 18 500 respondents aged 18 and older returned questionnaires. Of respondents who provided complete data necessary to assign a diagnosis and headache frequency, 655 respondents met criteria for CM and 11 249 met criteria for EM (table 1). There were no significant differences between the two groups in gender. In comparison with EM, respondents with CM were older (CM 47.7 years, EM 46.0 years; p=0.03), though differences were small. When compared with EM, those with CM reported lower household income levels (p=0.02) with nearly 60% of respondents with CM and 55% of respondents with EM reporting a household income of <$39 999/year. There were no significant differences with regard to the highest level of education, although a greater percentage of EM respondents were in the highest levels of education. There were statistical differences in terms of race (p=0.01), although both CM and EM respondents were more likely to be Caucasian (CM 90.7%, EM 87.4%). Both CM and EM had an above-average BMI of approximately 29 (the upper bound of the ‘overweight’ category) (p=0.07). Those with CM were significantly less likely to be employed full time (CM 37.8% vs EM 52.3%, p<0.001) and nearly twice as likely to be occupationally disabled (CM 20.0% vs EM 11.1%, p<0.001). There was no significant difference with regard to insurance status. CM and EM differed in their reported marital status (p=0.03), although the majority of both CM and EM respondents were married (59.3%; 60.8% respectively).
Sociodemographic profiles of chronic and episodic migraineurs*
Comorbidities
Psychiatric and pain disorders were more often associated with CM than with EM. (figure 1, table 2) We reported both the self-report diagnosis and PHQ-9 results for depression and found a correlation of 0.59 between the two results. Respondents with CM were twice as likely to have depression as measured by the PHQ-9 (CM 30.2% vs EM 17.2%; OR (95% CI)=2.0 (1.67 to 2.40, p<0.001)), and SRPD depression (CM 42.2% vs EM 25.6%; OR (95% CI)=2.0 (1.68 to 2.34, p<0.001)). They were also approximately twice as likely to endorse SRPD-anxiety (CM 30.2% vs EM 18.8%; OR (95% CI)=1.8 (1.51 to 2.15, p<0.001)). Chronic pain disorders occurred with greater frequency in CM than EM (31.5% vs 15.1%; OR (95% CI)=2.5 (2.08 to 2.97, p<0.001)) as did specific pain disorders including arthritis (CM 33.6% vs EM 22.2%; OR (95% CI)=1.7 (1.43 to 2.05, p<0.001)).
Data for all stastically significantly different conditions between chronic migraine (N=655) and episodic migraine (N=11 249)
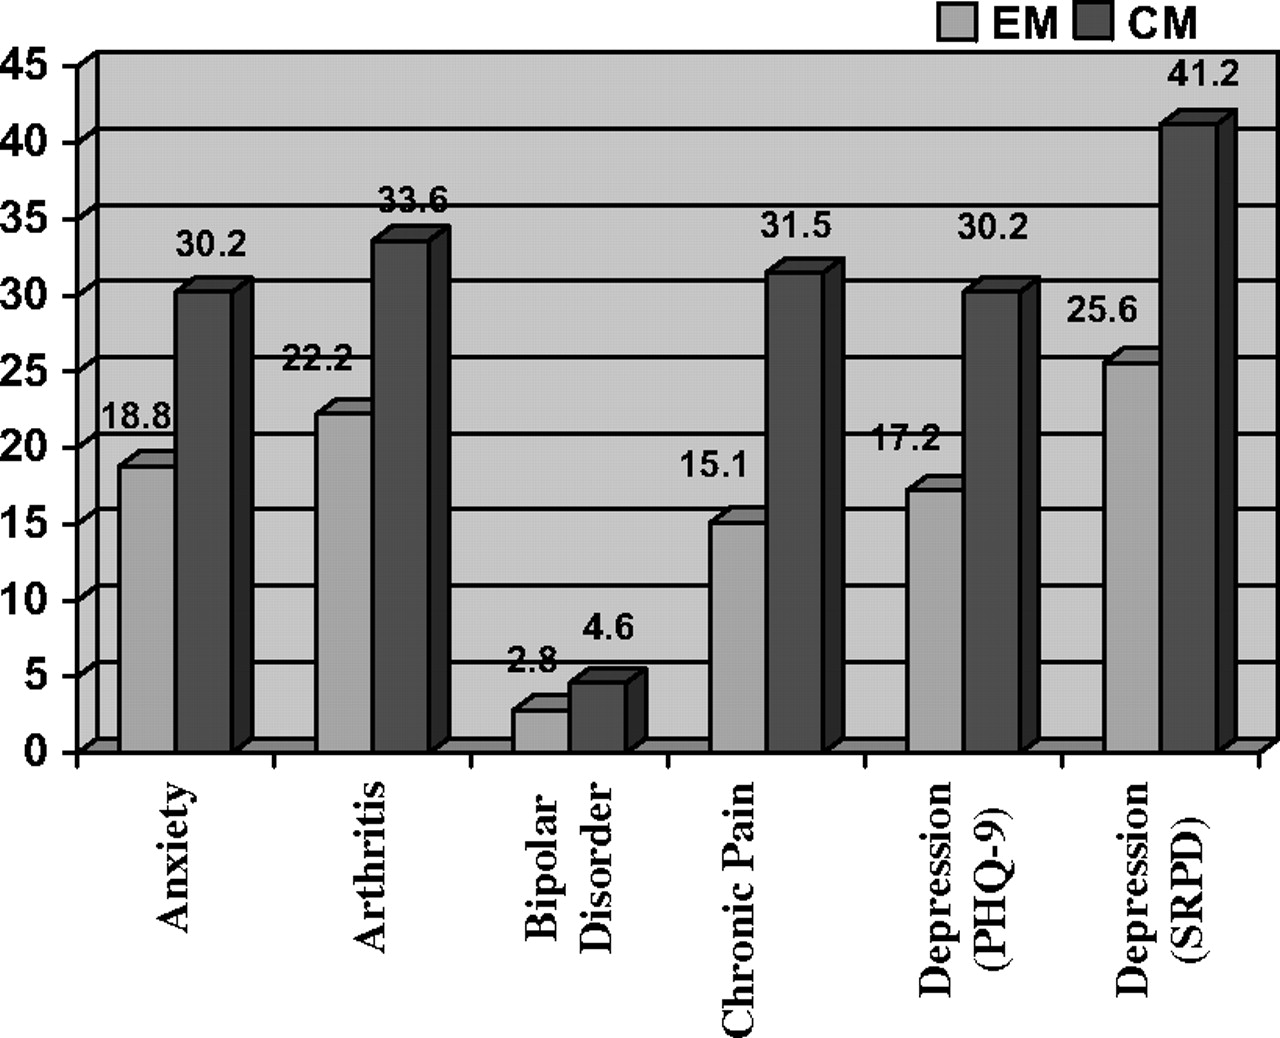
Percentages of participants with statistically significant different psychiatric and pain conditions between chronic migraine (CM) (N=655) and episodic migraine (EM) (N=11 249). PHQ, Patient Health Questionnaire; SRPD, self-report of a physician diagnosis.
Respiratory disorders were also more often associated with CM (figure 2, table 2). Compared with EM, respondents with CM had higher rates of allergies/hay fever (CM 59.9% vs EM 50.7%; OR (95% CI)=1.5 (1.25 to 1.73, p<0.001)), asthma (CM 24.4% vs EM 17.2%; OR (95% CI)=1.5 (1.27 to 1.84, p<0.001)) and sinusitis (CM 45.2% vs EM 37.0%; OR (95% CI)=1.4 (1.18 to 1.63, p<0.001)). Chronic bronchitis (CM 9.2% vs EM 4.5%; OR (95% CI)=2.0 (1.49 to 2.65, p<0.001)), bronchitis (CM 19.2% vs EM 13.0%; OR (95% CI)=1.5 (1.25 to 1.89, p<0.001)) and emphysema/chronic obstructive pulmonary disease (COPD) (CM 4.9% vs 2.6%; OR (95% CI)=1.7 (1.18 to 2.54, p<0.005)) also occurred with greater frequency in CM respondents.

Percentages of participants with statistically significant different respiratory conditions between chronic migraine (CM) (N=655) and episodic migraine (EM) (N=11 249). COPD, chronic obstructive pulmonary disease.
Cardiovascular disorders including heart disease/angina (CM 9.6% vs EM 6.3%; OR (95% CI)=1.4 (1.08 to 1.90, p=0.01)) and stroke (CM 4.0% vs EM 2.2%; OR (95% CI)=1.7 (1.09 to 2.52, p=0.02)) were more often associated with CM than EM (figure 3, table 2). Cardiovascular risk factors including high blood pressure (CM 33.7% vs EM 27.9%; OR (95% CI)=1.2 (1.03 to 1.47, p=0.02)), and high cholesterol (CM 34.2% vs EM 25.6%; OR (95% CI)=1.5 (1.23 to 1.73, p<0.001)) occurred with greater frequency in CM. There were no significant differences in the rates of low blood pressure; however, there were significant differences in the endorsement of ‘circulation problems/cold hands and feet’ (CM 17.2% vs EM 11.4%; OR (95% CI)=1.5 (1.21 to 1.87, p<0.001)).

Percentages of participants with statistically significant different cardiovascular and ‘other’ conditions between chronic migraine (CM) (N=655) and episodic migraine (EM) (N=11 249). CVA, cerebrovascular accident.
Significant differences were not seen between the EM and CM respondents in several of the conditions in the ‘other category’ including cancer, dermatitis/eczema, diabetes, PMS or epilepsy/convulsive disorder. Obesity (CM 25.5% vs EM 21.0%; OR (95% CI)=1.2 (1.03 to 1.50, p=0.02)) and ulcers (CM 15.1% vs EM 8.1%; OR (95% CI)=1.9 (1.52 to 2.40, p<0.001)) occurred with greater frequency in respondents with CM than EM (figure 3, table 2).
Discussion
It has previously been demonstrated that CM is more disabling and burdensome than EM in terms of migraine-related disability,5 HRQoL,6 healthcare costs and treatment utilisation.7 In the current study, we continue to demonstrate the heavy burden of CM by showing poorer economic factors and increased rates of many comorbid conditions. CM respondents were less likely to be employed full time, and more likely to be occupationally disabled. Differences in SES profiles may reflect factors associated with progression from EM to CM. Due to the cross-sectional design of this study, it is not clear if the inverse relationship with SES reflects social selection (downward drift) or social causation (factors associated with low SES that increase risk of progression). This question will be explored in future longitudinal analyses.
Several conditions known to be comorbid with EM were shown to be even more common in the CM population after adjusting for age, gender and income including: psychiatric (depression, anxiety, bipolar disease), respiratory (allergies/hay fever, asthma, COPD, sinusitis), cardiovascular and related risk factors: (angina, HTN, high cholesterol, obesity, cerebrovascular accident), and chronic pain. In fact, depression, chronic bronchitis, and ulcers were approximately twice as likely and chronic pain was 2.49 times more likely in CM compared to EM sufferers.
Our findings of increased ORs for CM are similar to those reported in other population-based studies. Zwart et al20 reported that the odds of depression increased as headache frequency increased. They found that in comparison with control subjects without migraine, the odds of depression in migraine sufferers occurring on seven or fewer days per month was 2.0 (1.6 to 2.5), 7–14 days per month was 4.2 (3.2 to 5.6), and 15 or more days per month was 6.4 (4.4 to 9.3). While we do not have a control sample available for comparison in our study, we found increased OR for depression of 1.9 (1.6 to 2.3) when comparing CM and EM. Both Zwart et al's and our study found similar patterns for anxiety disorders as well. Hagen et al15 reported that the OR for muscoskeletal symptoms (including pain) increased with increasing headache frequency. They reported the following ORs for musculoskeletal symptoms for female migraine sufferers: fewer than seven headache days per month (low frequency EM): OR=1.5 (1.4 to 1.6), 7–14 days per month (high-frequency EM), OR=3.2 (2.9 to 3.5); 15 or more days per month (CM), OR=5.3 (4.4 to 6.5); and for male migraine sufferers: low frequency EM: OR 1.7 (1.6 to 1.8), high-frequency EM, OR=3.2 (2.8 to 3.8) and CM, OR=3.6 (2.9 to 4.5). While we do not have a control sample available for comparison in our study, we also found increased ORs for chronic pain in the CM group compared with the EM group of 2.4 (2.0 to 2.9). The Head-HUNT study20 reported that the association between migraine and respiratory disorders increased with headache frequency and reported the following ORs for the prevalence of respiratory disorders: low-frequency EM: OR=1.6 (1.4 to 1.9), high-frequency EM, OR=2.2 (1.7 to 2.8), CM, OR=2.9 (2.0 to 4.2). We found an OR for allergy or hay fever of 1.5 (1.2 to 1.7) when comparing CM and EM.
The strengths of this study are its large sample size, population-based format and collection of data necessary to assign ICHD-2 headache diagnoses. Limitations of this study include: (1) use of self report rather than objective measures for comorbidities other than depression; (2) possible repercussions of conducting multiple comparisons; and (3) the limitations of a cross-sectional design. In response, our findings were consistent with other major epidemiological studies for rates of the comorbid conditions studied. The use of self report of medical conditions is a common practice in population-based, epidemiological studies. We performed multiple comparisons, which may increase the chance of false-positive findings. Given the multitude of variables upon which EM and CM were contrasted, the probability that some significant p values were observed simply by chance may not be trivial. Because no adjustment was made to the nominal α level, these results should be viewed as descriptive, and emphasis should be placed on the width of the reported CIs rather than the corresponding p values. However, in the case of understudied populations, like CM, exploratory epidemiological studies are a necessary first step in the characterisation and understanding of rare but debilitating pathologies. In addition, several conditions were not found to have significantly different ORs between the EM and CM groups, including low blood pressure, cancer and premenstrual syndrome. Finally, we were limited in the ability to examine causal relationships due to the cross-sectional design. However, we plan to address this by using longitudinal analyses in future results.
Differences in the profiles between the two groups suggest that CM and EM diverge not just in the degree of headache frequency but in these other important areas. These differences might reflect differences in biological risk factors and provide valuable clues to further explore the differences between EM and CM. These differences may also reflect factors associated with progression from EM to CM, which may provide important clinical markers and therapeutic target areas. These findings highlight the importance for clinicians to maintain diagnostic vigilance and provide appropriate treatment or referrals when necessary. When comorbid psychiatric disorders are present with CM, it is important to take both disorders into account in formulating a treatment plan and remain mindful of the negative impact that psychiatric disorders can place on treatment outcomes, adherence and general quality of life.
References
Supplementary materials
Lay Summary 81/4/428
Files in this Data Supplement:
Footnotes
Funding The AMPP is funded through a grant to the National Headache Foundation from Ortho McNeil-Pharmaceuticals. Additional funding for this manuscript was provided by Allergan Pharmaceuticals. CT and AM are full-time employees of Allergan Pharmaceuticals, Irvine, California.
Competing interests Dr Buse has received honoraria from Allergan, Endo, Merck, MAP and Iroko Pharmaceuticals. Dr Lipton has received research grants from Advanced Bionics, Allergan, GlaxoSmithKline, Minster, Merck, Neuralieve, Novartis, OrthoNcNeil, Pfizer, and ProEthics/KOWA, has received honoraria from Allergan, AstraZeneca, GlaxoSmithKline, Merck, Novartis, OrthoMcNeil, and Pfizer, and has consultancy agreements with Advanced Bionics, Allergan, BI, BMS, Cierra, Endo, Neuralieve, Novartis, OrthoMcNeil, Pfizer, Pozen, and ProEthnics/KOWA.
Ethics approval Ethics approval was provided by the Albert Einstein College of Medicine, Bronx, NY.
Provenance and peer review Not commissioned; externally peer reviewed.