Article Text

Abstract
In multiple sclerosis (MS), diffuse degenerative processes in the deep grey matter have been associated with clinical disabilities. We performed a systematic study in MS deep grey matter with a focus on the incidence and topographical distribution of lesions in relation to white matter and cortex in a total sample of 75 MS autopsy patients and 12 controls. In addition, detailed analyses of inflammation, acute axonal injury, iron deposition and oxidative stress were performed. MS deep grey matter was affected by two different processes: the formation of focal demyelinating lesions and diffuse neurodegeneration. Deep grey matter demyelination was most prominent in the caudate nucleus and hypothalamus and could already be seen in early MS stages. Lesions developed on the background of inflammation. Deep grey matter inflammation was intermediate between low inflammatory cortical lesions and active white matter lesions. Demyelination and neurodegeneration were associated with oxidative injury. Iron was stored primarily within oligodendrocytes and myelin fibres and released upon demyelination. In addition to focal demyelinated plaques, the MS deep grey matter also showed diffuse and global neurodegeneration. This was reflected by a global reduction of neuronal density, the presence of acutely injured axons, and the accumulation of oxidised phospholipids and DNA in neurons, oligodendrocytes and axons. Neurodegeneration was associated with T cell infiltration, expression of inducible nitric oxide synthase in microglia and profound accumulation of iron. Thus, both focal lesions as well as diffuse neurodegeneration in the deep grey matter appeared to contribute to the neurological disabilities of MS patients.
- Multiple Sclerosis
- Neuroimmunology
- Iron Deposition
This is an Open Access article distributed in accordance with the Creative Commons Attribution Non Commercial (CC BY-NC 3.0) license, which permits others to distribute, remix, adapt, build upon this work non-commercially, and license their derivative works on different terms, provided the original work is properly cited and the use is non-commercial. See: http://creativecommons.org/licenses/by-nc/3.0/
Statistics from Altmetric.com
Introduction
Multiple sclerosis (MS) has long been considered a disease of the white matter, but more recent studies have highlighted the importance of grey matter demyelination.1–4 Although the presence of lesions in deep grey matter (DGM) nuclei has been described in several studies, current knowledge regarding these lesions is limited.5–7 Data on their incidence in patients at different MS stages, their contribution to the global lesion load compared with that of cortical or white matter lesions and their dominant location within different DGM nuclei remain either controversial or partially incomplete. Recent studies have suggested that oxidative stress, mitochondrial injury and subsequent energy failure are factors that may be involved in plaque formation and neurodegeneration in white and grey matter lesions.8–10 Oxidative injury can be amplified by iron, which accumulates with age in the normal human brain and is liberated from oligodendrocytes and myelin during active demyelination.11 It has been well established that the basal ganglia have the highest iron content in the human brain.12 Since iron has been implicated in the amplification of oxidative injury involved in demyelination and neurodegeneration in MS, a study of lesion formation and neurodegeneration in the basal ganglia could provide insights into the role of iron in tissue injury in the brains of MS patients.11 We performed a systematic study on DGM pathology in MS patients with a focus on the incidence and topographical distribution of lesions, their relationship to inflammation, and the underlying mechanisms of demyelination and neurodegeneration.
Materials and methods
Sample characterisation
This study was performed on paraffin-embedded archival autopsy material from 75 MS cases and 12 controls (table 1). The clinical course was defined by retrospective chart review according to established criteria before the pathological analyses and independent of the pathological analysis by different investigators.13 In 51/75 cases of MS, the available material included the DGM (table 1; see online supplementary table S1). Based on tissue availability, tissue quality, block size and the presence of different DGM nuclei, a DGM subsample of 31 MS cases and 12 controls was selected for detailed immunohistochemical analyses (table 1; see online supplementary table S2). The study is approved by the ethical review committee of the Medical University of Vienna (535/2004 281/12/2012).
Sample characterisation
Neuropathological techniques and immunohistochemistry
We performed detailed neuropathological examinations on multiple tissue blocks (median 2; range 1–15) from various brain regions. In 24/75 MS cases, large hemispheric or double-hemispheric sections were available. In total, 164 routine blocks and 38 hemispheric/double-hemispheric sections were analysed. For precise evaluation of white matter, DGM and cortical demyelination, sections were stained with H&E and Luxol fast blue myelin stain (LFB), and immunohistochemistry was conducted for CD68, proteolipid protein (PLP) and neurofilament. Immunohistochemistry was performed on paraffin sections with a biotin-avidin technique.14 For the detection of non-haeme iron, the diaminobenzidine-enhanced Turnbull blue staining method (TBB) and for the double-labelling of iron with cell type-specific proteins, a modified TBB version was applied.11 For a detailed list of primary antibodies see table 2.
Antibodies used in immunocytochemistry
Quantitative analyses of demyelination and classification of DGM lesions
A quantitative evaluation of the demyelinated areas in the white matter, cortex and DGM was performed on the total sample of 75 MS cases. The sections were overlaid with a morphometric grid, and the area of demyelinated and normal tissue was determined and expressed in mm2. The median percentage of demyelinated cortex, DGM and white matter was calculated. The caudate nucleus, pallidum, putamen, thalamus and hypothalamus were analysed separately. Similar to cortical lesions, DGM lesions were classified into active and inactive lesions.4 ,15 Active lesions showed a rim of activated microglia/macrophages and signs of active demyelination although to a much lesser extent than seen in white matter lesions.16 Inactive lesions were identified as demyelinated areas lacking infiltrates of activated microglia/macrophages and without signs of active demyelination. The DGM of patients with active or inactive lesions were pooled as lesioned DGM. DGM without any signs of demyelination was classified as normal-appearing/non-lesioned DGM.
Quantitative analyses of inflammation, iron deposition and axonal injury
Inflammatory infiltrates in the DGM were assessed by analysing the perivascular accumulation of inflammatory cells (cuffs). In total, 51 MS cases displaying DGM were evaluated for perivascular inflammatory cuffs within the DGM by staining for PLP, H&E, LFB and CD68. A semiquantitative rating was applied in order to evaluate the presence of inflammatory cuffs, with the ratings being none, few or many.
Next, a subsample of 31 MS cases and 12 controls was selected for detailed immunohistochemical analyses on the basis of tissue quality and availability of the respective DGM nuclei in small tissue blocks (see online supplementary table S2). Adjacent slides from these blocks were stained (table 2). LFB and PLP scans from all slides containing DGM lesions in the pallidum, putamen or caudate nucleus were scanned and digitised. In total, 1309 areas of quantification were defined. Images from other stainings were digitised and added as individual layers to this matrix using Adobe Photoshop CS4. Thus, each database value could be traced back to the point it was counted/measured and compared with the corresponding spot in other stainings. In addition, 540 randomly distributed areas in controls and 677 randomly distributed areas for the normal-appearing tissue of MS patients were quantified. All quantifications were performed using one microscope (Olympus Corporation, Tokyo, Japan). Cells were counted within one microscopic field (0.0432 or 0.0576 mm2) in each predefined area of quantification. Photomicrographs were subjected to digital optic densitometry with ImageJ, V.1.43r (National Institutes of Health, Bethesda, Maryland, USA). One method, which was used to quantify the non-haeme iron density, integrates the grey value of the inverted image.11 The second method, which measures the area over which the immunoreactivity exceeds a given threshold, was applied to the p22 and E06 staining.9 In addition, the level of cellular iron in oligodendrocytes, microglia, astrocytes, neurons, neurites and capillaries was analysed. Sections were scanned at 400× magnification within each anatomical region. The cellular iron content was rated in relation to iron-negative cells and scored on a scale from 0 (0%) to 5+ (100%). Thus, at a 3+ rating, 50% of the cells showed the presence of iron while at a 5+ rating, all cells showed the presence of iron. The data were pooled for the normal-appearing deep grey matter (NADGM) and lesioned DGM, as well as for the normal white matter and cortex.
Finally, neuronal loss was evaluated in MS patients and controls. Neurons were identified by their nuclear morphology on H&E stainings. Manual counting was performed in 10 visual fields in control DGM, NADGM and demyelinated MS lesions at a magnification of 400×.
Statistical analyses
Statistical analyses were performed with non-parametric tests. The interdependence of variables was evaluated by a Spearman non-parametric correlation test. The dependence of Expanded Disability Status Scale (EDSS) scores on different variables was evaluated using linear regression analysis. All statistics reporting differences between anatomical structures or lesions were calculated from one mean value per anatomical structure or lesion per patient. Differences between two groups were assessed with Wilcoxon Mann–Whitney U tests. In cases of multiple testing, significant values were corrected with Holm–Bonferroni method or Shaffer's procedure, as appropriate. Differences in the incidence of perivascular cuffs were assessed with Fisher's exact tests. SPSS V.20.0 statistical software system (IBM Corporation, Armonk, New York, USA) was used for calculations. The reported p values were the result of two-tailed tests; p values smaller or equal to 0.050 were considered statistically significant.
Results
Comparison of DGM, cortical and white matter demyelination and the relation of DGM demyelination with the disease course
Similar to cortical and white matter demyelination, DGM demyelination was found in all forms of MS (figure 1A–G). The extent of DGM demyelination revealed no significant differences among the different MS types (figure 1A–D, G). Although cortical demyelination was present in acute-relapsing MS, it was most pronounced in progressive MS (p<0.001) (figure 1A–E). Furthermore, the percentage of white matter demyelination was extensive in progressive MS and acute MS but significantly lower in relapsing/remitting MS (p=0.009) (figure 1A–D, F). Benign/subclinical MS cases revealed very low percentages of cortical, white matter and DGM demyelination. We did not see a significant interdependence between the extent of DGM demyelination and the extent of white matter or cortical demyelination among pooled MS cases or among progressive MS alone (data not shown).

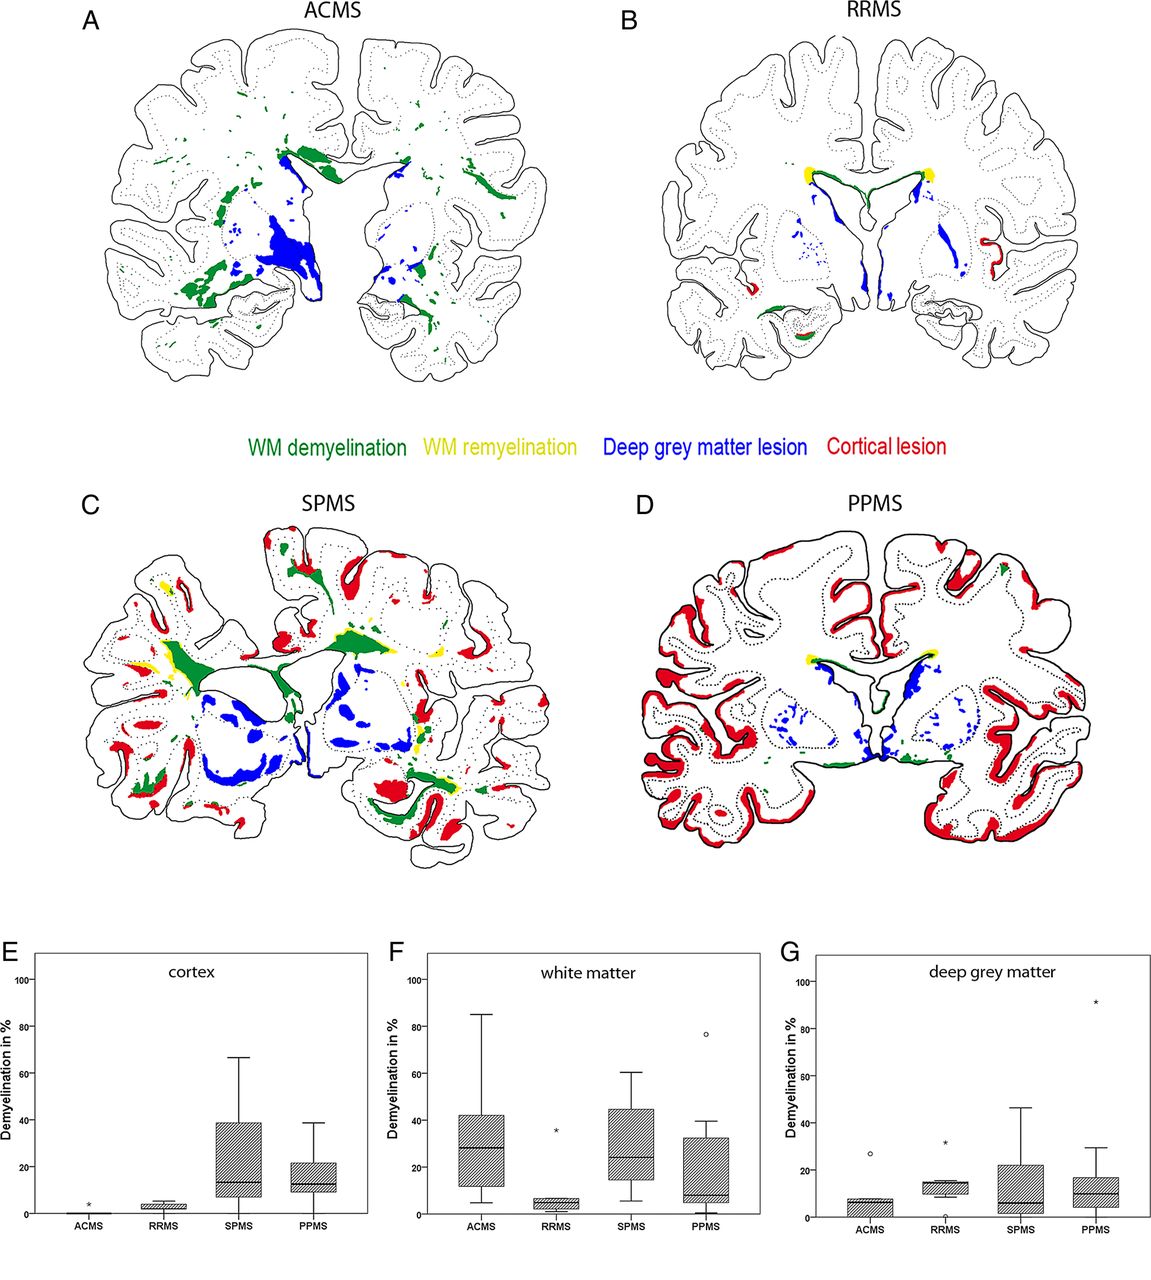
Pattern of cortical, white matter and deep grey matter (DGM) demyelination. The figure shows the patterns of cortical, white matter and DGM demyelination. (A–D) The lesion maps of the distinct types of multiple sclerosis (MS) are shown. Double-hemispheric sections of the presented cases of MS were stained for Luxol fast blue myelin stain, proteolipid protein and H&E, scanned and implemented into a matrix with different layers using Adobe Photoshop CS4. The extent of evaluated demyelination was marked in green for white matter demyelination, in yellow for white matter remyelination, in red for cortical demyelination and in blue for DGM demyelination. The lesion maps represent the disease courses of acute MS (A), relapsing/remitting MS (B), secondary progressive MS (C) and primary progressive MS (D). (E–G) Graphs illustrating the percentage of cortical (E), white matter (F) and DGM (G) demyelination according to MS type. The box plots represent the median value (50th percentile) and the range of percentages. The outliers (values that are between 1.5 and 3 times the IQR) are marked with a circle. The extreme values (values that are >3 times the IQR) are marked with an asterisk. Similar to the cortical and white matter demyelination, DGM demyelination was found among all of the MS types (A–G). Cortical demyelination was present in patients with acute-relapsing MS but was most pronounced in progressive MS patients (p<0.001) (A–E): the median percentage of cortical demyelination was 0.0% (range 0%–3.9%) in acute MS, 2.0% (range 0%–5.3%) in relapsing/remitting MS, 10.8% (range 0.1%–66.5%) in secondary progressive MS and 12.8% (range 0%–36.7%) in primary progressive MS. The percentage of white matter demyelination was extensive in progressive MS patients and acute MS and significantly lower in relapsing/remitting MS patients (p=0.009) (A–D, F): the median percentage of white matter demyelination was 31.3% (range 4.8%–85.5%) in acute MS, 4.9% (range 1.0%–35.7%) in relapsing/remitting MS, 26.2% (range 8.0%–60.4%) in secondary progressive MS and 7.6% (range 0.5%–76.5%) in primary progressive MS. The extent of DGM demyelination revealed no significant differences among the MS types (A–D, G): the median percentage of DGM demyelination was 3.1% (range 0%–26.8%) in acute MS, 14.5% (range 0.2%–31.6%) in relapsing/remitting MS, 6.0% (range 0%–46.4%) in secondary progressive MS and 9.9% (range 0%–91.3%) in primary progressive MS.
When analysed among pooled MS cases, DGM demyelination was most extensive in the caudate nucleus and hypothalamus, followed by the thalamus, putamen and pallidum (p<0.001). A similar pattern was found when evaluated separately among acute-relapsing (figure 2A; p=0.038) and progressive MS (figure 2B; p<0.001) cases. There was no significant difference in the extent of DGM demyelination between female or male patients.

Pattern of deep grey matter (DGM) demyelination in relation to anatomical structure. The figure illustrates the graphs showing the percentages of DGM demyelination in relation to anatomical structures that were separated according to acute-relapsing (A) and progressive multiple sclerosis (B). The box plots represent the median value (50th percentile) and the range of percentages. The outliers (values that are between 1.5 and 3 times the IQR) are marked with a circle. The extreme values (values that are >3 times the IQR) are marked with an asterisk. Among both of the groups, DGM demyelination was most pronounced in the caudate nucleus and the hypothalamus (p=0.038 and p<0.001, respectively).
Although a trend was seen, the dependence of the EDSS score on DGM demyelination alone did not reach significant values. The EDSS scores were dependent on the extent of white matter demyelination when calculated among all MS patients (r=0.4, p=0.039) but not when calculated among progressive MS alone. In progressive MS patients, a significant dependence of the EDSS scores was revealed when including the extent of DGM, white matter and cortical demyelination in one analysis (r=0.2, p=0.041). When cases of acute MS were excluded, EDSS scores were significantly dependent on disease duration (r=0.5, p=0.006). EDSS scores did not depend on age, whether calculated among all MS patients or only among those with progressive MS. Thus, our data showed that DGM lesions were already present in early MS stages and that, in combination with cortical and white matter lesions, they contributed to the clinical deficits.
Inflammation in MS DGM correlates with lesion activity
Evaluation of perivascular inflammatory cuffs in the DGM of MS patients revealed that patients with active DGM lesions showed significantly more perivascular cuffs compared with patients with inactive DGM lesions (p=0.007) or patients without DGM lesions (p=0.007; see online supplementary table S3). Thus, DGM lesions revealed an intermediate inflammatory phenotype compared with white matter and cortical lesions. This view was further supported by a detailed quantitative analysis of T cells and macrophage/microglial infiltration (table 3). In comparison with control DGM, the NADGM of MS patients had a significantly higher density of CD3-positive T cells and inducible nitric oxide synthase (iNOS) expression; this trend was also observed for p22-phox reactivity, but it did not reach statistical significance (figure 3A–E). The most pronounced T cell infiltration was found in active DGM lesions (figure 3B; see online supplementary figure S1). Active lesions were also associated with activation of microglia and macrophages, as reflected by nicotinamide adenine dinucleotide phosphate- oxidase and iNOS expression (figure 3E; see online supplementary figure S1). In inactive lesions, a small but significant increase of T cells was seen, while the numbers of microglia and macrophages, as well as their activation states, were similar to those seen in the normal DGM of controls (table 3). In the NADGM, only ionised calcium-binding adapter molecule 1 (IBA-1)-reactive microglia counts decreased with age at death (r=−0.4, p=0.029). Within the DGM lesions, CD3-positive T cell (r=−0.5, p=0.019), IBA-1 (r=−0.7, p=0.001), iNOS (r=−0.5, p=0.031) and p22-reactive macrophage (r=−0.6, p=0.013) counts decreased with age at death.
Inflammation in the deep grey matter (DGM) lesions of patients with multiple sclerosis (MS) and controls
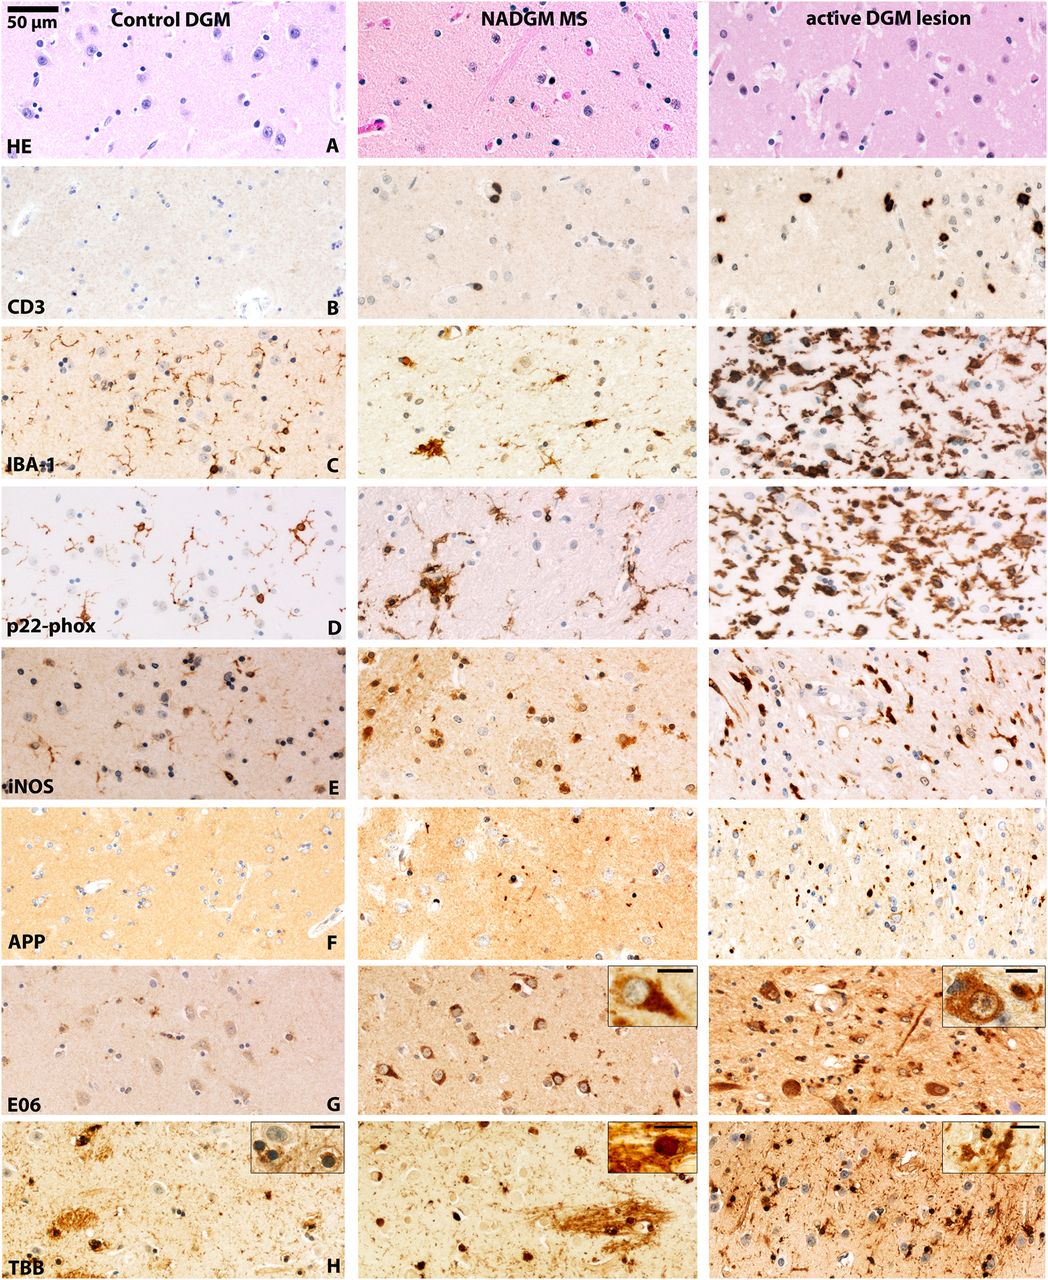
Inflammation, neurodegeneration and iron in the deep grey matter (DGM) of patients with multiple sclerosis (MS). The figure shows photomicrographs of the caudate nucleus of a control patient (left panel), the NADGM (normal-appearing putamen) of a patient with 30 months of relapsing/remitting MS (middle panel) and an active DGM lesion (an actively demyelinating lesion in the putamen/globus pallidus) of a patient who had secondary progressive MS with attacks and a total disease duration of 444 months (right panel). An original magnification of 200× applies for all of the pictures (see 50 µm scale bar), excluding the insets. The scale bar in insets equals 10 µm. (A) H&E staining: reduced neuronal density in the NADGM and active lesioned DGM compared with control DGM. (B) CD3-positive T cell infiltration is absent in control patients and present in the NADGM of MS patients. Perivascular and parenchymal T cells are accumulated in the DGM with active lesions. (C) Ionised calcium-binding adapter molecule 1 (IBA-1) immunoreactivity is found on thin ramified microglial processes in the DGM of control patients and on microglial nodules in the NADGM of MS patients, and is massively increased in active DGM lesion areas. (D) The p22-phox subunit of nicotinamide adenine dinucleotide phosphate (NADPH)-oxidase reacts similarly to the microglial activation marker IBA-1 and is increasingly expressed on microglia in the NADGM with expression peaks in the active lesion areas. (E) In contrast to its expression in the white matter or cortical grey matter, inducible nitric oxide synthase (iNOS) is expressed under baseline conditions in the DGM of control patients. iNOS immunoreactivity is significantly increased in the NADGM of MS patients compared with controls and is mainly expressed on cells with macrophage morphology. The highest expression levels of iNOS are found on microglia in the active lesion areas. (F) Only exceptional amyloid precursor protein (APP)-reactive axonal spheroids are found in the DGM of control patients, whereas they are significantly more frequent in the NADGM of MS patients. The highest counts for APP-positive axonal spheroids are observed in active lesions. (G) E06, which is an oxidised phospholipid-reactive footprint of oxidative stress, is found in an age-dependent manner in neuronal lipofuscin granules within the DGM of control patients. Both neurons and oligodendrocytes, which are reactive for E06, as well as the total E06-reactive area, are significantly enriched in the NADGM of MS patients compared with that of controls. Note that the H&E-depicted neuronal loss in line A is associated with increased neuronal E06 reactivity in the NADGM of MS patients in line G. Inset: Neuron with cytoplasmic E06 reactivity. In active DGM lesions, severe signs of oxidative injury are observed in axons, neurons and oligodendrocytes. Inset: Neuron with cytoplasmic E06 reactivity. Scale bar: 10 µm. (H) In control patients and in the NADGM of MS patients, Turnbull blue-reactive iron is found primarily in oligodendrocytes and myelin fibres. Upon demyelination, iron reactivity decreases and shows a shift towards microglial cells, as shown in the rim of an actively demyelinating DGM lesion. The insets show oligodendrocytes in the DGM of controls and NADGM of MS patients and microglial cells in active DGM lesions. Scale bar size: 10 µm. NADGM, normal-appearing deep grey matter.
Iron deposition and neurodegeneration in the NADGM of MS patients
Compared with the DGM of controls, the NADGM of MS patients showed significantly increased number of amyloid precursor protein (APP)-positive axonal spheroids, as well as neurons or oligodendrocytes with cytoplasmic accumulation of oxidised phospholipids (E06 reactive) (table 4; figure 3F, G). In contrast to focal demyelinated lesions, these changes were diffusely present and of similar extent in all analysed DGM nuclei. The median DGM iron density was elevated by 6.8% in MS patients compared with controls. However, this difference did not reach statistical significance. In the DGM, iron was stored primarily in oligodendrocytes and myelin but was also found to a lesser extent in neurons, microglia or astrocytes (figure 3H and figure 4). In MS patients, the iron content in the NADGM was significantly higher than that in the cortical grey matter and normal-appearing white matter (table 5). Further, levels of all markers for oxidative injury in neurons, axons and oligodendrocytes were increased in the DGM compared with the cortex or white matter (table 5). All evaluated neuronal and glial cell types (oligodendrocytes p<0.001, microglia p<0.001, astrocytes p<0.001, neurons p<0.001 and neurites p<0.001) displayed higher iron contents in MS DGM than in the white matter or cortex.
Neurodegeneration and iron density in deep grey matter (DGM) lesions in patients with multiple sclerosis (MS) and controls
Comparison of deep grey matter (DGM) inflammation, neurodegeneration and iron density in relation to the cortex and white matter
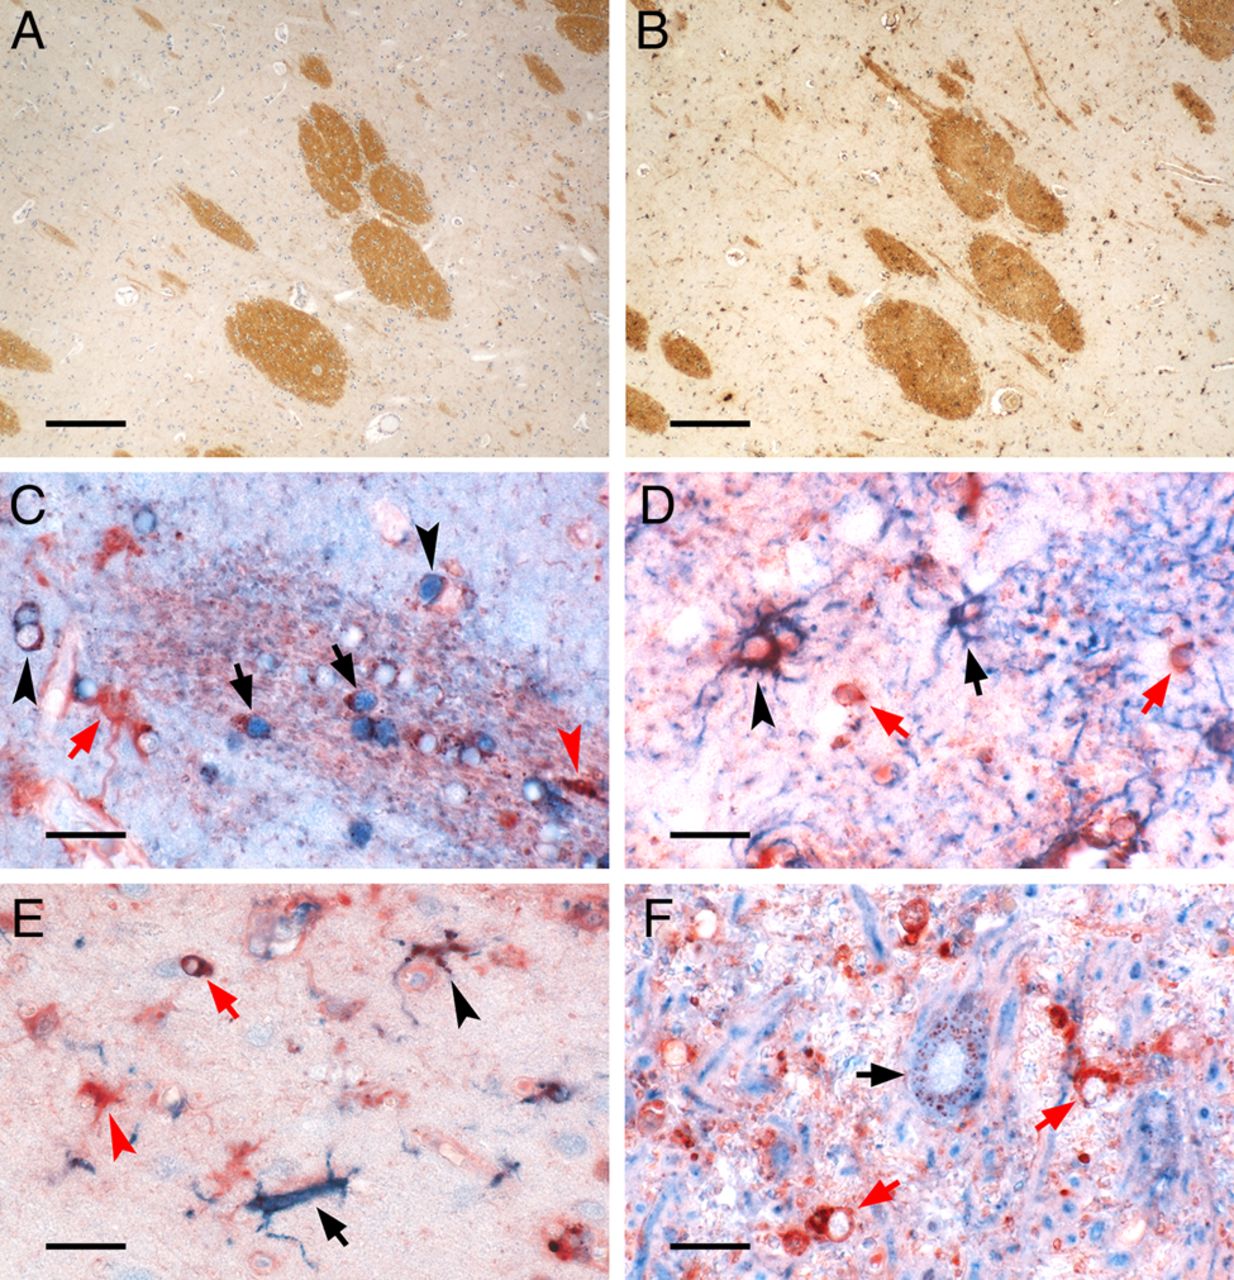
Iron-containing CNS cell types in control deep grey matter (DGM). The figure depicts the iron-containing cell types in the DGM of a human control brain. (A, B) Low magnification micrographs show adjacent sections stained for protolipid protein (A) and iron Turnbull blue (B). Myelinated fibre bundles traverse the DGM of the caudate nucleus and contain high amounts of iron found in oligodendrocytes and myelin. (C–F) High magnification micrographs depict double-labelling of iron (red) with cell type-specific proteins (blue). (C) Double-labelling with the oligodendrocyte marker TPPP/p25 (blue) reveals iron-loaded oligodendrocytes in a myelinated fibre bundle (black arrows) or in the DGM tissue outside this bundle (black arrowheads). Also, cells with astrocyte (red arrow) or microglia morphology (red arrowhead) harbour iron. (D) Double-labelling with astrocytic glial fibrillary acidic protein (blue) shows astrocytes either with high (black arrowhead) or low (black arrow) iron content. Iron-containing cells with oligodendrocytic morphology (red arrows) are also captured. (E) Double-labelling with microglial Iba-1 (blue) reveals both iron-loaded (black arrowhead) as well as virtually iron-free (black arrow) microglia together with iron-loaded cells with astrocytic (red arrowhead) or oligodendrocytic morphology (red arrow). (F) Double-labelling with neuronal MAP-2 (blue) shows typical granular perinuclear iron staining of a DGM neuron (black arrow), as described by Spatz.42 In this region of the globus pallidus, where iron-accumulating neurons are most frequently encountered, the high tissue iron load is also reflected by strong iron staining of cells with oligodendrocyte morphology (red arrows). Scale bars: 200 µm (A, B); 20 µm (C–F).
In control DGM, the extent of oxidative injury and axonal injury significantly increased with age (percentage of E06-reactive area: r=0.7, p=0.01; APP-reactive axonal spheroids: r=0.7, p=0.012). Within the NADGM of MS patients, a similar increase with age was observed (percentage of E06-reactive neurons: r=0.4, p=0.023; axonal spheroids: r=0.5, p=0.011; thin cellular processes: r=0.4, p=0.034; and oxidised DNA-reactive nuclei: r=0.4, p=0.033). The iron loading in DGM nuclei increased with age in controls but not in MS patients.
Next, the extent of neuronal loss in MS DGM was evaluated. The density of neurons was significantly (p<0.001) reduced in the DGM of MS patients (median 86.8 neurons/mm2; range 29.5–165.8 neurons/mm2) compared with controls (median 151.9 neurons/mm2; range 86.8–223.1 neurons/mm2). No significant differences emerged between MS patients without and those having DGM lesions (median 70.3 neurons/mm2, range 56.4–107.6 neurons/mm2). This decrease in neuronal density in MS NADGM was significantly associated with a high EDSS score (r=−0.5, p=0.004) (see online supplementary figure S2).
Iron content and neurodegeneration in the DGM lesions of MS patients
Active demyelination in DGM lesions was associated with profound acute axonal injury (table 4; figure 3F). DGM lesions showed reduced iron content in inactive lesions compared with the surrounding normal-appearing tissue (table 4). Despite the lower iron density within DGM lesions compared with NADGM, all markers of oxidative damage were associated with iron density (E06-reactive axonal spheroids: r=0.5, p=0.030; E06-reactive lipofuscin: r=0.5, p=0.027; E06-reactive oligodendrocytes: r=0.7, p<0.001; percentage of immunoreactive area for E06: r=0.6, p=0.004; and E06-reactive thin cellular processes: r=0.7, p<0.001). Female MS patients displayed higher iron density and higher E06 reactivity within DGM lesions than did male patients (data not shown).
Discussion
MRI studies have provided ample evidence for atrophy in the DGM nuclei of MS patients. Atrophy of the thalamus and caudate nucleus, in particular, together with atrophy of other DGM nuclei has been linked with clinical disease progression.17–22 Furthermore, DGM damage appears to correlate in part with lesion load in other brain areas as well as with neurological disability and cognitive disturbances.17 ,23–25 Whether the changes that have been observed in in vivo imaging studies are due to focal demyelinated lesions or diffuse changes in the normal-appearing grey matter remains unresolved.26 Our study suggested that both focal lesions and diffuse damage of the NADGM contributed to the global DGM damage in MS patients.
In the present study, we found focal demyelinated lesions in all nuclei of the DGM, including the thalamus, hypothalamus, caudate, pallidum and putamen. Lesions were most frequently detected in the hypothalamus and caudate. Prominent hypothalamic lesions have previously been described in MS and, when active, they were found to be associated with decreased corticotrophin-releasing hormone production in affected neurons.27 Thus, active lesions in this area may be related to low activity of the hypothalamic–pituitary axis. It is reasonable to expect that the DGM and basal ganglia, in particular, may affect brain function simply on the basis of their anatomical connections with other brain areas. Thus, they may play a role in cognition and behaviour. A recent study reported an association of thalamic atrophy in MS with cognitive disorders.26 Damage to the pallidum has been related to cognitive dysfunction.23 Although we observed a trend, the dependence of the EDSS scores on DGM demyelination alone did not reach statistical significance in our study. The EDSS scores were associated with DGM neuronal loss in our patients. Our data showed that DGM lesions were present in patients of all MS stages and that, in combination with cortical and white matter lesions, they contributed to clinical deficits. Whether the severity of DGM pathology correlates with the deterioration of cognitive impairment throughout the course of the disease is unknown and requires further investigation.
It is well established that in the progressive stage of MS, inflammation is much more pronounced in the white compared with the grey matter.3 ,14 Active demyelination in cortical lesions is mainly associated with inflammatory infiltrates in the meninges while perivascular and parenchymal inflammation is very low.1 ,28 Profound perivascular inflammation in cortical lesions was found in biopsies of patients with fulminant, early MS.29 Our study showed that focal lesions in the DGM differed from those in other grey matter areas.3 ,30 DGM lesions were found in all stages of MS, also in patients with early MS. We also showed that DGM lesions were associated with perivascular and parenchymal lymphocytic infiltration. Since focal demyelinating lesions in the DGM arise in early MS, they may follow a similar pattern of inflammation as seen in cortical lesions in biopsies at early disease stages. Alternatively, veins in the DGM may be more sensitive for inflammatory responses compared with those in the cortex.
Besides focal demyelinating plaques, we found evidence for diffuse oxidative injury and neurodegeneration in the NADGM of MS patients. This was in line with previous neuropathological studies reporting a profound neuronal loss in the thalamus and other DGM nuclei.7 ,18 We also showed that diffuse neuronal loss in the DGM was associated with clinical disability. The diffuse neuronal loss in the DGM could, in part, be explained by anterograde and retrograde neuronal degeneration due to lesions in connected fibre tracts.31 This view is supported by the partial correlation of DGM atrophy with global lesion load that has been seen in MRI studies.32 In addition, a global inflammatory brain disease, such as MS, may involve a diffuse neurodegenerative process related to the high iron content of the basal ganglia. Ferrous iron may amplify oxidative injury in the presence of oxygen radicals produced by an oxidative burst.33–35 The highest iron content is seen in the human DGM.11 ,12 Furthermore, the iron content in the basal ganglia of MS patients is higher than that in normal control subjects and, as in controls, its levels increase with age.36 ,37 The extensive accumulation of oxidised phospholipids in neurons, axons and oligodendrocytes that we observed was associated with signs of axonal and neuronal degeneration in the NADGM, thereby supporting the idea that high iron content may play a role in the diffuse neurodegeneration of the DGM in MS. Iron in the ageing human brain is mainly stored within ferritin, where it is present in the non-toxic ferric form. In the course of myelin and oligodendrocyte destruction in MS, iron is liberated into the extracellular space and in part converted into the potentially toxic ferrous form.11 This may be particularly important in actively demyelinating lesions. In addition, demyelinated axons are more vulnerable to toxic effects of microglia and potentially to liberated iron. In the normal-appearing grey matter, iron may be liberated in the course of physiological turnover or through damage to single myelinated fibres or oligodendrocytes, which does not result in overt demyelination. If iron plays a role in the amplification of tissue injury in the DGM of MS patients, one would expect that focal demyelinating lesions would be seen frequently and would be much more destructive than in other areas of the brain of MS patients. However, this was not the case. It could be speculated that increased oxidative injury in MS NADGM results in the upregulation of molecular pathways of antioxidant defence in these regions. As an example, Nrf2, a transcription factor that regulates the expression of molecules with antioxidant functions, is expressed in MS lesions.38 Whether in MS this defence pathway is upregulated in the DGM compared with other brain regions requires future investigation. Furthermore, microglia are involved in the uptake of extracellular iron and are implicated in upregulating iNOS upon iron loading.39 Whether this microglial iNOS expression in the NADGM is neuroprotective or contributes to oxidative injury is currently unclear.40
In conclusion, we show that the DGM is profoundly involved in the disease progression of MS patients and appears to contribute significantly to the global accumulation of disability in MS patients. In addition to focal demyelination, a diffuse neurodegenerative process occurs in the DGM and is associated with clinical disability. This process may be related to increased oxidative injury and anterograde or retrograde degeneration in a brain area with exceptionally high iron content.
Acknowledgments
We would like to thank Marianne Leisser, Ulrike Koeck and Angela Kury for expert technical assistance.
References
Supplementary materials
Supplementary Data
This web only file has been produced by the BMJ Publishing Group from an electronic file supplied by the author(s) and has not been edited for content.
Files in this Data Supplement:
- Data supplement 1 - Online supplement
Footnotes
-
LH and CS contributed equally to this study.
-
Contributors Conception, design and interpretation of data: JMF, HL, LH, NG, CS. Collection of data: all authors. Drafting of paper: JMF, HL, LH, NG. Approval of final version: all authors.
-
Funding This work was supported by the Austrian Science Fund (FWF, Project P24245).
-
Competing interests None.
-
Ethics approval Ethical committee of the Medical University of Vienna (535/2004 281/12/2012).
-
Provenance and peer review Not commissioned; externally peer reviewed.
Linked Articles
- Editorial commentary