Article Text

Abstract
Objective Investigate the incidence of multiple sclerosis during 1953–2013 and estimate the prevalence rate of MS on 1 January 2003 and 2013 in Hordaland County, Western Norway.
Methods All patients with onset of disease in Hordaland 1953–2013 were identified in files from previous studies until 2003 and from patient records at the departments of Neurology, Haukeland University Hospital and Haugesund Hospital during 2003–2013. 1558 patients were assessed and 1402 of these were included, of whom 1035 were alive and living in Hordaland at prevalence day 1 January 2013. Annual incidence rates were calculated for 1953–2013.
Results On 1 January 2003, the crude prevalence rate was 191/100 000 population and on 1 January 2013, the crude prevalence rate was 211.4 (95% CI 198.3 to 224.2) per 100 000; 270.9 (95% CI 250.6 to 292.3) for women and 151.8 (95% CI 136.8 to 167.9) for men. Prevalence peaked at ages 55–59 years for women and 60–64 years for men. The annual incidence rate increased from 1.9 (95% CI 1.2 to 2.6) per 100 000 during 1953–1957 to 7.2 (95% CI 6.0 to 8.5) during 1978–1982 and to 8.5 (95% CI 7.3 to 9.7) during 2003–2007, thus indicating a stabilising incidence over the past 35 years. The female/male ratio ranged from 1.2:1 to 1.8:1 (p=0.381) during the period.
Conclusions Stabilising rather than increasing incidence combined with the stable female/male ratio are indicative of non-fluctuating environmental factors in a geographical area otherwise characterised by lack of vitamin D effective sun exposure. The rising prevalence of MS could result from improved survival and follow-up methodology.
- MULTIPLE SCLEROSIS
- EPIDEMIOLOGY
This is an Open Access article distributed in accordance with the Creative Commons Attribution Non Commercial (CC BY-NC 4.0) license, which permits others to distribute, remix, adapt, build upon this work non-commercially, and license their derivative works on different terms, provided the original work is properly cited and the use is non-commercial. See: http://creativecommons.org/licenses/by-nc/4.0/
Statistics from Altmetric.com
Background
Long-term follow-up studies on prevalence and incidence of multiple sclerosis (MS) for more than five decades are rare and has previously only been conducted in a 95-year follow-up study in Olmsted County, Minnesota, USA,1 and a 50-year follow-up study from Hordaland County, Western Norway.2 Follow-up on the incidence and prevalence of MS are important to study time trends that can contribute to analyses of environmental risk factors for MS and evaluate long-term benefit from disease-modifying treatment of the disease.
Previously, studies have reported rising prevalence of MS in Norway.2–6 We have reported more than a sevenfold increase of MS prevalence (20 to 150 per 100 000) in Hordaland County during 1953 to 2003 and an increasing incidence until 1978–1982, followed by a high but stable incidence during the past 30 years.2 ,7 The cause for the rise in prevalence is not fully understood and further investigation of whether the prevalence is still rising despite a stabilising incidence rate may increase our understanding of the disease.
We, therefore, present data on a 60-year follow-up of incidence and prevalence of MS in Hordaland County, Western Norway. We aimed to investigate the incidence of MS during 60 years from 1953 to 2013 and to estimate the prevalence rate of MS on 1 January 2003 and 2013 in Hordaland County, Western Norway.
Methods
Hordaland County is located in Western Norway, between 59° 30′and 61° north, and is characterised by a long coastal line and inland area with numerous fjords, mountains and valleys. The population is mainly occupied in industry, including oil and gas production, commerce and service, fisheries and agriculture. The population in Hordaland County increased from 317 384 on 1 January 1953 to 441 660 on 1 January 2003 and to 490 570 on 1 January 2013. Nearly half of the population lives in the administrative centre in the city of Bergen and half of the population lives in small villages and rural areas. The migration rate ranged between 3.6% and 4.7% during 1973–2007, and between 8.7% and 9.7% during 2008–2012. During 2001–2009, the population grew by 1% annually, mainly due to immigration.
Data collection and study population
Data files from previous epidemiological studies conducted during 1953–2003 were available2 ,8–11 and patients’ records were reassessed according to mortality and place of residence on the prevalence day, 1 January 2013. Additional patients diagnosed after 2003 were identified from the patient records at the Department of Neurology at Haukeland University Hospital, Bergen. The department was established in 1953 and is responsible for the neurological health service to residents in central and northern regions of Hordaland County. Owing to administrative changes, patients living in the southern regions of Hordaland County have been referred to Haugesund Hospital during the last decade. Thus, a total of 37 patients were identified from patient records at the department of Neurology at Haugesund Hospital. All patients with MS in Hordaland County are referred to these two neurological departments for diagnostic cerebrospinal fluid (CSF) analysis and disease-modifying treatment. Thus all patients diagnosed with MS in Hordaland County are therefore most likely included in the sample. All patients were referred from general practice and private neurological practices to the hospital for diagnostic evaluation, including MRI and CSF analysis. Statistics Norway (http://www.ssb.no) and the National Population Registry provided data on the patient’s place of residence at the time of disease onset and on prevalence day, as well as the total population in the county.
All patient records were reviewed and scrutinised for data on gender, age, place and year of birth, course of disease at onset, year of disease onset and year of diagnosis. Onset of disease was defined as the year of the first symptom(s). Time of diagnosis was defined as the year a neurologist made the diagnosis. The clinical course at onset was classified as relapsing–remitting or primary–progressive MS. Onset from 1953 were classified according to the diagnostic criteria of Poser12 and onset from 2003 onwards were classified according to the revised (2010) diagnostic criteria of McDonald.13 Patients initially diagnosed with MS who later received another diagnosis were excluded from the study. Patients with onset of MS during 1953–2013 while living in the county of Hordaland, who had moved out of the county prior to the prevalence day were included in the incidence analyses, but excluded from the prevalence analyses. Patients still alive and living in the county with MS onset prior to 1953 were excluded from the incidence analyses, but included in the prevalence analyses. Similarly, all patients with onset outside Hordaland County and who later immigrated were excluded from the incidence analyses, but included in the prevalence rates.
When calculating the prevalence in 2013, patients who had emigrated or died between 2003 and 2013 were excluded.
The study was approved by the Regional Committee for Medical and Health Research Ethics in Western Norway.
Prevalence and incidence
The prevalence rate was defined as the total number of patients with MS with definite13 or probable MS12 per 100 000 inhabitants living in Hordaland County on 1 January 2013. The crude annual incidence rate of MS was defined as the number of patients with onset of disease per 100 000 inhabitants per year.
Statistical analysis
Calculation of CI for prevalence and incidence as well as the test for trend in incidence were based on the assumption that the number of cases each year follows a Poisson distribution.
Given the heavily skewed distribution, the Mann-Whitney test was used to test for difference in time from onset of disease to diagnosis. In the other bivariate comparison, the Student t test was used. One way analysis of variance was used to test difference in age at onset between different diagnostic classifications. The statistical software packages IBM SPSS Statistics V.21 and StatXact 9 (Cytel Software, Cambridge, Massachusetts, USA) were used to perform the analysis.
Results
A total of 1558 patients had received a diagnosis of MS during 1953–2013 at the departments of Neurology at Haukeland University Hospital and Haugesund Hospital. On prevalence day, 1 January 2013, a total of 393 were deceased and 130 were not resident in Hordaland County, leaving 1035 still alive and living in the county. A total of 1402 patients had onset of MS when living in Hordaland County.
A total of 493 (46.7%) were classified as definite MS and 112 (10.8%) were classified as probable MS according to Poser criteria, and 430 (41.5%) were classified as definite MS according to McDonald criteria (table 1).
Demographic and clinical data for patients with multiple sclerosis on prevalence day, 1 January 2013
Relapsing–remitting course at disease onset was detected in 950 (91.8%) and primary progressive course was found in 85 (8.2%). The mean age at onset was 31.8 years; 31.7 years for patients with definite MS, 33 years for patients with probable MS according to Poser criteria12 and 31.5 years for patients diagnosed with MS according to McDonald’s criteria13 (p=0.97). The female proportion was 63.8% and the F/M ratio was 1.8:1 on prevalence day, 1 January 2013.
The average time interval between onset and diagnosis of MS declined from median 21 (range 9–40) years during 1953–1957 to 1.3 (range 0–9) years during 2003–2007, (p<0.0001) in the prevalence cohort (figure 1).

Time delay from onset of disease until diagnosis of multiple sclerosis, in 5-year periods 1953–2013.
Since the last follow-up,2 a total of 135 patients were included with onset prior to 2003 and diagnosed with MS during 2003–2013. By including these patients and patients from Haugesund Hospital the 2003-prevalence increased from 1502 to 191/100 000 (N=842). A total of 142 patients immigrated to Hordaland during 2003–2013 of whom 112 had disease onset prior to 2003. A total of 179 patients emigrated, of whom 49 were deceased by 2013 and 140 had disease onset prior to 2003.
Prevalence
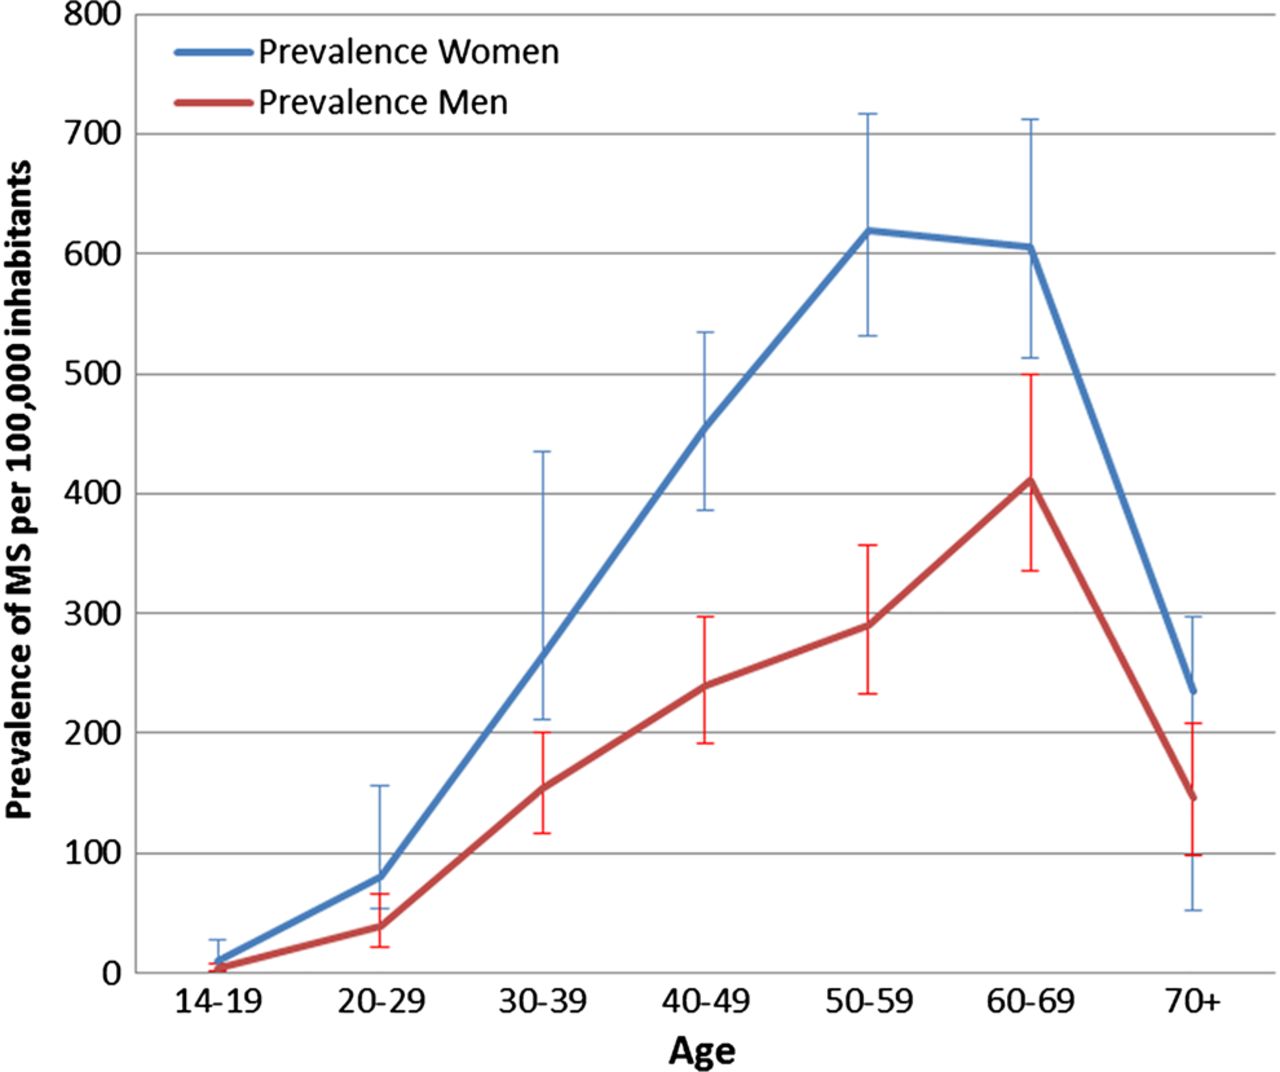
On 1 January 2013, the crude prevalence rate was 211.4 (95% CI 198.3 to 224.2) per 100 000 inhabitants, 270.9 (95% CI 250.6 to 292.3) for women and 151.8 (95% CI 136.8 to 167.9) for men. The peak age-specific prevalence appeared highest in women aged 55–59 years and in men aged 60–64 years (figure 2).

Age-specific prevalence rates of multiple sclerosis (MS) by gender on 1 January 2013.
Compared with the 2003 follow-up,2 the prevalence is higher in older ages, age 60–64, in 2013 (figure 3). Since 1957, the prevalence in Hordaland County increased from about 207 to 60 in 19839 and to 211/100 000 in 2013. The 2003 prevalence increased from 150 reported in the previous follow-up2 to 191 in the present study.
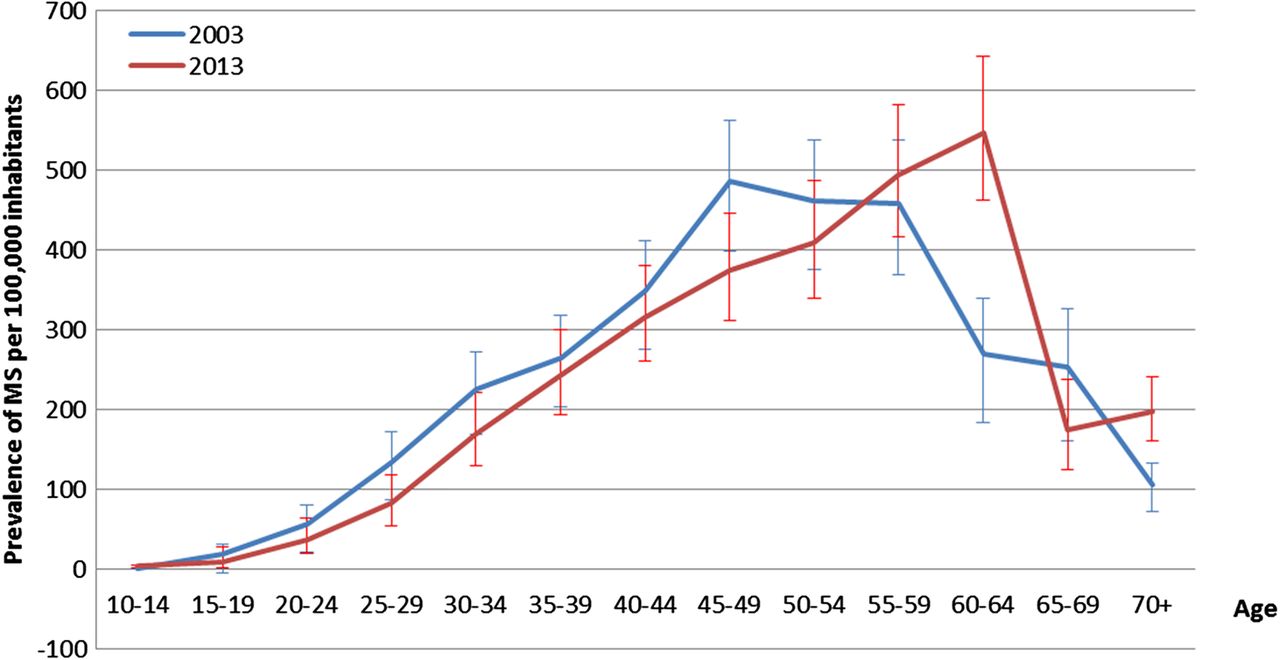
Age-specific prevalence rates of multiple sclerosis (MS) in 2003 and 2013.
Incidence
The annual incidence rate increased significantly during the study period analysed by 5-year intervals (p<0.0001) from 1.9/100 000 inhabitants during 1953–1957 to 8.2 during 2003–2007, followed by a decline to 5.2/100 000 during 2007–2013. The incidence increased during the first 25 years (p=0.00019), until stabilising at a high level, ranging from 7.2 to 8.5 since 1978 (p=0.20; figure 4). The incidence increased in both genders and the overall sex ratio at onset did not significantly change during the study period, ranging from 1.2:1 to 1.8:1 (p=0.381).

Total crude annual incidence rates per 100 000 populations of multiple sclerosis (MS) with onset 1953–2013 in 5-year periods by gender.
Discussion
We provide a 60-year follow-up of incidence and prevalence of MS in Hordaland County, Western Norway, showing an increasing prevalence over the total period, but a stabilising incidence since 1978.
The prevalence increased 10-fold from 20/100 000 in 1963 to 211 (95% CI 198.3 to 224.2) per 100 000 in 2013. The prevalence rate of 211/100 000 inhabitants was higher than a recent prevalence report of 186/100 000 in Western Norway.3 These diverging results are most likely a result of the limitation of using data from the National Patients Registry included in this recent nationwide study.3 Previous Norwegian studies using hospital records (as in our study) have reported MS prevalence rates of 170/100 000 in the south-eastern county of Oslo,5 180/100 000 in the southern county of Vest-Agder6 and 185.6/100 000 in the eastern county of Oppland.14 The prevalence rate in Hordaland was, thus, similar to the latest report from the UK,15 but higher than reported in Denmark,16 Sweden17 and South East Wales,24 and lower than reports from Orkney, Shetland and Aberdeen City,36 all geographical areas close to Hordaland County.
Comparing MS prevalence in Hordaland County on prevalence day 1 January 2003 calculated in 20032 at 150/100 000 with the present study including follow-up until 2013 giving 191/100 000, highlights the importance of the sample collection termination day, in order to calculate the valid prevalence. Thus, the follow-up identified undiagnosed patients who had symptom onset prior to 1 January 2003 and illustrates that the prevalence is rising and most interestingly, that the date for study termination has a major impact on prevalence. The rise in prevalence is a consequence of the underestimated prevalence reported previously2 due to the time delay between onset and diagnosis. However, the time delay between onset and diagnosis is decreasing and consequently, the methodological issue of underestimated prevalence will probably be reduced in future studies.
The incidence of MS in Hordaland County has in previous studies increased from 0.2/100 000 in 1935,10 to 0.67/100 000 in 195111 and to 4.7/100 000 in 1978–1982.9 However, in the present long-term follow-up study, we also identified patients with disease onset years prior and thus higher incidence rates of 1.8/100 000 during 1953–1957, 6.9/100 000 during 1978–1982 followed by a stable high level of approximately 7–8/100 000 during later years. Thus, this tendency towards increase in incidence rates and prevalence rates of MS, presented in the repeated studies we provide in this paper, demonstrates the necessity of repeated surveillance to study valid time trends of MS incidence rates.23
The incidence of 8.5/100 000 inhabitants during 2003–2007 was similar to reports from previous reports on MS frequency in the southern6 and eastern14 parts of Norway, confirming Norway as a high risk area of MS without any evidence of a latitude gradient.3
We showed relatively stable incidence rates during the past three decades. However, since we reported the year-of-onset incidence, we observed a drop in rate probably due to delayed diagnosed cases for the latest 5-year period. The stable incidence rate was consistent with reports from Olmstead County, Minnesota, USA,1 and Canada,18 but was in contrast to a downward incidence trend in the Orkney Islands,21 the Faroe Islands19 and in Gothenburg,22 and the increased incidence trends in Denmark,23 South East-Wales,24 Northeast Ireland25 and another Canadian population.26
The rise in prevalence of MS could partly be explained by the historical large increase in incidence of the disease until 1978–1982. The early increase in prevalence might be explained by the increase in incidence the first 3–4 decades. Also, owing to the onset of disease approach to incidence and prevalence estimations, and the time delay between onset and diagnosis, the prevalence has a delay up to about mean 7–9 years until the 1990’s and hence, increase in incidence is followed by a parallel increase in prevalence after almost a decade. Because of the retrospective year of onset approach to incidence, the prevalence is catching up later. However, the continued recent increase in prevalence was not associated with a parallel increase in incidence. Thus some of the increase in prevalence in recent years may be explained by improved diagnostics especially with the introduction of MRI in the 1990s and the ability to identify younger patients and more benign disease living longer with the disease. The diagnostic criteria which has evolved from the early clinically based criteria12 to MRI-grounded criteria,27 recently revised,13 have improved case ascertainment throughout the study period. Systematic use of the revised diagnostic criteria of McDonald with frequent use of repeated MRIs may lead to an increased diagnosis of patients with vague symptoms due to a benign disease. However, the diagnosing of more benign cases had probably a limited impact on prevalence, leaving increased survival as the most likely explanation to our findings. Improved survival in MS, possible due to more frequent use of advanced disease-modifying therapies,28 was probably the most important factor related to the observed increase in prevalence. The importance of improved survival on the observed increase in prevalence was also supported by the shift towards an older age distribution of the present 2013 prevalence cohort compared with the prevalence reported in the 2003 study.2 A change in age distribution has also previously been reported from Canada and the UK.15 ,18
Given the stable incidence rate, the higher ages in the cohort probably relate to improved survival either due to disease-modifying therapies or attributed to a general increase in life expectancy during the last decades. To determine the impact of treatment on survival, standardised mortality ratio calculations comparing MS to the general population in Norway are needed.29
In contrast to several reports of increasing female to male ratios in MS24 ,30 ,31 the overall rate has been stable in Hordaland County throughout the past six decades. Our follow-up data showed a stable sex-ratio throughout the period and does not indicate gender-specific environmental risk factors which affect women more than men.
Explaining the stable incidence rates by changes in environmental risk factors for MS seems challenging. Epstein-Barr virus20 infections are stable, but cigarette smoking32 has declined during the last decades (https://www.ssb.no/statistikkbanken/selectvarval/saveselections.asp) and may have reduced the risk of MS. However, both consumption of dietary salt intake33 through processed food and use of sun-protection products,34 which may lead to reduced serum levels of vitamin D35 has increased in the past three decades. These may be two other factors associated with increased risk of MS.
Improved case ascertainment during the past six decades can probably explain some of the increased prevalence found in the present study. This was indicated by the steady decline in time delay between onset and diagnosis of MS. Revised diagnostic criteria,13 focusing on active use of MRI to define disseminated disease in time and space, combined with improved disease-modifying treatments has increased the diagnostic awareness among physicians and patients, and have therefore, important impact on this time-delay.
Our study provides comprehensive data on MS prevalence and incidence during 60 years and confirms Norway as a high risk area for MS. The steady increase in MS incidence from the 1950s followed by a stable high incidence during the past three decades, calls for further studies focusing on environmental factors to explain this pattern. The tendency to identify more MS cases at follow-up, demonstrated in this study, indicates that previous studies with data collection close to the prevalence day might have underestimated the prevalence of MS. Thus future studies on prevalence of MS should explore the occurrence of disease with a prolonged follow-up of several years after prevalence day in order to estimate the true prevalence of disease.
Acknowledgments
The authors thank Professor Jan-Petter Larsen, Professor Marit Grønning, Dr Kaur Kamaljit, Dr Kjetil Bjørnevik and Dr Marianna Cortese for contribution to the data collection.
References
Footnotes
Contributors NG conceived, designed and performed analyses. NG, KMM collected data and drafted the manuscript. JHA provided statistical advice. KMM, JHA, HMBL performed critical revisions of the manuscript for important intellectual content.
Competing interests KMM has received speaker honoraria, travel support and/or unrestricted research grants from Almirall, Allergan, Bayer Pharma, Biogen Idec, Genzyme, Sanofi Aventis, Novartis and Merck Serono.
Ethics approval The Regional Committee for Medical and Health Research Ethics in Western Norway.
Provenance and peer review Not commissioned; externally peer reviewed.