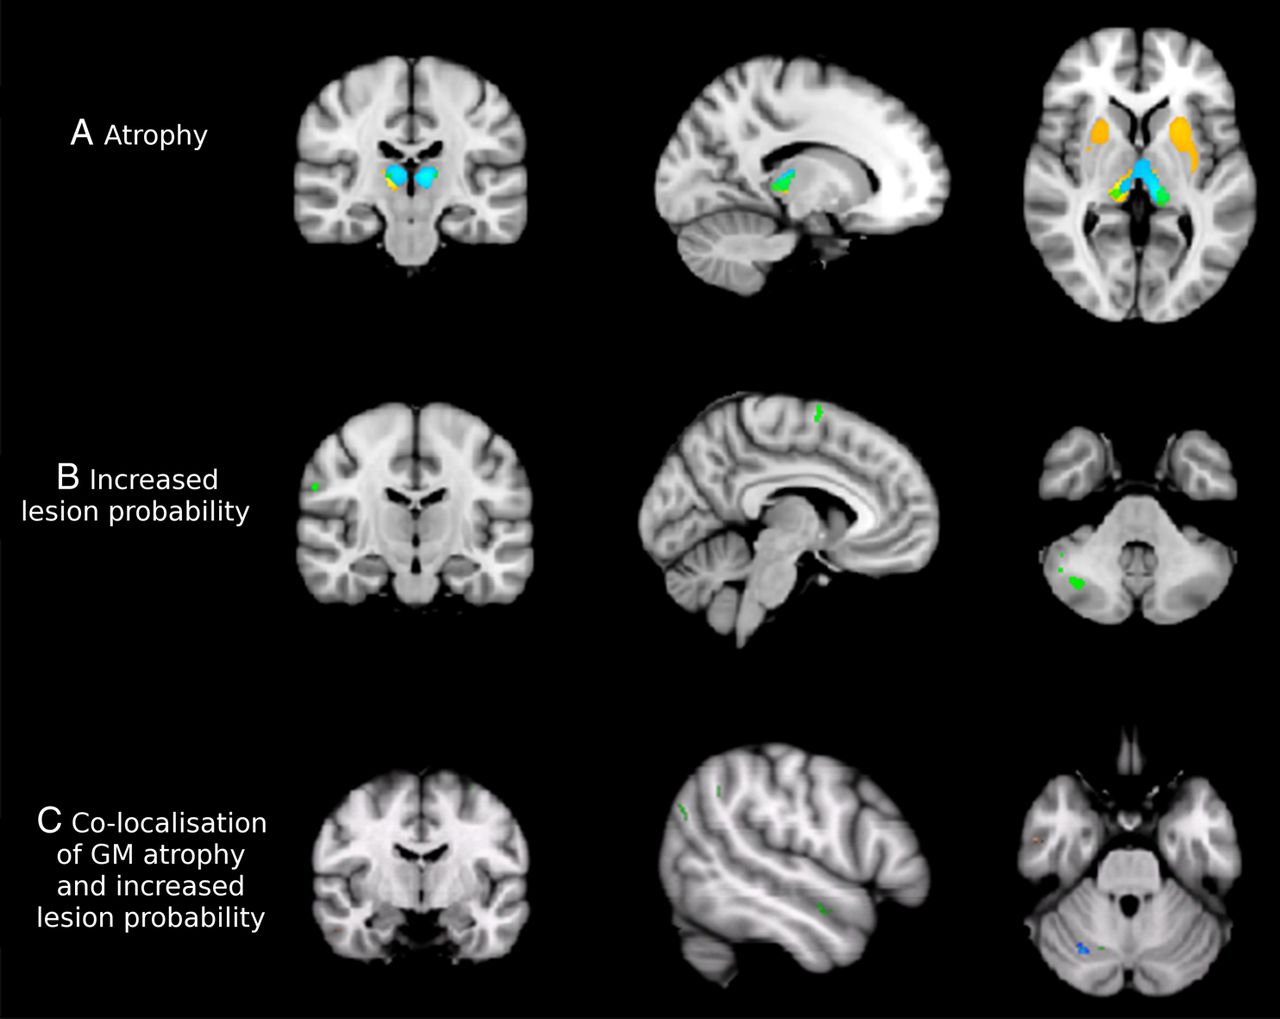
Grey matter (GM) pathology in MS. The progressive primary multiple sclerosis (PPMS) group is presented in green, relapsing–remitting multiple sclerosis (RRMS) in blue and secondary progressive multiple sclerosis (SPMS) in orange on the cohort-specific MNI-space template. (A) All multiple sclerosis (MS) subtypes show pronounced deep volume loss compared to controls at p<0.05 (family wise error, FWE corrected). In particular, patients with relapse onset have severe deep atrophy. Coordinates of sections are x=−14, y=−22, z=3. (B) Areas showing clusters of increased GM lesion probability in patients compared to controls at p<0.001, uncorrected. The RRMS group did not show clusters of increased GM lesion probability at this threshold, while SPMS showed increased cerebellar lesion load and PPMS had clusters of increased lesion probability throughout the cerebral and especially the cerebellar cortex. Coordinates of sections are x=−5, y=−13, z=−39. (C) Areas showing a significant correlation of atrophy and increased probability of a GM voxel being lesional (at p<0.01, uncorrected) in all patient groups together. Coordinates of sections are x=29, y=−66, z=−28.


Share this article
Click the icon of the social media platform on which you would like to share this article.


