Article Text

Abstract
Objective To determine the prevalence of hypermetabolism, relative to body composition, in amyotrophic lateral sclerosis (ALS) and its relationship with clinical features of disease and survival.
Methods Fifty-eight patients with clinically definite or probable ALS as defined by El Escorial criteria, and 58 age and sex-matched control participants underwent assessment of energy expenditure. Our primary outcome was the prevalence of hypermetabolism in cases and controls. Longitudinal changes in clinical parameters between hypermetabolic and normometabolic patients with ALS were determined for up to 12 months following metabolic assessment. Survival was monitored over a 30-month period following metabolic assessment.
Results Hypermetabolism was more prevalent in patients with ALS than controls (41% vs 12%, adjusted OR=5.4; p<0.01). Change in body weight, body mass index and fat mass (%) was similar between normometabolic and hypermetabolic patients with ALS. Mean lower motor neuron score (SD) was greater in hypermetabolic patients when compared with normometabolic patients (4 (0.3) vs 3 (0.7); p=0.04). In the 12 months following metabolic assessment, there was a greater change in Revised ALS Functional Rating Scale score in hypermetabolic patients when compared with normometabolic patients (−0.68 points/month vs −0.39 points/month; p=0.01). Hypermetabolism was inversely associated with survival. Overall, hypermetabolism increased the risk of death during follow-up to 220% (HR 3.2, 95% CI 1.1 to 9.4, p=0.03).
Conclusions and relevance Hypermetabolic patients with ALS have a greater level of lower motor neuron involvement, faster rate of functional decline and shorter survival. The metabolic index could be important for informing prognosis in ALS.
- amyotrophic lateral sclerosis
- hypermetabolism
- lower motor neuron
- survival
- progression
This is an open access article distributed in accordance with the Creative Commons Attribution Non Commercial (CC BY-NC 4.0) license, which permits others to distribute, remix, adapt, build upon this work non-commercially, and license their derivative works on different terms, provided the original work is properly cited and the use is non-commercial. See: http://creativecommons.org/licenses/by-nc/4.0/
Statistics from Altmetric.com
Introduction
Amyotrophic lateral sclerosis (ALS) is a rapidly progressing and fatal neurodegenerative disease. Although it is clinically characterised by the irreversible degeneration of upper cortical and lower spinal motor neurons, there are several reports of metabolic perturbations in ALS.1 2
Hypermetabolism is defined by a significant increase in measured resting energy expenditure relative to predicted resting energy expenditure. Systematic analyses of hypermetabolism in ALS indicate prevalence ranging from 25% to 68% in sporadic ALS.3–7 In familial ALS, hypermetabolism is reported to occur in all patients.6 To date, studies in ALS have identified hypermetabolism using predictions of resting energy expenditure that are based on the Harris-Benedict equation, which fails to correct for muscle atrophy in ALS. We have shown that predictions of resting energy expenditure in ALS are impacted by fat-free mass.8 Therefore, current reports of the prevalence and impact of hypermetabolism in ALS are likely to be confounded by incorrect estimates of predicted resting energy expenditure.
The aim of this study was to determine the prevalence of hypermetabolism, relative to body composition, in patients with ALS and age and sex-matched healthy controls. In addition, we assessed the association of hypermetabolism with clinical features of disease, functional decline and mortality.
Materials and methods
Study design and clinical assessment
This case–control study was conducted between 17 April 2015 and 30 November 2017. Patients with ALS who fulfilled the revised El Escorial criteria for probable or definite ALS9 from the Royal Brisbane and Women’s Hospital (RBWH) multidisciplinary Motor Neuron Disease clinic and the Wesley Hospital were invited to take part in this study. At enrolment, demographics information, site of disease onset, disease duration and the presence of a familial history were noted. The severity of upper motor neuron (UMN) and lower motor neuron (LMN) signs was graded using a modified Ravits Scale, where each limb was scored on a scale of 0 (no involvement) to 3 (significant and severe involvement) to generate UMN and LMN scores for each patient.10 11 Total UMN and LMN scores were then categorised according to severity (0–2, 3–6 and 7–12) as done previously.11 Edinburgh Cognitive and Behavioural ALS Screen (ECAS) and Addenbrooke’s Cognitive Examination III (ACE III) were administered by a clinical neuropsychologist.
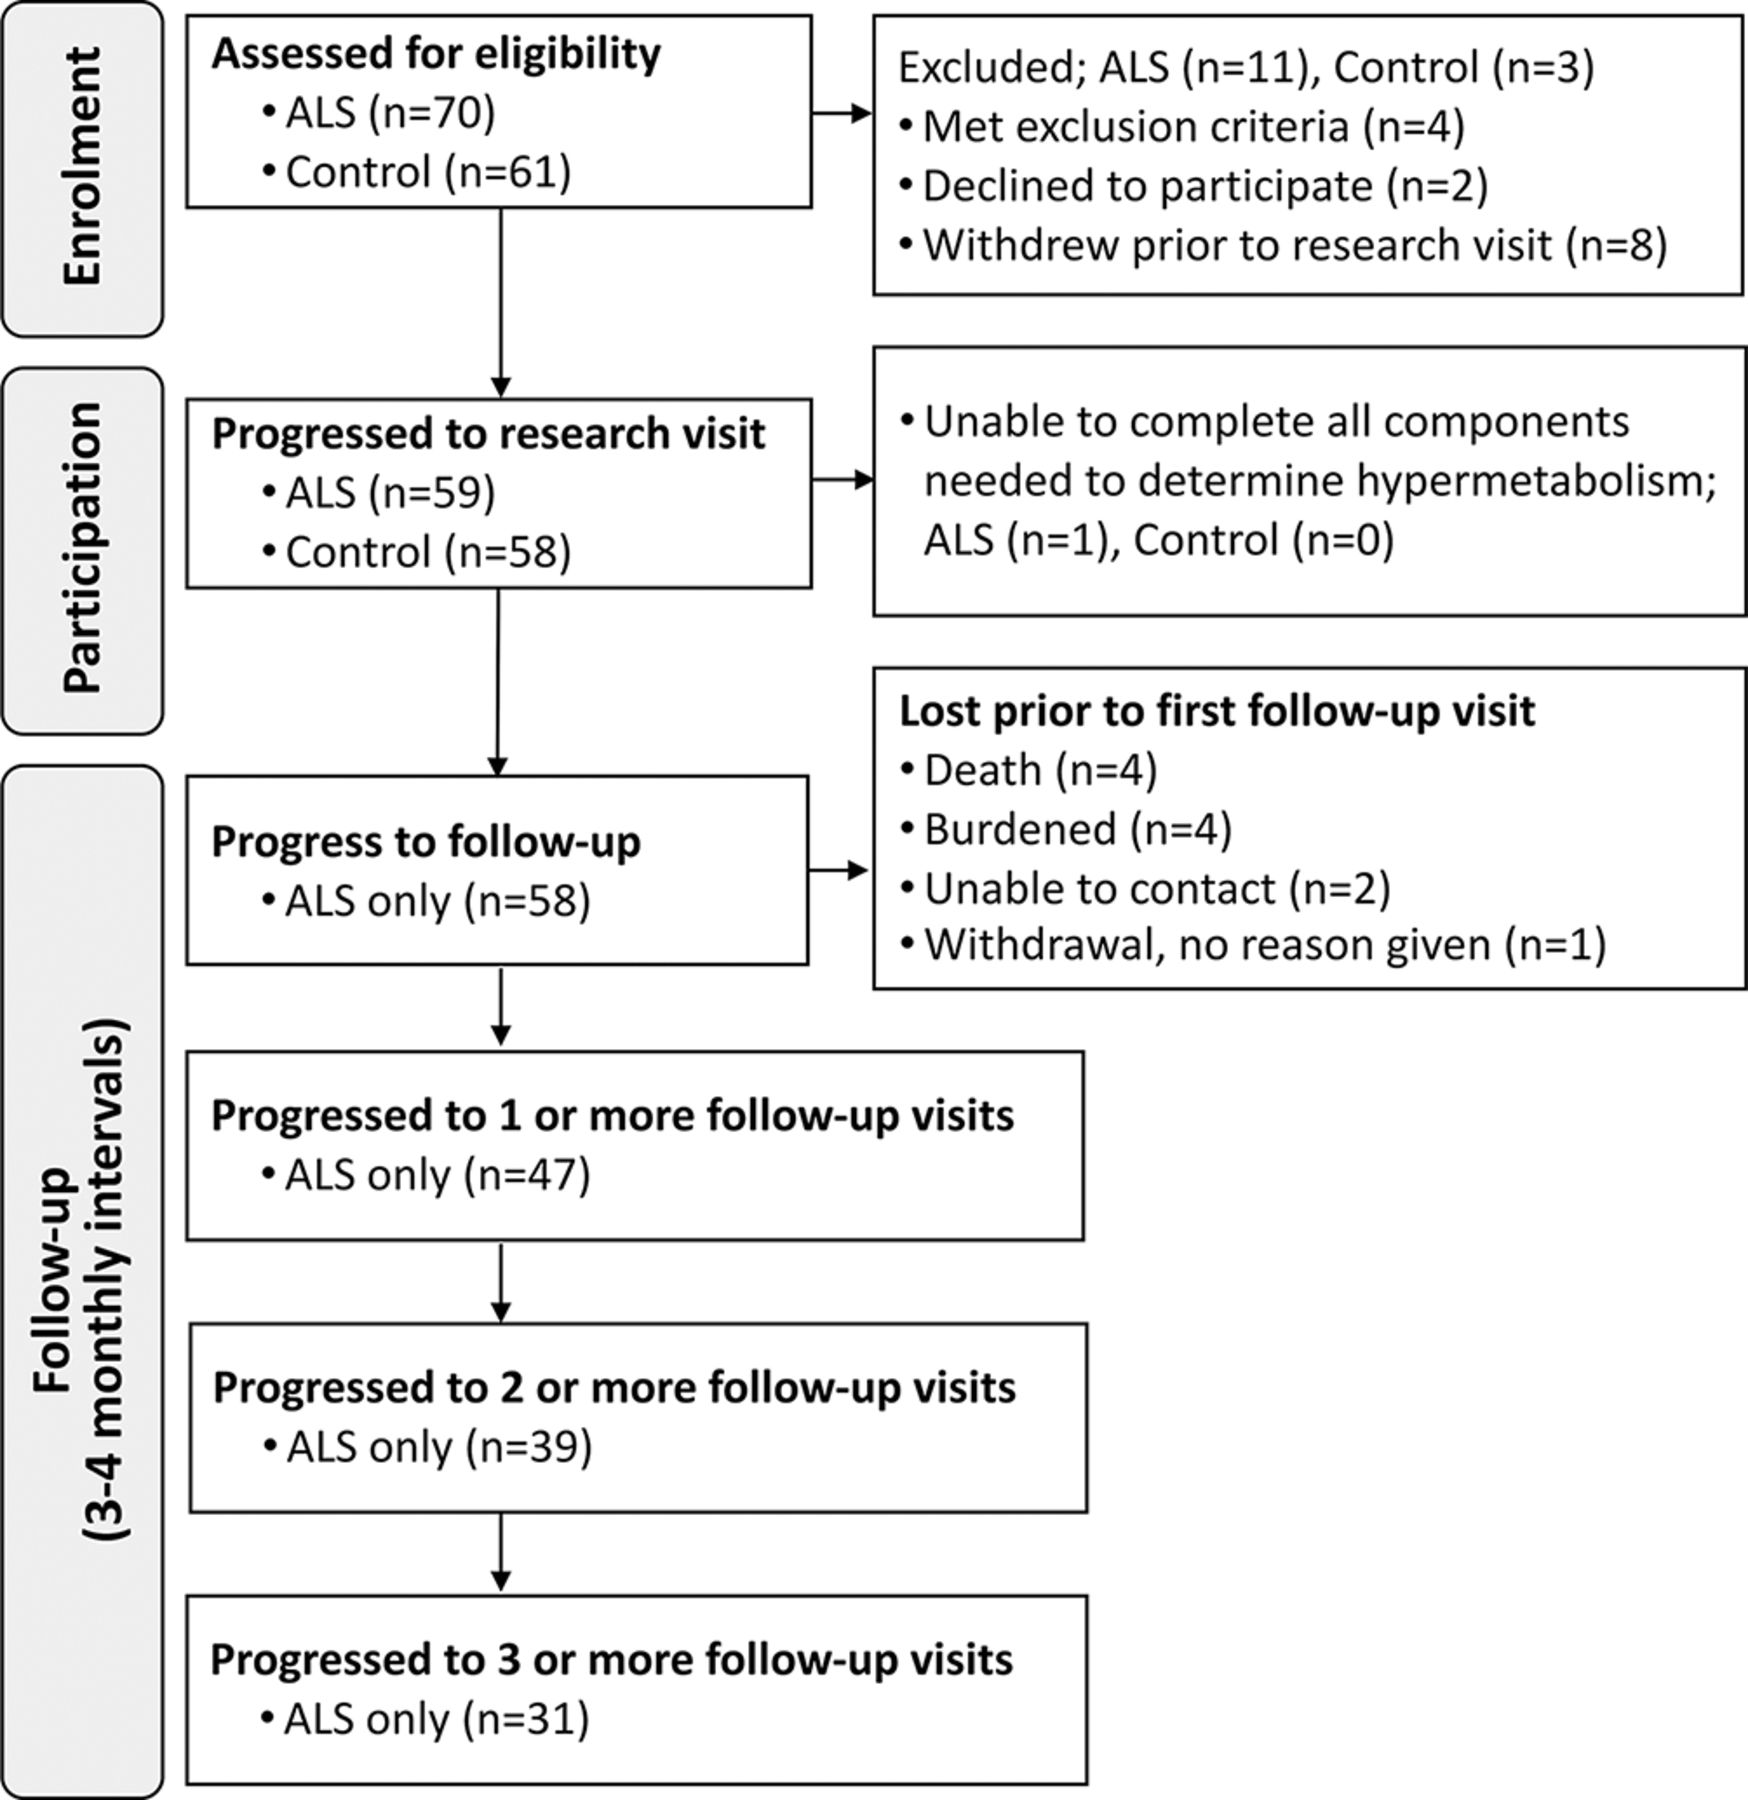
Measures of body weight and composition, the Revised ALS Functional Rating Scale (ALSFRS-R)12 and forced vital capacity (FVC) in the 6 months prior to metabolic assessment were sourced from clinical records and data from longitudinal studies of body composition in ALS. Follow-up measures were conducted at 3–4 month intervals for up to 12 months following metabolic assessment. Age and sex-matched healthy individuals were recruited as a convenience sample of spouses, friends or family members of ALS participants. Exclusion criteria were use of gastrostomy, respiratory impairment (FVC <60%) and/or a history of diabetes. Study enrolment, participation and follow-up are illustrated in figure 1.

Study design. Schematic summarising the number of individuals during enrolment, participation and follow-up. ALS, amyotrophic lateral sclerosis.
Metabolic assessment
Control and ALS participants underwent assessment to determine predicted and measured resting energy expenditure. Participants were instructed to refrain from physical activity and to fast (except for water) for 12 hours prior to assessment at 08:00. Height was determined using a stadiometer. Body composition (fat mass and fat-free mass) was determined by whole body air displacement plethysmography using the BodPod system (Cosmed USA, Rome, ITA).8 Values of fat mass and fat-free mass were used to predict resting energy expenditure using a proprietary adaptation of the Nelson prediction model (Cosmed). Following body composition analysis, participants were instructed to lie on an examination bed with their head and torso elevated at a 35° angle. Participants were given 10 min to relax prior to the measurement of resting energy expenditure by indirect calorimetry using a Quark RM respirometer (Cosmed). A canopy hood was placed over the participant’s head. The participant rested within the hood for 5 min prior to the start of data collection. During this time, the ventilatory hood pump was adjusted to achieve a flow rate between 0.8 and 1.1 L/min (allowing an ~1% FeCO2). This flow rate was not adjusted during the subsequent 15 min data collection period. Room temperature was maintained at 22°C±2°C. At the completion of metabolic assessment, ALSFRS-R was administered by a research nurse. The King’s stage for each patient was derived from their ALSFRS-R score.13 ALS patients completed a respiratory function test within 1 month of metabolic assessment. A blood sample was collected for genotyping.
Genotyping
We evaluated C9orf72 and UNC13A as they have been shown to be consistently related to the risk of ALS, are known modifiers of disease progression and are relatively common in the ALS population.14 The SNP UNC13A (rs12608932) was also genotyped since homozygosity of the C allele, found in up to 19.5% of all ALS cases,14 is associated with survival in ALS. The presence or absence of the C9orf72 repeat expansion was tested using repeat-primed PCR.15 Individuals with more than 30 repeats in the C9orf72 gene were considered to have a repeat expansion.16
Outcome measures
The primary outcome measure was the prevalence of hypermetabolism in ALS and control participants. Hypermetabolism was defined by a metabolic index where measured resting energy expenditure was ≥120% of predicted resting energy expenditure. To compare normometabolic and hypermetabolic patients with ALS, we examined differences in demographics, clinical measures, anthropomorphic measures, cognitive scores and prevalence of familial disease. We also examined the correlation between metabolic index and changes in weight, body mass index (BMI), fat %, fat-free mass (kg), ALSFRS-R and FVC over a 12-month follow-up period. We compared the survival of normometabolic and hypermetabolic ALS participants over a 30-month period following metabolic assessment.
Sample size
Sample size calculation was based on a study reporting hypermetabolism in 68% of patients with ALS where measured resting energy expenditure was ≥110% of predicted resting energy expenditure.4 As we used a more conservative cut-off to define hypermetabolism (metabolic index ≥120%),17 we assumed that only 30% of patients with ALS and 5% of control individuals would be hypermetabolic. Adjusting for anticipated missing data of 5% in any of the three essential covariates (weight, body composition and resting energy expenditure) to determine hypermetabolism, the number of participants needed to achieve 90% power with a two-sided alpha of 5% was 55 participants per arm.
Statistical analysis
Variables were summarised as mean and SD for continuous variables or frequency and proportion for categorical variables. Groups were compared with a two-sided student’s t-test with Welch’s correction when comparing means, and the Χ2 test with Yates’s continuity correction when comparing proportions. At least one missing value in any of the covariates (demographics, clinical scores, anthropomorphic indices and cognitive information) was present in 10.3% of the cases (four patients had missing LMN and UMN scores, whereas two had missing FVC measurements). Missing data were accounted for by creating multiple imputed data sets (n=25) using predictive mean matching, stratified by familial or sporadic ALS and discarding the first 100 iterations (burn-in). The imputation model contained all covariates. Genotypic data were not imputed and excluded from the imputation model. Results across the imputed data sets were pooled after model fitting using Rubin’s rules.18
To assess the difference in prevalence of hypermetabolism in patients with ALS and healthy controls, hypermetabolism (yes/no) was modelled as a function of status (case/control) using logistic regression. To account for confounding by age, sex, BMI and smoking, we weighted the model by the inverse of the propensity score (inverse probability weighting).19 Individual propensity scores were calculated from a logistic model, modelling status (case/control) as a function of the above-mentioned confounders. Two additional sensitivity analyses were performed to control confounding: (1) multivariable regression including all confounders and (2) multivariable regression including only the propensity score.
Next, we conducted analyses that focus on the relationship between specific disease characteristics, survival and metabolic index. Pearson correlations were used to assess the associations between disease characteristics at the time of metabolic assessment and the metabolic index. Joint models were used to correct longitudinal outcomes (eg, ALSFRS-R, FVC and weight) for dropout due to death.20 The time-to-event process was modelled by a Cox proportional hazards model with only an intercept. To account for the different number of observations per participant the longitudinal process was modelled by linear mixed effects (LME) models with a random intercept and random slopes for time per individual. The fixed effect of time was modelled by restricted cubic splines with three knots. A fixed effect for hypermetabolism and a fixed interaction term between time and hypermetabolism were subsequently added. To take into account the informative, non-random missing data due to death, we adjusted all LME models for survival using a joint modelling framework. Likelihood ratio tests were used to compare models. If coefficients were estimated, restricted likelihood estimation was applied. The baseline risk for all joint models was modelled in a piecewise constant fashion with one knot (‘piecewise-PH-aGH’).20 A log-rank test, stratified for site of onset (bulbar vs other), was used to estimate the overall effect of hypermetabolism on time to death. Given the exploratory nature of these analyses, results were considered significant when the p value was smaller than 0.05. Joint models were fitted using the jointModel function in the R package JM (V.1.4-7).20 Imputation of missing data was performed using the aregImpute function in the Hmisc R package (V.4.0-3).
Results
Fifty-eight ALS and 58 control participants completed metabolic assessment. At the time of metabolic assessment ALS and control groups were similar in age, sex and BMI (table 1; case–control comparison). Of the 58 patients with ALS, 3 were smokers (5%), 21 were prior smokers (36%) and 34 were non-smokers (59%). Of the 58 control participants, 4 were smokers (7%), 18 were prior smokers (31%) and 36 were non-smokers (62%). Mean % fat mass (SD) was slightly higher in patients with ALS when compared with controls (36 (12) vs 32 (9); p=0.06). Mean fat-free mass (SD) was lower in patients with ALS when compared with controls (50 (11) vs 55 (12); p=0.03). Metabolic index (SD) was higher in patients with ALS when compared with controls (115 (21) vs 107 (13); p=0.02).
Characteristics of patients with ALS (cases) and controls at the time of metabolic assessment
Hypermetabolism was present in 24 (41%) patients with ALS and 7 (12%) controls. The crude OR for the presentation of hypermetabolism in ALS was 5.1 (95% CI 2.1 to 14.2) and 5.4 (95% CI 2.1 to 13.8) when adjusting for age, sex, BMI and smoking. Results did not differ in the sensitivity analyses that used alternate models for accounting for covariates (less than 5% difference in ORs). Overall, these measures indicate an increase in the prevalence of hypermetabolism in patients with ALS when compared with healthy controls.
We found no difference in age, BMI, % fat mass, fat-free mass, diagnostic delay, disease duration, ALSFRS-R total score, FVC and UMN score between normometabolic and hypermetabolic patients with ALS at the time of metabolic assessment (table 1; within case comparison). However, hypermetabolic patients had greater disease severity (ΔFRS21−0.6 vs −0.4; p=0.03; King’s stage >1 88% vs 59%; p=0.04) and a higher LMN score (4 vs 3; p=0.04). When whole body UMN and LMN scores were categorised according to severity, there was no relationship between metabolic index and UMN scores (p=0.48, figure 2), but metabolic index increased significantly relative to increasing LMN scores (p<0.01, figure 1). Hypermetabolism was present in 88% (n=7) of familial ALS cases and 34% (n=17) of sporadic ALS cases (p=0.01). The C9orf72 repeat expansions were identified in 10% of patients with ALS, and homozygosity for the UNC13A C allele was found in 11% of patients with ALS. Specific genotypes of C9orf72 and UNC13A were not related to hypermetabolism (table 1).
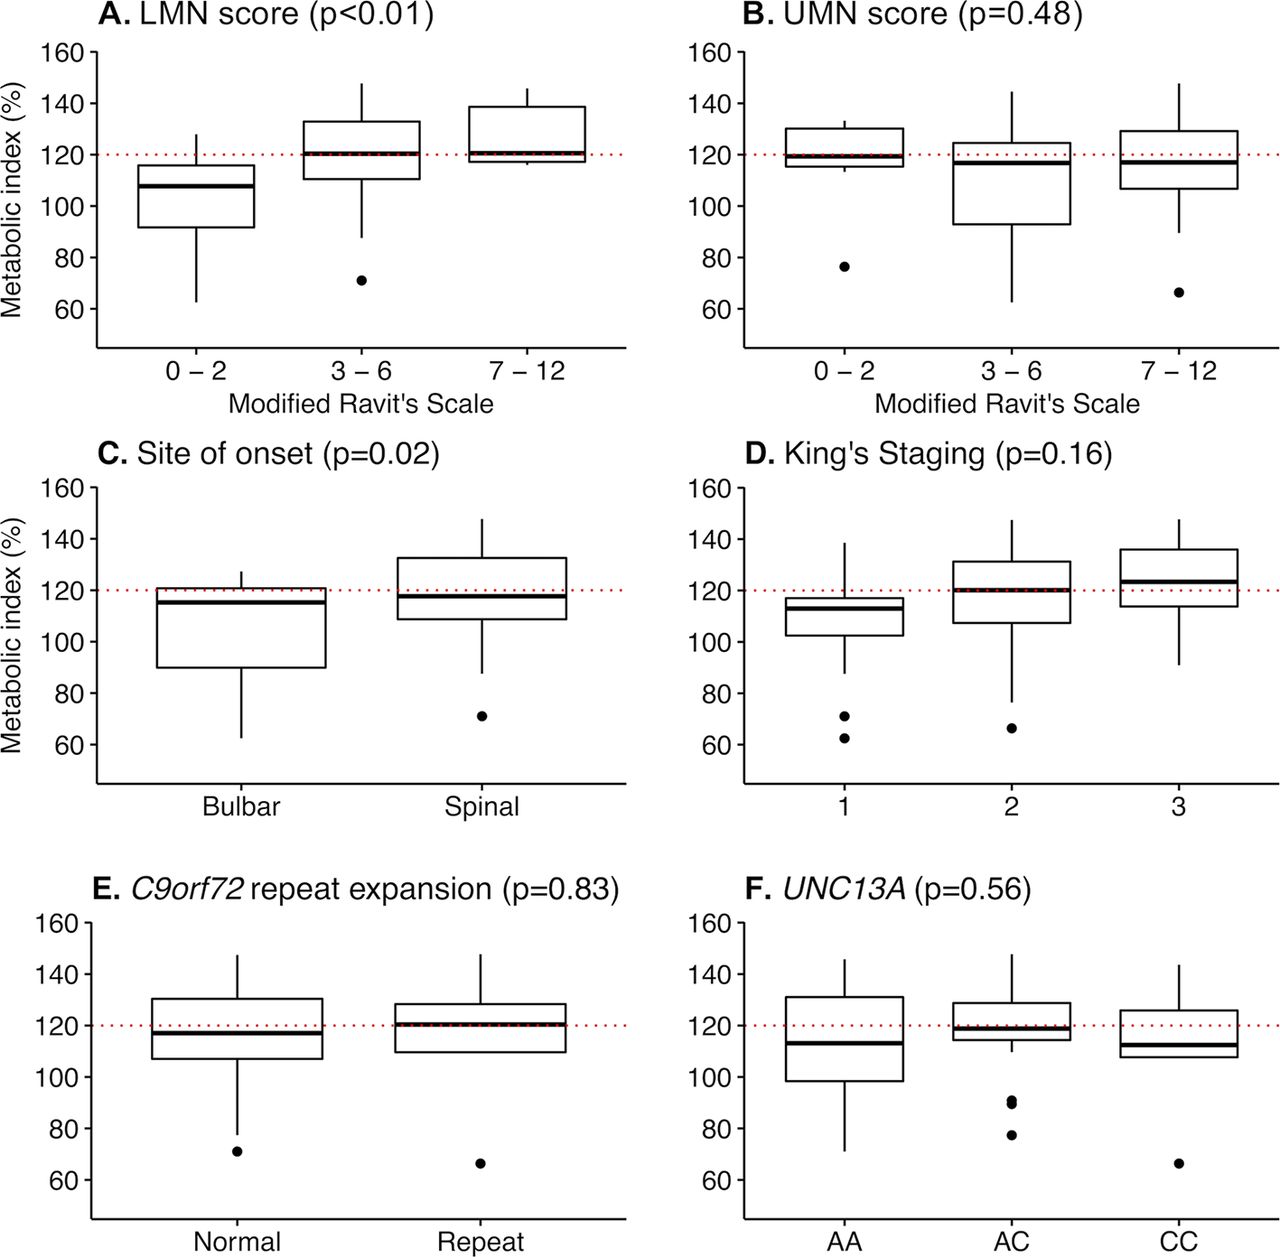
Change in metabolic index relative to motor neuron involvement, sites of onset, clinical staging and genotype. Box plots summarising the change in metabolic index relative to (A) lower and (B) upper motor neuron scores, (C) site of onset, (D) King’s staging and (E-F) genotype (from table 1). Motor neuron scores were determined using a modified Ravits Scale. Binning reflects increasing upper or lower motor neuron involvement. P values indicate the significance of change in metabolic index relative to increasing scores, as determined by analysis of variance (ANOVA). Dots represent outliers (Tukey post hoc test). LMN, lower motor neuron; UMN, upper motor neuron; AA, UNC13A A/A genotype; AC, UNC13A A/C genotype; CC, UNC13A C/C genotype.
Correlation analyses to assess relationships between metabolic index and characteristics of patients with ALS at the time of metabolic assessment showed no relationship between metabolic index and BMI, fat-free mass and disease duration (table 2). There was also no correlation between metabolic index and ASLFRS-R (p=0.56, r=−0.08, 95% CI −0.33 to 0.18) and FVC (% predicted; p=0.37, r=0.16, 95% CI −0.20 to 0.49). While metabolic index did not correlate with UMN score (p=0.69, r=0.05, 95% CI −0.22 to 0.32), an increase in metabolic index was associated with an increasing LMN score (p<0.01, r=0.47, 95% CI 0.23 to 0.65). Metabolic index was not correlated with ECAS (p=0.34, r=0.20, 95% CI −0.22 to 0.56), but was correlated to ACE III (p=0.01, r=0.41, 95% CI 0.10 to 0.64).
Correlations between metabolic index and patient information collected at the time of metabolic assessment
Exploratory analysis of anthropometric indices over time shows that metabolic index is not associated with weight loss (p=0.59) or BMI loss (p=0.27). Hypermetabolism is also not related to changes in body weight, BMI or body composition (figure 3). Analyses of change in ALSFRS-R and FVC over time demonstrate that hypermetabolic patients with ALS had a greater decline in ALSFRS-R (p=0.01) but not FVC (p=0.24) (figure 3). On average, hypermetabolic patients lost 0.68 (95% CI 0.42 to 0.94) ALSFRS-R points per month compared with 0.39 (95% CI −0.20 to 0.57) points in normometabolic patients.
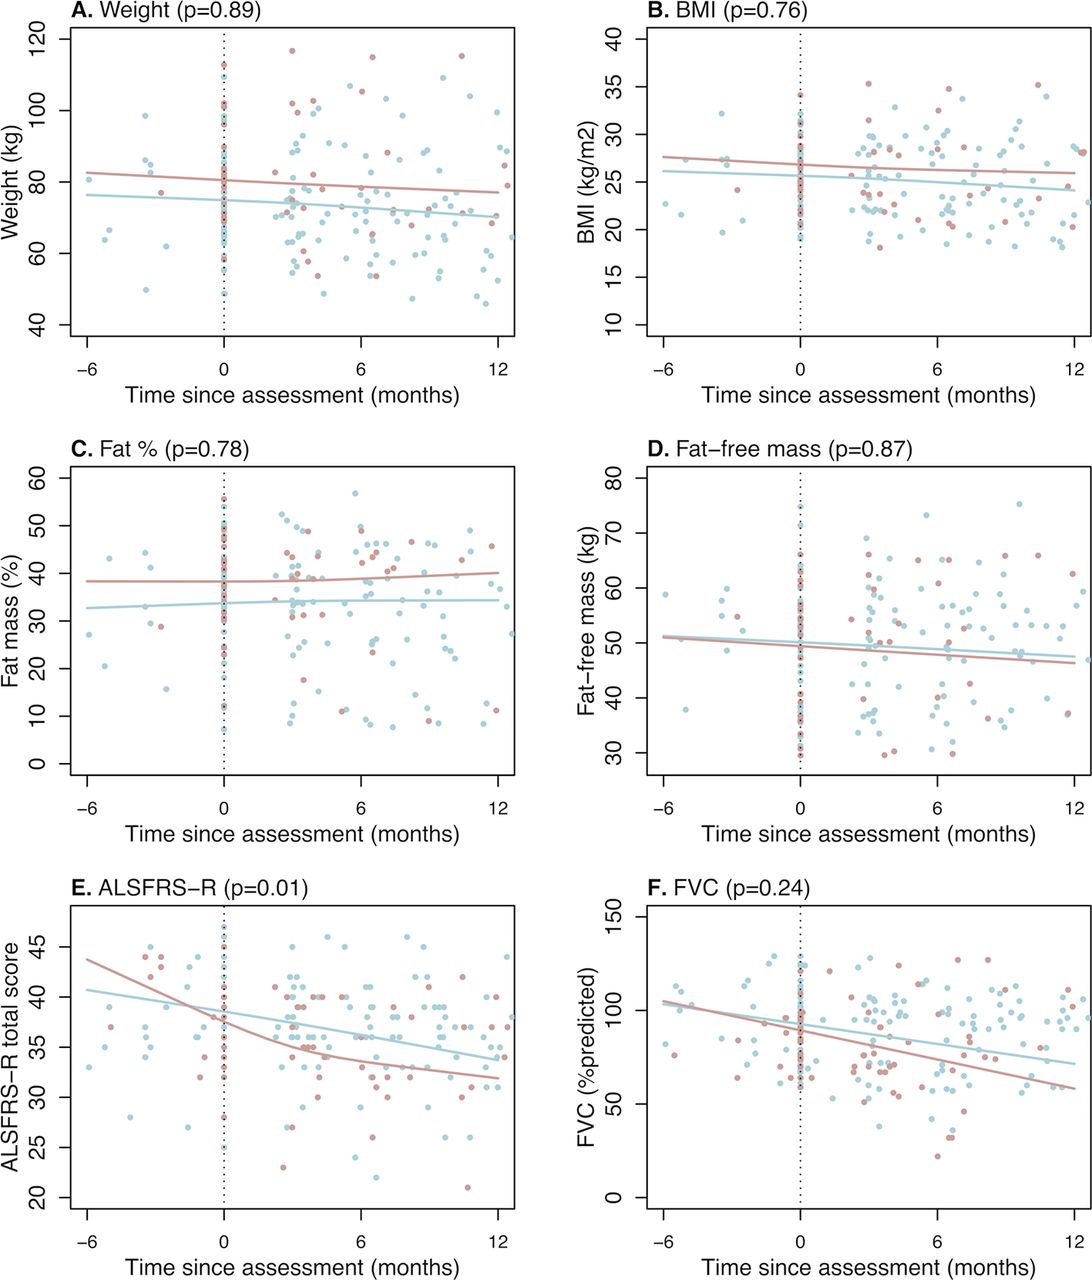
Change in weight, body mass index, fat mass (%), fat-free mass (kg), ALSFRS-R and FVC in hypermetabolic and normometabolic ALS participants. Relationship between time since metabolic assessment and measures of (A) body weight, (B-D) anthropometric indices and (E-F) clinical parameters of disease in normometabolic (blue line) and hypermetabolic (red line) patients with ALS. Hypermetabolism is negatively correlated with ALSFRS-R (p=0.01; −0.39 points/month for normometabolic patients with ALS vs −0.68 points/month for hypermetabolic patients with ALS). ALS, amyotrophic lateral sclerosis; ALSFRS-R, Revised ALS Functional Rating Scale; BMI, body mass index; FVC, forced vital capacity.
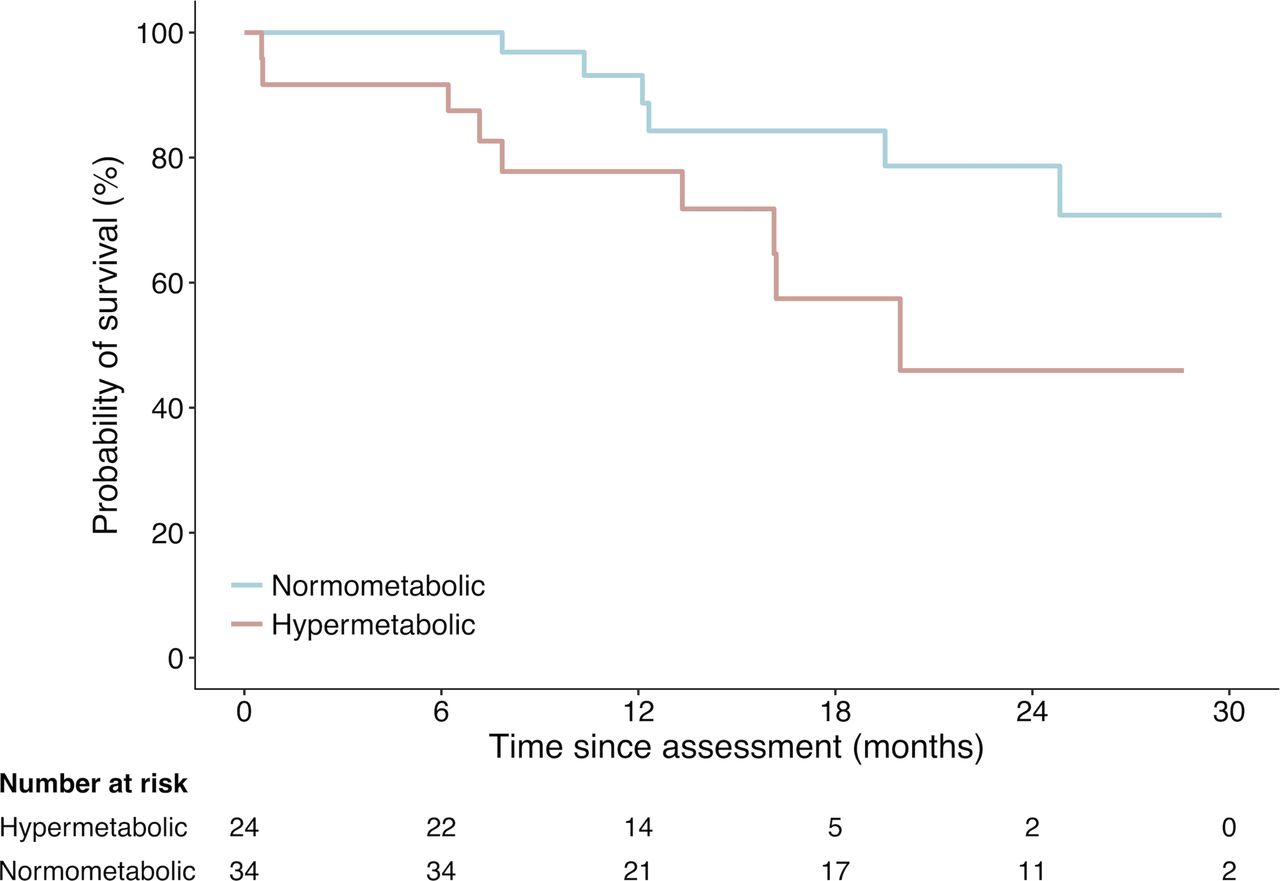
During the study, there were 15 deaths of patients with ALS: 9 in the hypermetabolic group (60%) and 6 in the normometabolic group (40%; figure 4). Survival probability of hypermetabolic patients relative to the time of metabolic assessment was significantly lower than that of normometabolic patients (p=0.02). Stratified log-rank analysis shows that 12-month survival probability for hypermetabolic patients (bulbar, n=5) was 50.0%, hypermetabolic patients (other, n=19) was 84.2%, normometabolic patients (bulbar, n=10) was 100% and normometabolic patients (other, n=24) was 90.2%. Overall, hypermetabolism increased the risk of death during follow-up to 220% (HR 3.2, 95% CI 1.1 to 9.4, p=0.03).
Survival probability of hypermetabolic versus normometabolic patients with amyotrophic lateral sclerosis (ALS) relative to time of metabolic assessment. Crude Kaplan-Meier curves during the course of 30 months for the hypermetabolic and normometabolic patients. Hypermetabolic patients had significantly worse survival (log-rank p=0.02, HR 3.2, 95% CI 1.1 to 9.4).
Discussion
Our primary finding is an increase in prevalence of hypermetabolism in patients with ALS compared with an age and sex-matched control population. Secondary findings are that hypermetabolism is associated with greater LMN involvement, greater functional decline over time and reduced survival. Changes in body weight and BMI did not differ between hypermetabolic and normometabolic patients with ALS. There was increased prevalence of hypermetabolism in patients with familial ALS, but this was not related to C9orf72 or UNC13A genotype status.
In line with previous studies,3 4 22 we find that hypermetabolism is not associated with ALSFRS-R at the time of metabolic assessment. However, hypermetabolic patients with ALS experience a more rapid decline in ALSFRS-R prior to, and following metabolic assessment (∆FRS). One interpretation of this finding is that the degree of disability may not directly contribute to the metabolic index of the individual. Rather, hypermetabolic individuals may have a more severe disease. This is congruent with our observation that hypermetabolism is related to higher LMN score, which is associated with earlier death.11
Given that LMN signs arise from pathology affecting the anterior horn cell, hypermetabolism might occur as a consequence of denervation of skeletal muscle. This is supported by the higher proportion of hypermetabolic patients in our study having King’s stage >1 and spinal onset disease. It has been proposed that skeletal muscle is the site of origin of hypermetabolism in ALS.23 Indeed, chronic denervation of forearm muscles in patients with ALS results in a localised increase in oxygen utilisation (a proxy measure for energy use) at rest and during exercise.24 Paradoxically, denervation has been found to decrease muscle mitochondrial respiration and function.25 Thus, hypermetabolism in ALS is unlikely to occur solely as a consequence of denervation.
Previously, Kasarskis et al proposed that increased respiratory muscle expenditure towards the latter stages of disease contributes to hypermetabolism.7 Moreover, mechanically ventilated patients with ALS are hypometabolic,26 and non-invasive ventilation reduces energy expenditure in patients with ALS with FVC of 30%–58%.27 We did not observe any relationship between hypermetabolism and FVC. While this suggests that the weakening of respiratory muscles and reductions in FVC are not independent drivers of hypermetabolism, all of our patients with ALS had FVC >60% at the time of metabolic assessment. Hence, we cannot discount the role of respiratory function on altered energy expenditure in cases of worsening respiratory function.
Studies of hypermetabolism in ALS have focused on defining energy expenditure relative to nutrient status to inform weight maintenance.3–7 Weight loss and changes in BMI could be driven by complex maladaptive responses to central and peripheral neuroendocrine mechanisms that control whole body metabolism.28 29 The brain, and the hypothalamus in particular, plays an integral role in regulating energy expenditure and intake. While there is widespread brain atrophy in ALS,30 it has been proposed that hypothalamic atrophy underpins altered dietary intake, increased energy expenditure and reductions in BMI.31 32 In contrast to the perception that hypermetabolism could be a primary cause for weight loss, there has been no study to definitively show that hypermetabolism contributes to a greater degree of weight loss in ALS.3–7 17 22 Certainly, we observe comparable changes in body weight, BMI and % fat mass in our hypermetabolic and normometabolic patients. This might be due to dietary management within our multidisciplinary clinic,33 with patients increasing energy intake to offset higher energy demand. In the absence of data pertaining to central and peripheral mechanisms that regulate energy expenditure and intake, we cannot disregard hypothalamic involvement or neuroendocrine feedback as potential causes for hypermetabolism or weight maintenance in our patient cohort. Comprehensive studies that characterise the degree of hypothalamic atrophy and the expression of peripheral factors that modify energy balance relative to energy expenditure and dietary intake are needed.
Of interest, significant clinical and pathologic overlap is observed in ALS and frontotemporal dementia (FTD).28 34 In patients with the behavioural variant of FTD, cognitive impairment is associated with hyperphagia, weight gain and higher energy expenditure.35 36 Thus, cognitive involvement may lead to metabolic changes in ALS. We observe a correlation between metabolic index and ACE III. However, the mean ACE III scores are not indicative of cognitive impairment. Thus, while our data must be interpreted with caution, it highlights the need for detailed assessment of hypermetabolism and cognitive involvement across the ALS-FTD landscape.
Altered energy homeostasis is proposed to negatively impact the course of disease, yet reports of the impact of hypermetabolism on survival are inconsistent.3–5 7 While an increase in hypermetabolism has been observed relative to the time of death,7 this finding has not been reproduced in subsequent studies.3–5 More recently, it has been shown that hypermetabolic patients with ALS have a trend towards worse survival.17 We show that 12-month survival following metabolic assessment is greater in normometabolic patients when compared with hypermetabolic patients. Our data are the first to indicate that hypermetabolism is a prognostic factor for ALS.
A strength and novel aspect of this study is that we defined hypermetabolism based on predictions of resting energy expenditure that accounted for the fat-free mass (the major determinant of energy expenditure) and fat mass of each individual. Due to neurogenic muscle wasting in ALS, failure to account for changes in body composition8 37 38 could explain the inconsistencies among previous reports of the prevalence of hypermetabolism in ALS, and in correlations between hypermetabolism and clinical parameters of disease and survival.3–7 17 Another strength of this study is that we contrasted measures of hypermetabolism in patients with ALS to an age and sex-matched control population to provide a more objective report of the prevalence of hypermetabolism in ALS.
There are some limitations to our study. First, this study was not designed to consider metabolic index relative to the total energy expenditure and dietary intake of the individual. Since malnutrition in ALS is associated with worse prognosis,39 and supplementation with high-caloric diets improves prognosis,40 we cannot exclusively attribute survival outcome in this study to hypermetabolism. Studies that consider all aspects of energy expenditure alongside nutrient status and caloric intake of the individual are required to determine the impact of changes in energy homeostasis on ALS throughout the course of disease. Second, our study cannot determine whether hypermetabolism is an early and persistent phenomenon that underpins the clinical features of ALS, or whether the metabolic index escalates and hypermetabolism occurs as a consequence of worsening disease. Hypermetabolism could be an epiphenomenon that may not be causally related to ALS prognosis, but rather, could simply be a by-product of muscle denervation or pathology associated with greater functional decline and more aggressive disease. Studies matching clinical scores of UMN and LMN involvement with imaging and/or neurophysiological modalities would advance our understanding of the relationship between UMN and LMN features and hypermetabolism in ALS. Furthermore, longitudinal studies of resting energy expenditure are needed to provide insight into the cause-or-effect relationship between hypermetabolism and ALS progression. To account for possible changes in central control of energy homeostasis, these studies should include measures of hypothalamic atrophy and changes in the function of brain areas that regulate energy expenditure. Lastly, this study was conducted in a relatively small sample size of 58 patients with ALS and 58 age and sex-matched controls. Independent replication of this study in a larger sample size, and clarification of the reproducibility of the impact of the metabolic index on clinical parameters of disease and mortality are essential.
Conclusion
In conclusion, by determining the metabolic index of patients with ALS and healthy controls, we confirm an increase in energy expenditure that occurs alongside a significant reduction in fat-free mass in ALS. We demonstrate that hypermetabolic patients with ALS experience greater functional decline and worse survival. Our findings highlight the potential to use the assessment of metabolic index to predict outcome in ALS.
Acknowledgments
We thank all patients with ALS and control individuals who participated in this study. The authors acknowledge the valuable funding of Wesley Medical Research (Project No. 2016-32).
References
Footnotes
Contributors Study concept and design: FJS, STN. Acquisition, analysis or interpretation of data: all authors. Drafting of the manuscript: FJS, RPAE, NRW, LHB, RDH, PAM, STN. Critical revision of the manuscript for important intellectual content: FJS, RPAE, NRW, LHB, RDH, PAM, STN. Administrative, technical or material support: FJS, RPAE, SH, KAT, AKH, NRW, LHB, AKH, PAM, STN. Supervision: FJS, LHB, RDH, STN. Statistical analysis was conducted by RPAE (UMC Utrecht) and FJS (The University of Queensland).
Funding This work was supported by funding from the Motor Neurone Disease Research Institute of Australia (Cunningham Collaboration MND Research Grant to PAM, RDH, LHB and STN; Cunningham Family MND Research Grant to FJS, STN, RDH and PAM; Ice Bucket Challenge Grant to Sporadic ALS Australian Systems Genomics Consortium) and The University of Queensland (UQECR1719385 to STN). NRW acknowledges funding from the Australian National Health and Medical Research Council (1078901, 1113400). RPAE and LHB were funded by the Netherlands ALS Foundation (MEASURE study). STN is supported by the Scott Sullivan Fellowship (MND and Me Foundation, Royal Brisbane and Women’s Hospital Foundation, and the Queensland Brain Institute), and the Australian Institute for Bioengineering and Nanotechnology at the University of Queensland. ZAI was supported by The Australian and New Zealand Association of Neurologists Education and Research Foundation/National Health and Medical Research Council Postgraduate Scholarship.
Competing interests None declared.
Patient consent Not required.
Ethics approval The University of Queensland, RBWH and Wesley Hospital human research ethics committees.
Provenance and peer review Not commissioned; externally peer reviewed.
Author note Statistical analysis: FJS, RPAE. - This has been removed as this information has been doubled up in this section. We have maintained one sentence to highlight contributions to statistical analysis.
Linked Articles
- Editorial commentary