Article Text

Abstract
Objective Apathy is a common neuropsychological symptom in Alzheimer’s disease (AD), and previous studies demonstrated that neuronal loss and network disruption in some brain regions play pivotal roles in the pathogenesis of apathy. However, contributions of tau and amyloid-β (Aβ) depositions, pathological hallmarks of AD, to the manifestation of apathy remain elusive.
Methods Seventeen patients with AD underwent positron emission tomography (PET) with 11C-pyridinyl-butadienyl-benzothiazole 3 (11C-PBB3) and 11C-Pittsburgh compound-B (11C-PiB) to estimate tau and Aβ accumulations using standardised uptake value ratio (SUVR) images. 11C-PBB3 and 11C-PiB SUVR were compared between AD patients with high and low Apathy Scale (AS) scores. Additionally, volumetric and diffusion tensor MRI was performed in those areas where any significant difference was observed in PET analyses. Correlation and path analyses among AS and estimated imaging parameters were also conducted.
Results AD patients with high AS scores showed higher 11C-PBB3 SUVR in the orbitofrontal cortex (OFC) than those with low AS scores, while 11C-PiB SUVR in any brain regions did not differ between them. Elevated 11C-PBB3 SUVR in OFC, decreased OFC thickness and decreased fractional anisotropy (FA) in the uncinate fasciculus (UNC), which is structurally connected to OFC, correlated significantly with increased scores of the AS. Path analysis indicated that increased 11C-PBB3 SUVR in OFC affects apathy directly and through reduction of OFC thickness and subsequent decrease of FA in UNC.
Conclusions The present findings suggested that tau pathology in OFC may provoke focal neurotoxicity in OFC and the following disruption of the OFC-UNC network, leading to the emergence and progression of apathy in AD.
- Alzheimer’s disease
- apathy
- tau
- PET
- cortical thickness
- DTI
This is an open access article distributed in accordance with the Creative Commons Attribution Non Commercial (CC BY-NC 4.0) license, which permits others to distribute, remix, adapt, build upon this work non-commercially, and license their derivative works on different terms, provided the original work is properly cited and the use is non-commercial. See: http://creativecommons.org/licenses/by-nc/4.0/
Statistics from Altmetric.com
Introduction
Alzheimer’s disease (AD), the most common cause of dementia, shows behavioural and psychological symptoms of dementia (BPSD) in addition to progressive cognitive dysfunction. Furthermore, BPSD among patients with mild cognitive impairment (MCI) are suggested to be a risk factor for conversion to AD.1 2 Partly due to a lack of understanding concerning the pathological basis of BPSD, some of the symptoms show limited response to drug treatment, resulting in the collapse of daily life or frequent hospitalisation.3 Among various appearances of BPSD, apathy is often seen in the course of AD. Apathy is defined as decreased motivation and lack of goal-directed behaviour, emotion or cognition.4 AD patients with apathy show less interaction with family and other people as well as isolation from home and local societies; additionally, they are hardly able to ask for someone’s help due to their lack of insight. Accordingly, apathy can be a cause of inadequate treatment and care5 and also gives stress to caregivers.6
Some neuroimaging studies focusing on apathy in AD suggested that frontal dysfunction could be its neural basis. Previous studies revealed that apathetic AD patients showed decrement of grey matter volume, cerebral blood flow and glucose metabolism in some brain regions including the orbitofrontal cortex (OFC) and anterior cingulate cortex (ACC).7–9 Additionally, network disruption is assumed to be another key factor behind apathy in AD. In diffusion tensor imaging (DTI) analyses, AD patients with apathy showed white matter abnormality in some tracts including the uncinate fasciculus (UNC) and anterior cingulate fasciculus.10 11 Some of the above-mentioned brain regions and networks were mutually connected (ie, OFC and UNC) and seemed to play an important role in the appearance of apathy. However, associations among the pathological changes indicated above and the pathological cascade leading to apathy in AD still remain unclear.
Since depositions of amyloid-β (Aβ) and hyperphosphorylated tau concurrently occur in AD brain,12 they are assumed to have crucial importance in the development of BPSD, including apathy. We hypothesised that these abnormal proteins in the focal brain region would evoke network disruption subsequent to focal neural damage, leading to apathy. Recent advancements in positron emission tomography (PET) imaging technique visualising Aβ and tau have enabled us to explore the association between these abnormal proteins and clinical manifestations in vivo. We have also developed a tau PET ligand, 11C-pyridinyl-butadienyl-benzothiazole 3 (11C-PBB3), that shows high affinity and selectivity for tau deposits13 14 and reported that tau deposition measured by 11C-PBB3 showed close relation to cognition of AD and cognitively healthy elderly.15 While some previous studies investigated the association between Aβ deposition and apathy using amyloid PET, no study has assessed whether either or both Aβ and tau pathologies might have some influence on the damage to focal brain and connected fibres in AD with apathy.
To assess whether focal depositions of Aβ and tau are associated with the emergence of apathy, we performed a PET scan with 11C-PBB3 and 11C-Pittsburgh compound-B (11C-PiB) in AD patients with high and low Apathy Scale (AS) scores.16 17 We also investigated the association among focal Aβ and tau deposits, neural loss of focal brain, disruption of connected fibre and the severity of apathy.
Methods
Participants
We recruited 11 clinically diagnosed AD dementia and 15 MCI subjects from Chiba University Hospital and affiliated hospitals between March 2013 and March 2014. Diagnosis of AD was based on the National Institute of Neurological and Communicative Disease and Stroke/Alzheimer’s Disease and Related Disorders Association criteria18 and that of MCI as meeting the Petersen’s criteria.19 Since we intended to focus on AD spectrum patients, seven patients with no clear cortical 11C-PiB retention were excluded from the assay group. We also excluded two other patients because their severely impaired cognitive status hampered collections of some neuropsychological data. Thus, 17 of 26 patients with AD (8 AD dementia and 9 MCI due to AD) were enrolled for further analyses. Their general cognitive function and activity of daily living were evaluated by Mini-Mental State Examination (MMSE)20 and Clinical Dementia Rating scale.21 Psychological assessments for apathy and depression were performed using AS16 17 and Geriatric Depression Scale (GDS),22 respectively. AS is composed of 14 items (8 positive and 6 negative symptoms evaluating motivation or interest). Subjects rate each questionnaire item at 0–3, and the total score ranges from 0 to 42. According to a previous report, patients with high AS scores were defined as having AS ≥16 and the others as those with low AS scores.23 Frontal lobe functions of the patients were also evaluated by frontal assessment battery (FAB).24
Imaging procedure
PET scans
11C-PBB3 and 11C-PiB were radiosynthesised by the Department of Radiopharmaceuticals Development at NIRS, following a previously reported protocol.13 25 26 Seventy-minute dynamic PET scans were performed after an intravenous injection of 11C-PBB3 (injected dose: 436±55 MBq; molar activity: 82±33 GBq/µmol) or 11C-PiB (injected dose: 378±38 MBq; molar activity: 85±50 GBq/µmol). 11C-PBB3 was injected under dim lighting to avoid its photoracemisation.13 PET images were acquired by ECAT Exact HR+ system (Siemens AG) with an axial field of view of 155×155 mm, providing 63 contiguous slices. The intrinsic spatial resolution was 4.3 mm in-plane and 4.2 mm full-width at half-maximum axially. Subjects’ heads were restrained with a band extending across the forehead and attached to the headrest. Head movements were carefully monitored with laser beams during the PET scans, and corrections of head position were made in case of movement. PET images were reconstructed by the filtered back-projection method with corrections for attenuation and scatter.
MRI acquisition
3T MR images were acquired with Signa HDx (GE Healthcare, Wisconsin, USA). Subjects were scanned with a 3D T1-weighted gradient echo sequence (repetition time (TR)=7 msec, echo time (TE)=2.8 msec, field of view (FOV)=260 mm×244 mm, matrix=256×256, 170 contiguous axial slices of 1.0 mm thickness). Additionally, we performed DTI using an echo planar imaging sequence (TR=10 000 msec, TE=85 msec, b=1000 s/mm2, 25-axis encoding, FOV=260 mm×260 mm, matrix=128×128, slice thickness=3.0 mm, 36 contiguous axial slices).
Image analyses
PET image analysis
A motion correction was applied for dynamic PET data, and standard uptake value ratio (SUVR) images were generated using cerebellar grey matter as a reference region. In order to create SUVR images, we applied voxel-based calculation of 11C-PBB3-PET data at 30–50 min and 11C-PiB-PET data at 50–70 min. Next, SUVR images were coregistered to the individual T1-weighted MR images, followed by anatomical normalisation of these images to Montreal Neurological Institute 152 standard space by a Diffeomorphic Anatomical Registration Through Exponentiated Li Algebra algorithm.27 Region of interests (ROIs) of the OFC and ACC, previously reported as crucial regions for emerging apathy,7–9 were defined according to the automated anatomical labelling atlas.28 Additionally, ROIs of frontal (including lateral, orbital, medial frontal and frontal-related gyri), medial temporal (including hippocampus, parahippocampus, amygdala and fusiform gyrus), lateral temporal (including superior, middle and inferior temporal gyri), parietal (including superior and inferior parietal gyri, supramarginal and angular gyri) and occipital (including superior, middle and inferior occipital gyri) cortices were defined in order to confirm tau and Aβ accumulations in each region. These ROIs were intersected by individually normalised grey matter mask images and applied to normalised SUVR images for calculating the mean SUVR value. All images were processed using PMOD software V.3.7 (PMOD Technologies) and Statistical Parametric Mapping software (SPMV.12, Wellcome Trust Centre for Neuroimaging, UK).
Cortical thickness measurement
Cortical reconstruction and estimation of cortical thickness were performed using FreeSurfer software (V.5.3.0) (http://surfer.nmr.mgh.harvard.edu/). The detailed process of the automated surface reconstruction pipeline has been described in previous publications.29 30 Briefly, T1-weighted MRI images were processed by non-brain tissue removal, automated Talairach transformation, segmentation of subcortical white matter and deep grey matter structures, tessellation of the gray–white matter boundary and surface deformation to optimally place the grey/white and grey/cerebrospinal fluid borders. Then, cortical thickness was calculated as the closest distance from the grey/white boundary to the grey/cerebrospinal fluid (CSF) boundary at each vertex on the surface. The Desikan-Killiany cortical atlas implemented in FreeSurfer was used to evaluate the thickness in the target region where significant uptake of PET ligand was observed in AD patients with high AS scores relative to those with low AS scores.31
DTI analysis
A DTI analysis was performed using FSL software (www.fmrib.ox.ac.uk). In preprocessing, images were corrected for eddy current and head motion with FMRIB’s Diffusion Toolbox (FDT), and brain tissue extraction was performed with the Brain Extraction Toolbox implemented in FSL.32 Using the DTIFIT Reconstruct tool in FDT, a diffusion tensor model was fitted at each voxel, and a fractional anisotropy (FA) map was generated. Probabilistic tractography was performed using FDT. We placed a seed ROI in a target region identified as an area associated with apathy in the above-mentioned PET analyses. A waypoint ROI was also defined in an area structurally connected with the target region. Probabilistic streamlines through each voxel by repetitive sampling from the principal direction were computed from the seed ROI through the waypoint ROI. This algorithm was performed with a tract curvature threshold of 0.2 mm, maximum number of steps of 2000, step length of 0.5 mm and 5000 samples, and generated connectivity streamlines were thresholded at a value equal to 5% of the maximum voxel intensity value in each subject in order to exclude spurious streamlines.
Statistical analysis
Group differences in demographic characteristics including age, education period, MMSE, FAB, AS and GDS were examined with unpaired two-tailed t test between AD patients with high and low AS scores and with Fisher’s exact test for gender. To examine group differences in the estimated mean 11C-PBB3 and 11C-PiB SUVR values of each volume of interest (VOI), unpaired two-tailed t-test was performed with Bonferroni correction to avoid type I errors due to multiplicity (p≤0.0071 as significant). We defined VOI(s) with significant uptake of PET ligand in AD patients with high AS scores relative to those with low AS scores as target region(s). We also tested group differences in the estimated mean cortical thickness of target region and mean FA values of the fibre connected with the target region by unpaired two-tailed t-test (p<0.05). Additionally, we analysed the relationship between AS and each estimated parameter using partial correlation analysis with age as covariate. In addition to the above-mentioned group-wise comparisons, correlations of AS scores with PET and MRI measures were analysed in all patients with AD examined here, since AS score is a variable continuously distributed among these cases and is accordingly a quantitative index representing the magnitude of apathy even if the value is below the cut-off (<16 points). Moreover, a structural equation modelling path analysis was performed to assess the relationships among AS scores, mean 11C-PBB3 and 11C-PiB SUVR values in the target region, mean cortical thickness of the target region and mean FA values of the fibres connecting the target and waypoint regions. To validate the model fitting, we conducted χ2 test, comparative fit index (CFI) and root mean square error approximation (RMSEA). We calculated Akaike’s information criterion (AIC) to determine a better model. A good fit of the model was defined by no significant results (p>0.05) of the χ2 test, CFI >0.97, RMSEA <0.05 and a relatively small AIC. Statistical and path analyses were performed using SPSS V.22 and AMOS V.22, respectively.
Results
Demographic data
Table 1 shows the demographic data in this study. There was no significant difference in age, education period, gender, MMSE, FAB and GDS between the two patient groups (p≥0.058). There was no significant association of AS with GDS (df=17, r=0.43, p=0.087), MMSE (df=17, r=−0.22, p=0.39) or FAB (df=17, r=−0.41, p=0.102) by Pearson’s correlation analysis.
Clinical and psychological data of current subjects
Demography of nine age-matched healthy controls without cognitive deficits, who were selected from participants in our previous study,15 is also displayed in table 1. We used PET measures of these subjects as references to confirm accumulations of tau and Aβ deposits in the brains of currently recruited AD cases. However, thorough comparisons between AD and control subjects were not performed, as a significant subset of clinical and image data, including AS scores and DTI images, were not available in these controls.
Group comparisons of estimated PET and MRI data
Table 2 shows the estimated imaging parameters in AD patients with low and high AS scores, along with control data derived from our previous work.15 PBB3 SUVRs were significantly elevated in both AD groups with low and high AS scores compared with cognitively healthy controls. As documented elsewhere,15 PBB3 SUVR in the cerebral cortex of control subjects were smaller than 1.0, since non-displaceable radioligand retention in the cerebellum was greater than those of neocortical and limbic cortices. Likewise, PBB3 SUVRs in several target regions of AD patients with low AS scores were found to be below 1.0. Despite this observation, AD patients with low AS scores exhibited significantly higher PBB3 SUVRs in the parietal (0.97±0.09 vs 0.83±0.05), lateral temporal (1.05±0.06 vs 0.95±0.04) and occipital (1.05±0.07 vs 0.90±0.03) cortices in comparison with control subjects (p<0.0071 by t-test with Bonferroni correction). AD patients with high AS scores showed even larger PBB3 SUVR values in the frontal cortex and OFC than patients with low AS scores (p=0.006 and p=0.007, respectively). None of the other regions showed significant differences in mean 11C-PBB3 SUVR values between the two patient groups (p≥0.015).
Group comparison of estimated PET and MRI data between AD patients with high and low AS scores
Representative 11 C-PBB3 SUVR images of the AD patients with low and high AS scores were shown in panels 1A and 1B of figure 1, respectively. In line with ROI-based analyses, voxel-by-voxel comparisons of PBB3 SUVR images between the two patient groups by statistical parametric mapping revealed that AD patients with high AS scores presented significantly greater radioligand retention in OFC than patients with low AS scores (figure 1C). In the 11 C-PiB SUVR analyses, no cortical regions showed differences between the two groups (p≥0.397).

Representative11 C-PBB3 SUVR PET images of AD patients with low (A) and high (B) AS scores. High radioligand retention in the superior sagittal sinus (yellow triangles in panels a and b) is a non-specific radioactivity accumulation. AD patient with high AS score showed remarkably increased radioligand retention in the vicinity of OFC (yellow arrows in panel b) relative to the patient with low AS score (A). Statistical parametric map illustrates greater accumulations of PBB3-detectable tau lesions in OFC in AD patients with high AS scores relative to those with low AS scores (C). Data are thresholded at false discovery rate-corrected p value <0.05 and extent threshold >600 voxels (C). 11 C-PBB3, 11C-pyridinyl-butadienyl-benzothiazole 3; AD, Alzheimer’s disease; AS, Apathy Scale; OFC, orbitofrontal cortex; PET, positron emission tomography; SUVR, standardised uptake value ratio.
Since OFC was extracted as a target region in the PET study, the OFC label was defined as adding lateral and medial division of bilateral OFC, which was applied to the measurement of mean cortical thickness in each participant. Furthermore, we focused on UNC because this area is associated with apathy in patients with AD and is structurally connected to OFC.33 To perform DTI analysis in UNC, we set a seed ROI in white matter on a coronal plane at the tip of the inferior horn of the lateral ventricle and a waypoint ROI in white matter on a coronal plane at the tip of the frontal horn of the lateral ventricle.34 The left and right UNCs were generated independently and were then added and binarised as bilateral UNC masks. We applied these masks to the original FA map and calculated the mean FA value of UNC. The mean OFC thickness and mean FA value of UNC did not significantly differ between AD patients with high and low AS scores (p=0.068 and p=0.054, respectively).
Analyses of correlations between AS and neuroimaging indices
Partial correlation analysis revealed a significant positive correlation between AS scores and mean 11C-PBB3 SUVR in OFC (figure 2A). Mean OFC thickness and mean FA values of UNC showed a significant negative correlation with AS scores (figure 2B,C). There was no significant correlation between AS scores and mean 11C-PiB SUVR values in OFC (r=0.22, p=0.408).

Correlations between AS and neuroimaging measures. (A): mean 11C-PBB3 SUVR values in OFC showed significant and positive correlation with AS scores (r=0.53, p=0.037). (B and C): mean OFC thickness (r=−0.53, p=0.033) and mean FA value of UNC (r=−0.51, p=0.044) showed significant and negative correlation with AS scores. Mean 11C-PiB SUVR values in OFC were not correlated with AS scores (p=0.408; data not shown). Filled and open circles indicate AD patients with high and low AS scores, respectively. 11C-PBB3, 11C-pyridinyl-butadienyl-benzothiazole 3; 11C-PiB, 11C-Pittsburgh compound-B; AS, Apathy Scale; FA, fractional anisotropy; OFC, orbitofrontal cortex; SUVR, standardised uptake value ratio; UNC, uncinate fasciculus.
Path analysis
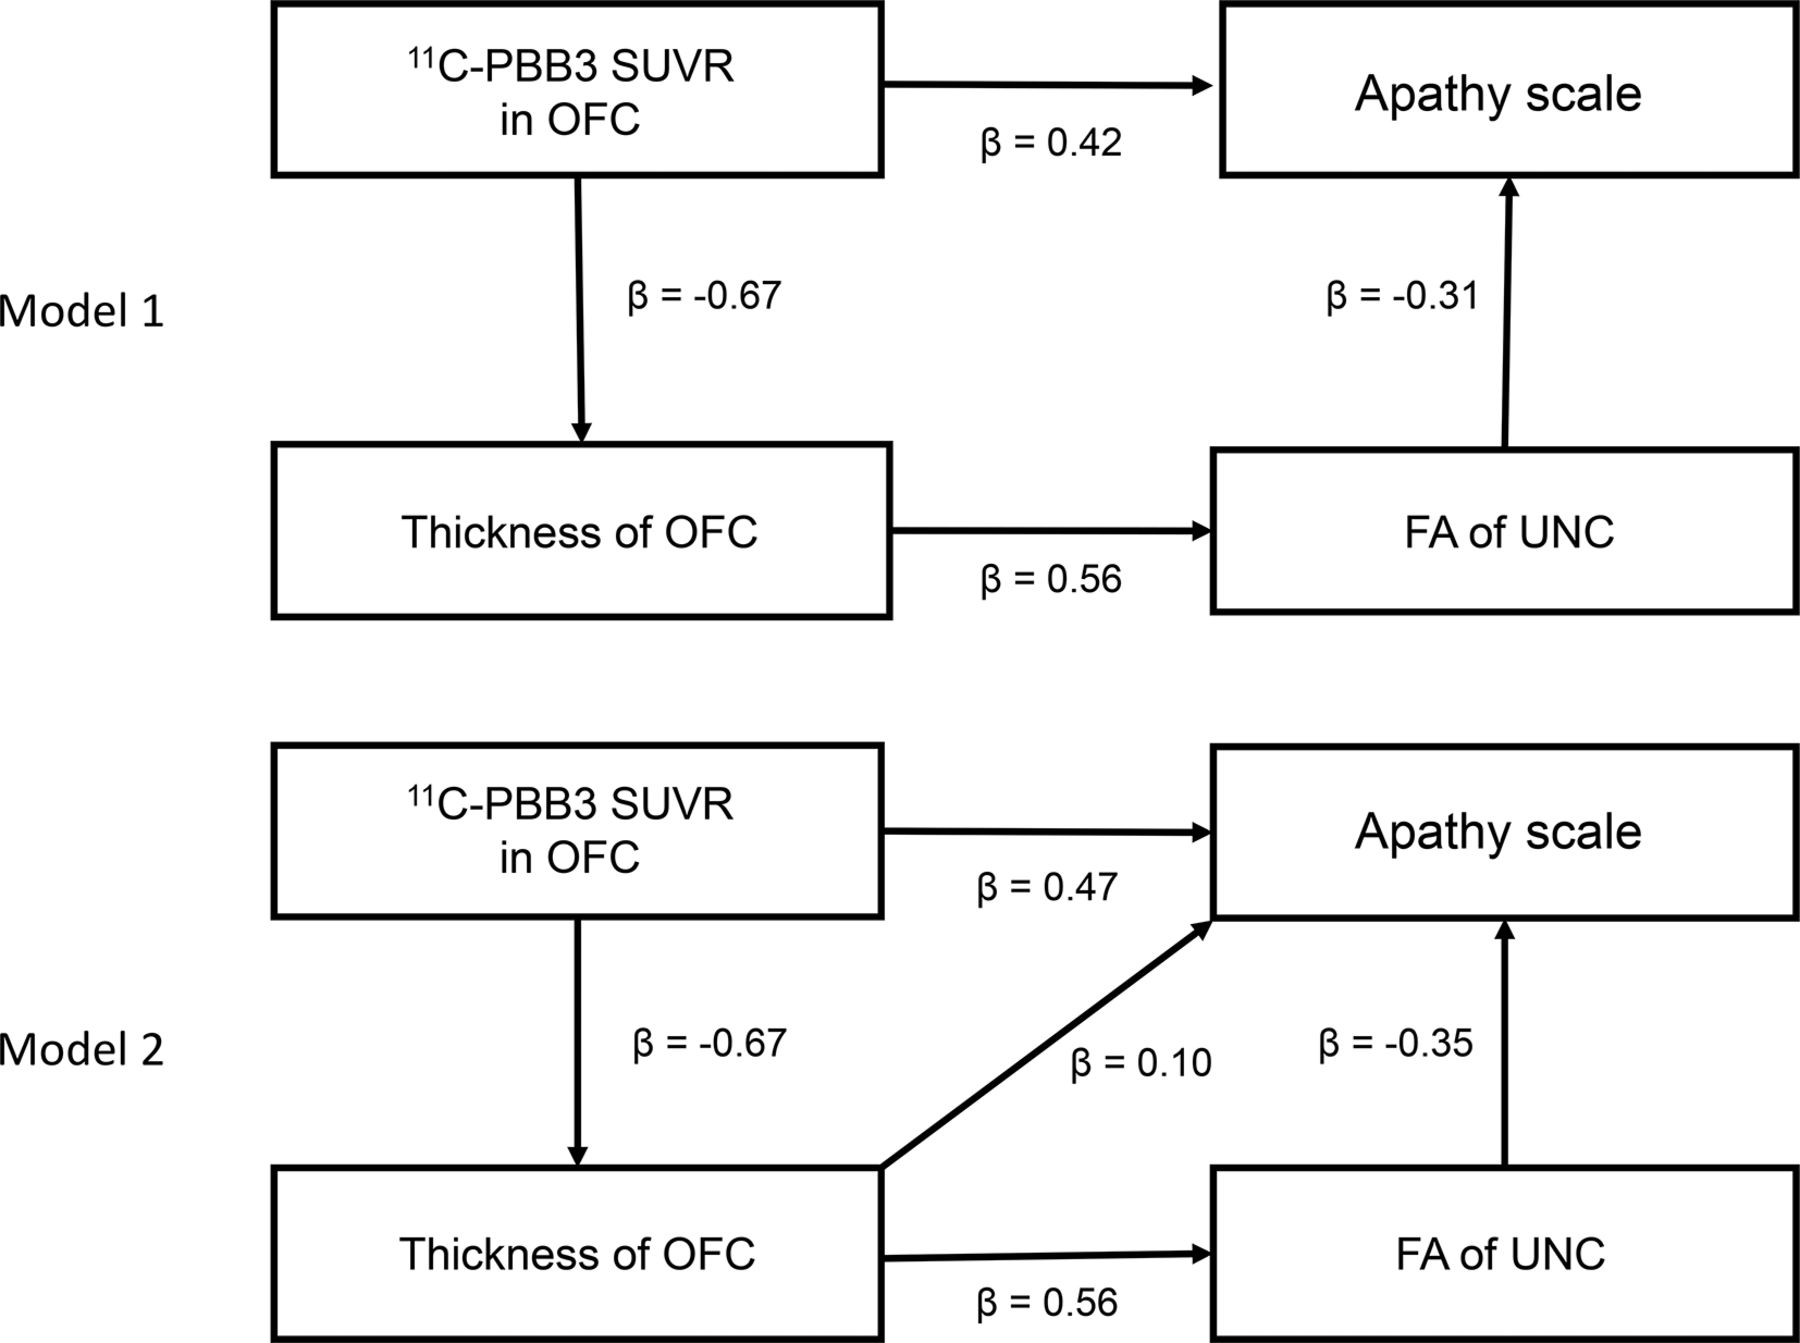
Partial correlation analysis with age as covariate demonstrated that mean 11C-PBB3 SUVR values in OFC were significantly and negatively correlated with mean OFC thickness (r=−0.73, p=0.001) but were not correlated with mean FA values of UNC (r=−0.33, p=0.209). Two path analysis models incorporating these imaging indices could be created to describe apathy (figure 3). Although both path models well described the AS scores (model 1: χ2 (2)=0.242, p=0.886, CFI=1.000, RMSEA <0.001; model 2: χ2 (2)=0.131, p=0.718, CFI=1.000, RMSEA <0.001), model 1 (AIC=16.242) showed a better fit than model 2 (AIC=18.131). In the first path of model 1, mean 11C-PBB3 SUVR values in OFC were positively correlated with AS scores (β=0.42). In the second path of this model, mean 11C-PBB3 SUVR values in OFC were negatively correlated with mean thickness of OFC (β=−0.67), which further showed a positive correlation with mean FA in UNC (β=0.56), and this FA was then negatively correlated with AS scores (β=−0.31). We also examined path models without relationships between mean 11C-PBB3 SUVR values in OFC and AS scores (data not shown), but these models did not exhibit a better fit than model 1.

Path analysis models among AS scores and neuroimaging measures. Numbers accompanying arrows are path coefficients. 11C-PBB3, 11C-pyridinyl-butadienyl-benzothiazole 3; 11C-PiB, 11C-Pittsburgh compound-B; AS, Apathy Scale; FA, fractional anisotropy; OFC, orbitofrontal cortex; SUVR, standardised uptake value ratio; UNC, uncinate fasciculus.
Discussion
The current findings indicate the significance of tau pathologies in OFC detectable by 11C-PBB3-PET as a neuropathological basis of apathy in AD. In addition, the relationship between tau accumulation and apathy is independent of cognitive impairments and depressive state supported by Pearson’s correlation analysis, highlighting tau-triggered neurodegenerative processes unique to the pathogenesis of apathy. Neuronal loss in OFC assessed by volumetric MRI and nerve fibre disruptions in UNC quantified by DTI also displayed a tendency to differ between AD cases with high and low AS scores and were significantly correlated with the degree of apathy. These structural alterations were not independent of tau depositions in OFC, since tau PET signals in OFC were intimately associated with OFC thickness, leading to the view that aggregated tau species cause neural death on site. FA values in UNC were closely correlated with OFC thickness rather than tau load in OFC, suggesting that the OFC-UNC connectivity was disrupted by the loss of OFC neurons, which was in turn triggered by tau accumulations.
Correspondingly, a path model supported a mechanistic cascade underlying apathy in AD, which was constituted of the tau pathology in OFC as an initiator, loss of OFC neurons as an intermediate and disconnected OFC-UNC network as a downstream effector on apathy. In this path analysis, model 1 described AS scores with the smallest AIC and consisted of two mechanistic pathways. The first path reflected a direct link of the tau deposition to apathy without structural measures in OFC and UNC. This may imply that PET-detectable tau fibrils give rise to functional deficits in neurons by their neurotoxicity. Apathy has been defined as a decrease of voluntary action and goal-directed behaviour.4 OFC is regarded as a region critically involved in decision making, reward processing and emotional control, considered as the association with goal-directed behaviour.35 36 Our findings suggested that tau neurotoxicity induces functional deficits in OFC such as synaptic dysfunction, resulting in manifestation of apathy in AD.
The second path in model 1 indicated that the OFC-UNC network abnormality is also critical for the occurrence of apathy. UNC anatomically connects among OFC, temporal cortex and several limbic regions such as the amygdala.33 UNC is a component of Yakovlev’s circuit, which is related to language, episodic memory and social emotional processing.10 37 Additionally, the amygdala is an important structure for motivation. Previously, structural deteriorations of OFC and UNC were reported to be associated with apathy in frontotemporal degeneration,38 which is in line with our results. Our findings indicated that tau-induced neuronal death in OFC causes disruption in the associated white matter bundle. This OFC-UNC network abnormality leads to worsened reward and emotional processing, resulting in apathy.
As tau depositions may induce deteriorations of neurons, PBB3 SUVRs could be correlated with general cognitive deficits and disruption of total frontal lobe functions accompanied by depression, and apathetic symptoms might emerge in a manner parallel to the progression of these manifestations. Indeed, the ratio of AD dementia versus MCI due to AD cases differed between the two groups with high and low AS scores, and PBB3-detectable tau burdens in all target ROIs of patients with high AS scores showed a tendency to be greater than those of patients with low AS scores. However, there were no significant differences in the scores of MMSE, FAB and GDS between the two patient groups (table 1). Moreover, these psychometric measures correlated with neither AS scores nor PBB3 SUVR in OFC. These results indicate that apathy at a relatively early clinical stage of AD is not concurrent with general deteriorations of cognitive and/or frontal lobe-associated functions but may occur in specific relation to tau-provoked OFC deficits.
Additionally, we evaluated path models by incorporating MMSE, GDS and/or FAB scores as model variables. Although we did not find any significant path models including MMSE and/or FAB scores in the current patients with AD, several path models incorporating GDS scores were suggestive of being valid without significance (p>0.05) of χ2 and RMSEA <0.05 (online supplementary figure 1). However, AIC values of the path analysis models without GDS (models 1 and 2) were lower than those of the models with GDS. Hence, apathetic symptoms in AD may be better described by local pathological changes in OFC and consequent OFC-UNC disconnections without consideration of the general mood status, while it is yet to be determined whether this notion is adequate throughout the clinical advancement of AD.
Supplementary file 1
![[SP1.jpg]](https://jnnp.bmj.com/content/jnnp/89/11/1208/DC1/embed/inline-supplementary-material-1.jpg?download=true)
As mentioned above, MMSE scores did not correlate with AS scores, unlike a previous work reporting that Apathy Evaluation Scale was associated with MMSE scores in patients with AD.39 Although this previous study covered mild, moderate and severe patients with AD,39 the subjects included in the present study were mainly patients with early-stage AD spectrum with relatively high MMSE and low GDS scores in a narrow range. Therefore, these distinct clinical stages covered by the two studies may partially explain the somewhat discrepant results. Additionally, the present and previous study evaluated apathetic symptoms by AS and Apathy Evaluation Scale, respectively, and there is a possibility that MMSE scores are differentially associated with these adopted scales.
In contrast with tau burdens, there was no significant difference in PET-visible Aβ accumulations between AD patients with low and high AS scores. This is in agreement with previous reports documenting that Aβ deposits measured by PET reached a plateau at an MCI stage.40 Thus, Aβ pathologies at a steady-state level along the transition from MCI to early AD dementia may not overtly influence apathetic statuses. Our result is in line with previous reports. Judging from above-mentioned result, we considered that Aβ accumulation would not have any influence on the current findings.
Furthermore, we did not find any significant association between AS and 11C-PiB SUVR values in OFC. This is in agreement with the notion that tau lesions are more clearly implicated in neurodegenerative processes than Aβ plaques in AD. Indeed, some previous studies reported that the Aβ burden was not associated with cognitive dysfunctions in the course of AD,41 and our results may support that there exists a tight link of tau rather than Aβ pathologies to BPSD including apathy. However, other studies reported that the Aβ burden was related to apathy.42 43 This discrepancy may be due to differences in the range of PiB retention and tau burdens in these studies.
The present study is burdened by the limitation of small sample size. Since we employed relatively conservative methods for statistical tests here, we regarded our positive results as reliable despite the small number of subjects highlighting OFC as an anatomical structure intimately linked to apathetic manifestations. Therefore, we subsequently investigated structural alterations by focusing on the OFC and UNC. Furthermore, even AD with low AS scores as well as AD with high AS scores showed significantly elevated PBB3 SUVRs in some brain regions compared with cognitively healthy controls (table 2), suggesting that the statistical manner used in the present study was not too conservative. Whether focal damage and fibre disruption in other cortical regions affect apathy in AD, however, is indeterminate. Exhaustive structural assays covering extensive brain areas should be performed with larger numbers of subjects and by statistical tests with adequate liberality in future examinations.
In conclusion, our findings highlight the significance of the PET-visible tau tangle formation in OFC and the resultant disruption of the OFC-UNC network as pathogenetic elements of apathy. Similar sequential inductions of tau depositions, local neuronal loss and disconnection of associated nerve fibres could be responsible for other diverse non-cognitive symptoms of AD, and such mechanisms would be identifiable by neuroimaging approaches as employed here. The current data also raise the possibility that emerging antitau drugs would be efficacious for suppressing apathy, if the structural and functional integrities of the OFC-UNC system can be therapeutically rescued. In this context, combined tau PET and MRI assays will offer means to monitor the upstream to downstream processes crucially affecting apathetic symptoms along the course of AD in both the absence and presence of therapeutic interventions.
Acknowledgments
The authors would like to thank all patients and their caregivers for participation in this study. The authors also acknowledge the support of K. Suzuki, S. Kawakami, J. Ichikawa, and the radiochemistry staffs and radiological technologists at NIRS (no particular order). The authors acknowledge support for the recruitment of patients with cognitive decline of Y. Yoshiyama at the Inage Neurology and Memory Clinic, K. Kashiwado at Kashiwado Hospital, and K. Suzuki at the Shirogane Orthopedics Clinic.
References
Footnotes
Contributors Authors’ contributions are as follows: (1) substantial contributions to conception and design, or acquisition of data, or analysis and interpretation of data: SKi and HS; (2) drafting the article or revising it critically for important intellectual content: all authors; (3) final approval of the version to be published: all authors.
Funding This work was partly supported by JSPS KAKENHI Grant-in-Aid for Young Scientists (B) (JP15K19756) to SoK from the Japan Society for the Promotion of Science; the Young Scientists (A) (26713031) to H Shimada from the Ministry of Education, Culture, Sports, Science and Technology, Japan; the Kashiwado Memorial Foundation to H Shimada; the Brain Mapping by Integrated Neurotechnologies for Disease Studies (Brain/MINDS) and AMED under Grant Number JP17dm0207007.
Competing interests H Shimada, M-RZ, TS and MH hold a patent on compounds related to the present report (JP 5422782/EP 12 884 742.3).
Patient consent Not required.
Ethics approval This study was approved by the Institutional Review Board of the National Institute of Radiological Sciences (NIRS), in accordance with the ethical code of NIRS and the ethical guidelines for clinical studies presented by the Ministry of Health, Labour and Welfare in Japan, as well as the Declaration of Helsinki. Written informed consent was obtained from all patients and from their spouses or other close family members. The study was registered with UMIN Clinical Trials Registry (UMIN-CTR; number 000009863).
Provenance and peer review Not commissioned; externally peer reviewed.