Article Text

Statistics from Altmetric.com
Olsson T, Boster A, Fernández Ó, et al. Oral ponesimod in relapsing–remitting multiple sclerosis: a randomised phase II trial. J Neurol Neurosurg Psychiatry 2014;85:1198–1208.
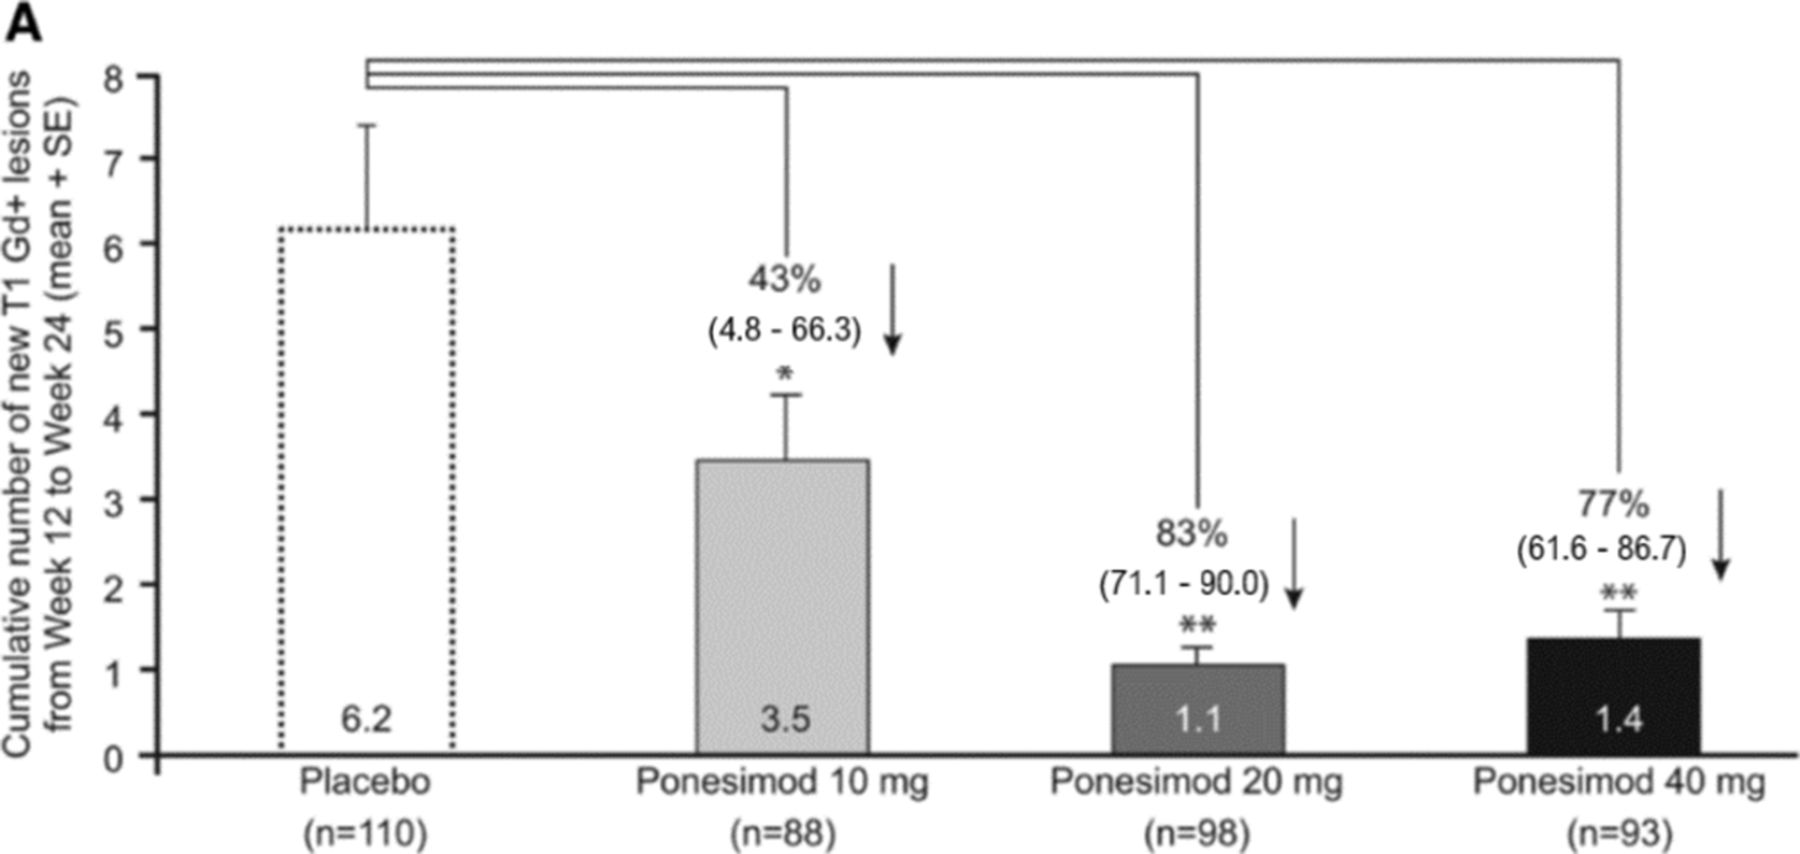
For Figure 3 (A), the 95% CI values provided for the 3 Ponesimod groups below each percent (e.g., 10 mg shows 43% (0.34-0.95)) are not correct as the CI intervals belong to the treatment effect [ratio] and not percentage reduction. Instead, for Figure 3 (A), the graph should indicate the following: 10 mg: 43% (95% CI: 4.8-66.3), 20 mg: 83% (95% CI: 71.1-90.0), and 40mg: 77% (95% CI: 61.6-86.7).
Figure legend should read as follows:
(A) Cumulative number of new T1 Gd +lesions detected by magnetic resonance image scanning at weeks 12–24 (per-protocol analysis set). Graph shows mean+SE.SE The percentage reduction (95% CI) vs placebo is shown for each ponesimod treatment group. (B) Dose–response analysis for the cumulative number of new T1 Gd +lesions from week 12 to 24 (per-protocol analysis set). Black dots represent the mean value for each dose and grey dots represent the fitted models obtained in the bootstrap process. *p<0.05; **p<0.0001. T1 Gd+, T1-weighted gadolinium-enhanced.