Article Text

Abstract
Objective Inflammation plays a crucial role in the pathogenesis of mild cognitive impairment (MCI) and Alzheimer’s disease (AD). Our study aimed to analyse previous inconsistent results of inflammatory markers in AD and MCI quantitatively.
Methods Studies reporting concentrations of peripheral or cerebrospinal fluid (CSF) markers were included, and eligible data on AD, MCI and control were extracted. Pooled Hedges’s g was adopted to illustrate comparisons, and various confounding factors were used to explore sources of heterogeneity.
Results A total of 170 studies were included in the meta-analysis and systematic review, which demonstrated increased peripheral levels of high-sensitivity C reactive protein (Hedges’s g 0.281, p<0.05), interleukin-6 (IL-6) (0.429, p<0.005), soluble tumour necrosis factor receptor 1 (sTNFR1) (0.763, p<0.05), soluble tumour necrosis factor receptor 2 (sTNFR2) (0.354, p<0.005), alpha1-antichymotrypsin (α1-ACT) (1.217, p<0.005), IL-1β (0.615, p<0.05) and soluble CD40 ligand (0.868, p<0.005), and CSF levels of IL-10 (0.434, p<0.05), monocyte chemoattractant protein-1 (MCP-1) (0.798, p<0.005), transforming growth factor-beta 1 (1.009, p<0.05), soluble triggering receptor expressed on myeloid cells2 (sTREM2) (0.587, p<0.001), YKL-40 (0.849, p<0.001), α1-ACT (0.638, p<0.001), nerve growth factor (5.475, p<0.005) and visinin-like protein-1 (VILIP-1) (0.677, p<0.005), in AD compared with the control. Higher levels of sTNFR2 (0.265, p<0.05), IL-6 (0.129, p<0.05) and MCP-1 (0.779, p<0.05) and lower levels of IL-8 (−1.293, p<0.05) in the periphery, as well as elevated concentrations of YKL-40 (0.373, p<0.05), VILIP-1 (0.534, p<0.005) and sTREM2 (0.695, p<0.05) in CSF, were shown in MCI compared with the control. Additionally, increased peripheral sTNFR1 (0.582, p<0.05) and sTNFR2 (0.254, p<0.05) levels were observed in AD compared with MCI.
Conclusion Significantly altered levels of inflammatory markers were verified in comparison between AD, MCI and control, supporting the notion that AD and MCI are accompanied by inflammatory responses in both the periphery and CSF.
- inflammation
- mild cognitive impairment
- Alzheimer’s disease
- peripheral blood
- cerebrospinal fluid
- meta
Statistics from Altmetric.com
Introduction
Alzheimer’s disease (AD) is the primary common type of dementia, increasing at an alarming rate in older people.1 It is one of the severest neurodegenerative disorders leading to decreased quality of daily life, disability and eventually death.2 Before patients are diagnosed with dementia, they first go through a stage recognised as mild cognitive impairment (MCI), which is widely considered as the intermediate stage between intact cognition and pathological cognitive ageing.3 Accumulating evidence has suggested that inflammatory responses play a critical role in the neurodegenerative cascades of AD and MCI,4 5 and several markers have some tracing and detecting accuracy for disease severity and progression.6–8
Inflammatory markers such as the tumour necrosis factor α (TNF-α), interleukin-6 (IL-6), chitinase-3-like protein 1 (CHI3L1 or YKL-40) and the acute phase reactant protein C reactive protein (CRP) have been reported as important signalling molecules in inflammation that exert effects on the brains or the periphery of people with dementia.6 9 10 Decreased levels of circulating IL-8 are shown to be involved in AD pathogenesis and may serve as a potential biomarker for monitoring disease progression.7 However, other studies have observed higher peripheral IL-8 levels in patients with AD compared with the healthy elderly.9 11 Inflammatory marker performances in individual studies vary greatly and need comprehensive analyses.12 13
Previous meta-analyses have demonstrated that some inflammatory markers in the peripheral blood or cerebrospinal fluid (CSF) differ between the AD group and the normal controls.6 14 15 But they lack the most recent updated information or have limitations with only peripheral data and only AD comparison with the control. To update this clinical evidence, this meta-analysis and systematic review was conducted to investigate whether the concentrations of specific inflammatory markers differ quantitatively among patients with AD and MCI and the controls as measured from the peripheral blood and CSF.
Methods
Search strategy and selection criteria
This meta-analysis and systematic review was performed according to the Preferred Reporting Items for Systematic Reviews and Meta-Analyses guidelines. Original studies reporting measurements of inflammatory markers in the peripheral blood or CSF were searched between 1 January 1960 and 1 October 2018 through PubMed, Embase, Cochrane Library and Web of Science. Search terms are presented in online supplementary material 1. The reference lists of relevant articles were also scanned for broader reports.
Supplemental material
English-language or Chinese-language publications reporting concentrations of inflammation-associated markers in living human beings were included if they met the following criteria: (1) original studies reported data in at least two of the groups (AD, MCI and control); (2) literature sources and necessary data were available; and (3) the principles that these studies used to diagnose AD and MCI were qualified. The selection criteria for subjects are presented in online supplementary material 1. Articles were excluded if they measured marker concentrations in postmortem samples, had sample size less than 5, and reported stimulated levels of markers in vitro or used the samples that overlapped with other studies. We have contacted some corresponding authors via email, and according to their replies prompt and proper adjustments were made to ensure no overlapped research population. Quality assessments of all potentially eligible studies were conducted using the Newcastle-Ottawa Scale (NOS). Studies with NOS scores lower than 5 were recognised to be of inferior quality and therefore excluded. Inflammatory markers measured in less than three studies were assessed qualitatively in the systematic review.
Data extraction
Data were taken from cross-sectional studies and baseline of longitudinal studies included. The sample sizes and mean (±SD) concentrations of markers in those eligible literatures were extracted as the primary data, independently by two of the authors (X-NS and L-DN). Marker concentrations that are presented as stratified data or IQR were converted to applicable data using mathematical formulas for meta-analysis (if requested data from corresponding authors were not available).16 17 Study characteristics (ie, first author, publication year, PubMedUniqueIdentifier (PMID)) and information for potential moderator analysis (ie, age, gender, education) were collected (see online supplementary material 2). Any inconsistencies were resolved by consensus.
Supplemental material
Statistical analysis
Statistical analysis was performed using the Comprehensive Meta-Analysis Software (V.2). To adjust for the potential biases resulting from small sample sizes, Hedges’s g was chosen as the final effect size (ES),18 which was converted from standardised mean differences primarily generated from sample size and mean (±SD) marker concentration. The more conservative random-effects model was adopted rather than the fixed-effects model. To circumvent the substantial variability caused by experimental methods and different laboratories, we used ratios between groups (ie, mean marker concentrations of AD group to the control group ratio) to illustrate more intuitionistic comparisons for consolidated evidence. Every specific ratio was calculated from a single study, and the mean ratio for each marker suggested the combined results of all included studies assessing the same marker.
We conducted sensitivity analyses by excluding one research at a time to assess the robustness of the outcomes. Cochrane Q test was used to calculate between-study heterogeneity, and inconsistency was estimated using the I2 index for the proportion of total variability due to heterogeneity. Subgroup analyses were conducted to investigate the possible effect of sample type and assay type. Meta-regression analyses were used to regress the ES against potential confounding factors (ie, age). Publication bias was inspected by funnel plot, and statistical significance was assessed by Egger’s test, which calculated funnel plot asymmetry. Potential publication biases were further evaluated by the classic fail-safe N method, which analysed the number of missing studies that would lead to a statistically non-significant overall effect. P value <0.05 was accepted to be of statistical significance.
Results
Literature search findings
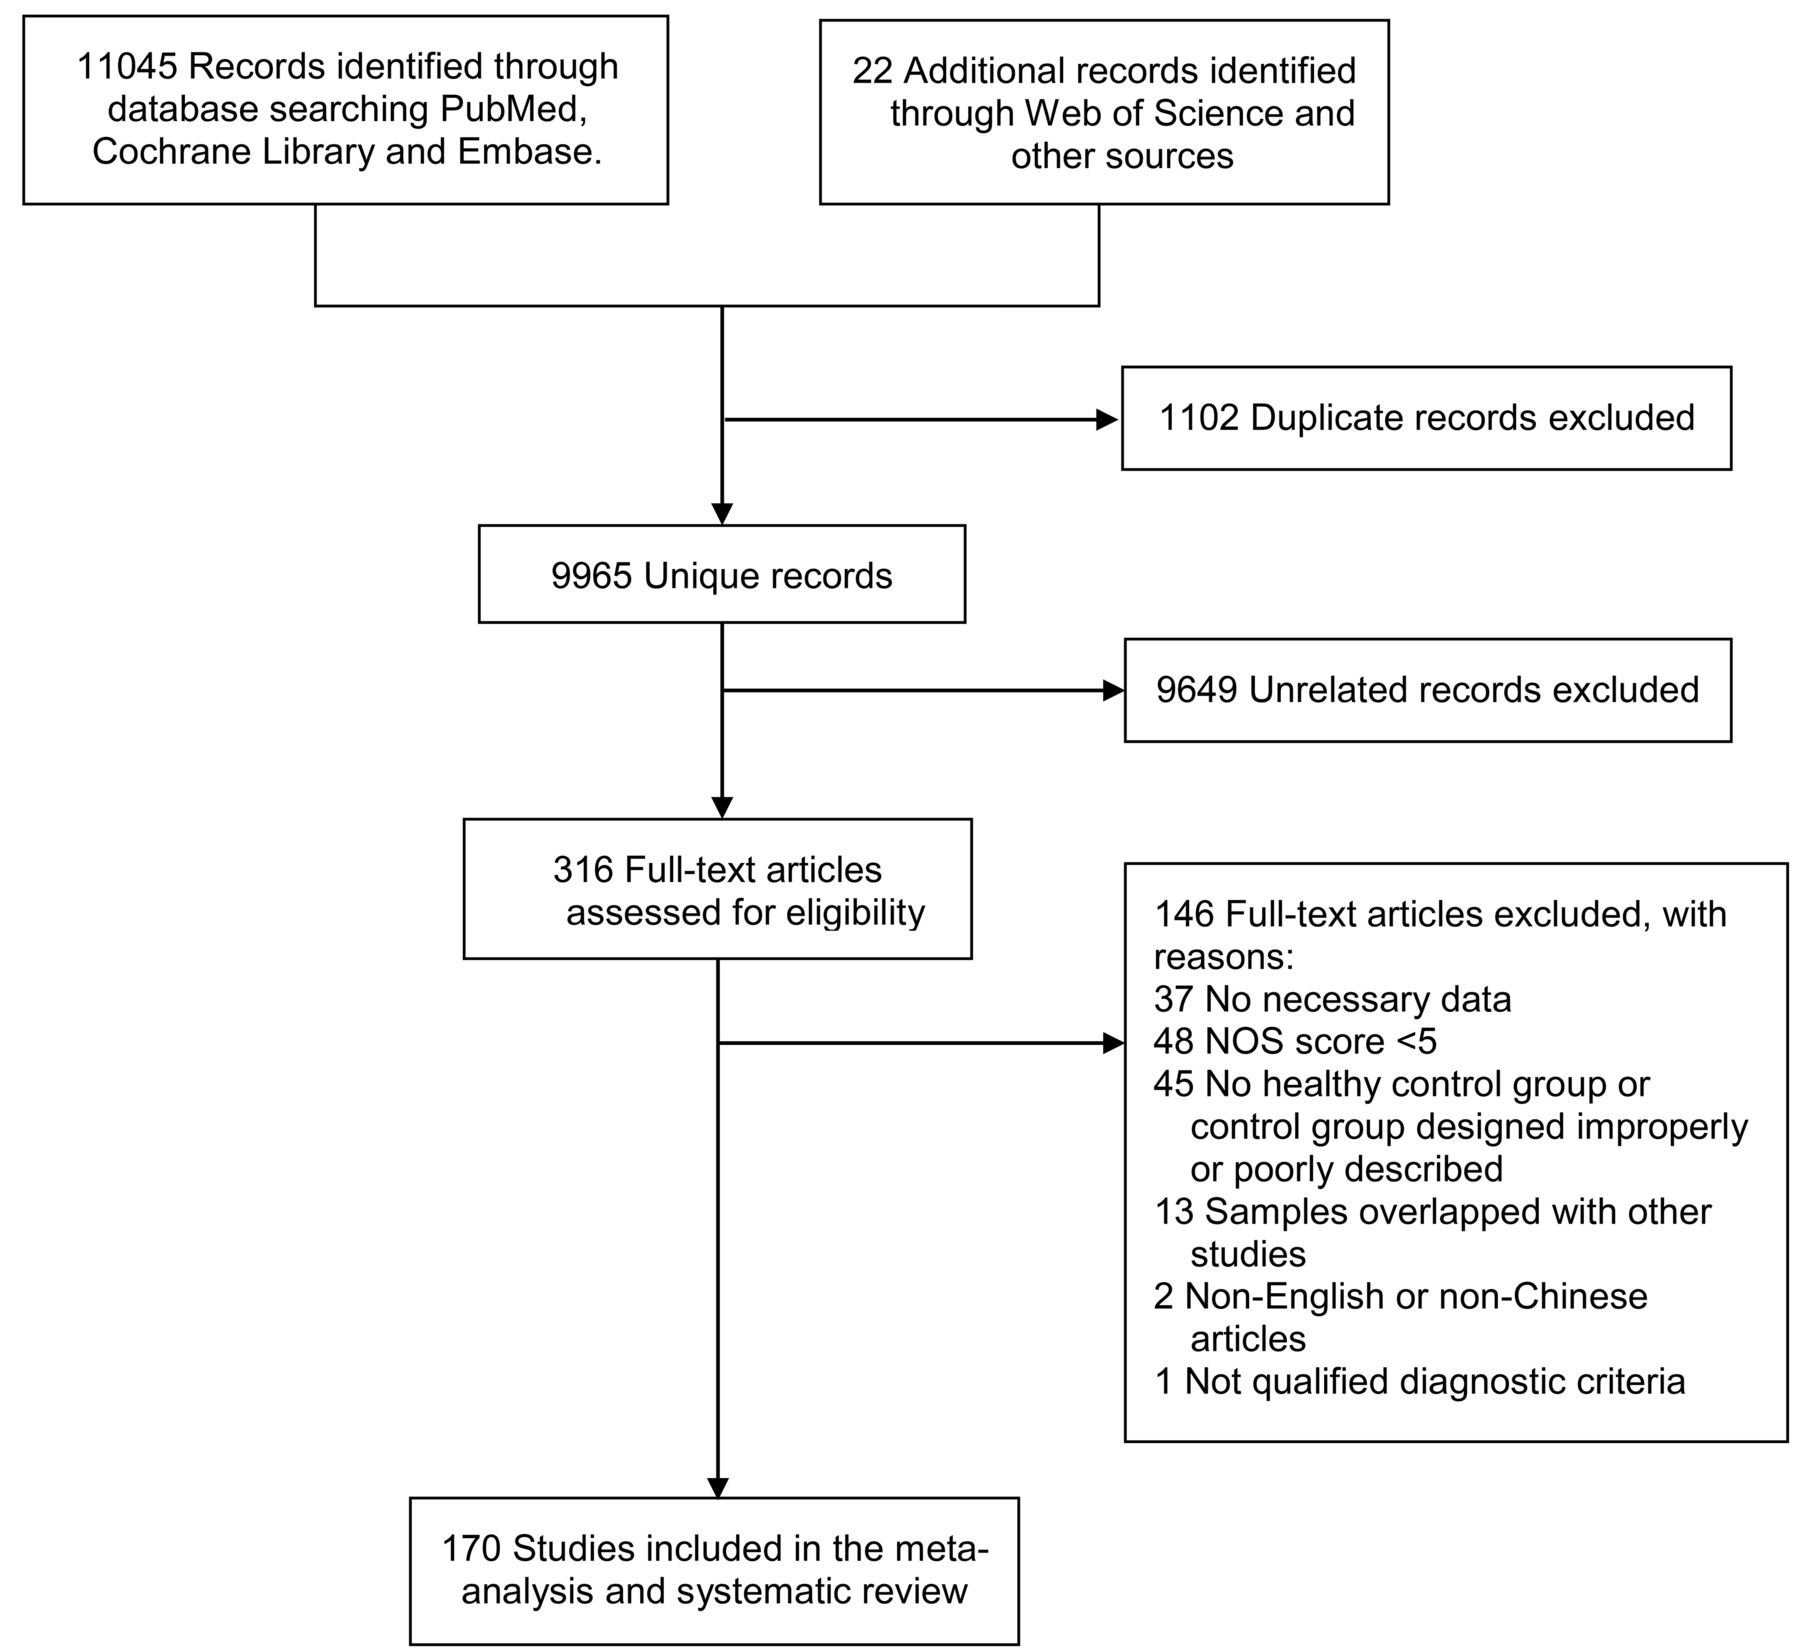
The initial literature search generated altogether 11 067 records (see flow chart in figure 1). A total of 170 studies measuring peripheral or CSF inflammatory markers were ultimately included, combining results for 9842 subjects with AD, 3526 subjects with MCI and 9002 controls (online supplementary materials 2 and 3). Among these, 46 markers were quantitatively analysed in the meta-analysis (online supplementary material 4; results with p<0.05 are shown in figures 2 and 3), while others were presented in the systematic review (online supplementary material 5; figures 4 and 5). Baseline characteristics and quality assessments of the studies are detailed in online supplementary material 2. All official marker names are presented in online supplementary material 6. Individual marker performances and heterogeneity analyses are shown in online supplementary material 7.
Supplemental material
Supplemental material
Supplemental material
Supplemental material

Preferred Reporting Items for Systematic Reviews and Meta-Analyses flow chart of the literature search. NOS, Newcastle-Ottawa Scale.

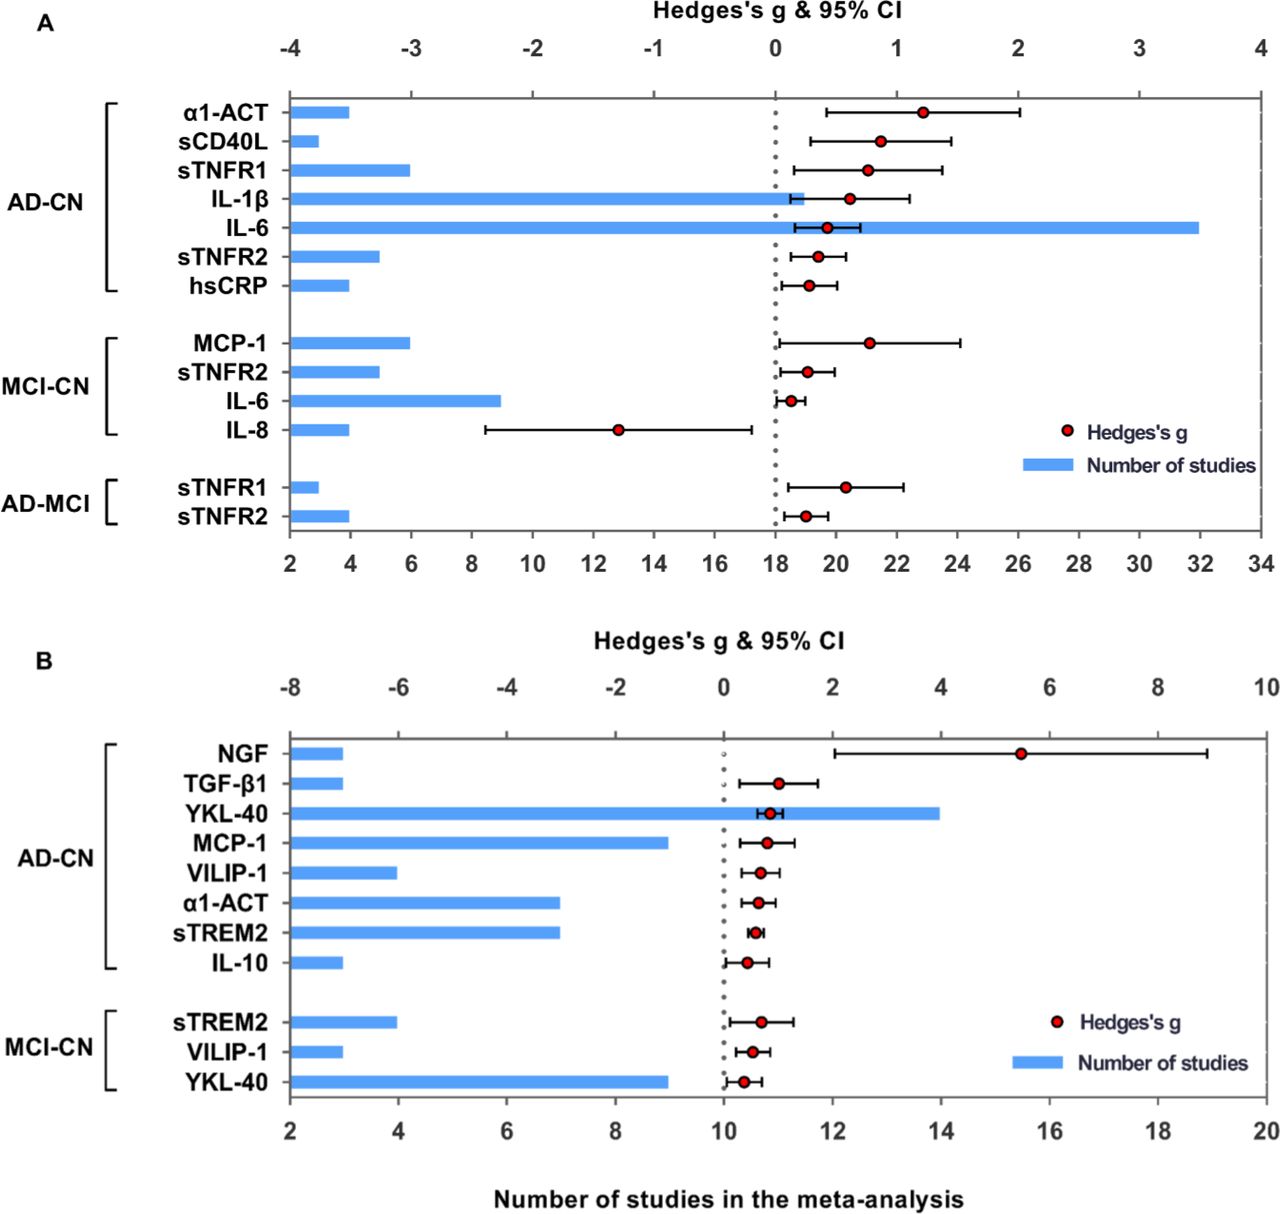
Comparative outcomes of blood and CSF markers in the meta-analysis. Peripheral (A) and CSF (B) inflammatory markers with significant effect sizes (Hedges’s g) are displayed in groups of comparisons (AD-CN, MCI-CN and AD-MCI). Red spots indicate Hedges’s g of each marker, and blue bars indicate the number of studies included. α1-ACT, alpha1-antichymotrypsin; AD, Alzheimer’s disease; CN, controls; CS, cerebrospinal fluid; hsCRP, high-sensitivity C reactive protein; IL, interleukin; MCI, mild cognitive impairment; MCP-1, monocyte chemoattractant protein-1; NGF, nerve growth factor; sCD40L, soluble CD40 ligand; STNFR1, soluble tumour necrosis factor receptor 1; STNFR2, soluble tumour necrosis factor receptor 2; STREM2, soluble triggering receptor expressed on myeloid cells2; TGF-β1, transforming growth factor-beta; VILIP-1, visinin-likeprotein-1.

Biomarker performance rating of peripheral blood and CSF in the meta-analysis. Biomarker performance in serum and plasma (A) and CSF (B) based on average ratios. Biomarkers illustrated in green are significant with effect sizes in patients with AD versus CN, in blue significant in patients with MCI versus CN, and in pink significant in patients with AD versus MCI. α1-ACT, alpha1-antichymotrypsin; AD, Alzheimer’s disease; CN, controls; CSF, cerebrospinal fluid; hsCRP, high-sensitivity C reactive protein; IL, interleukin; MCI, mild cognitive impairment; MCP-1, monocyte chemoattractant protein-1; sCD40L, soluble CD40 ligand; sTNFR1, soluble tumour necrosis factor receptor 1; sTNFR2, soluble tumour necrosis factor receptor 2.
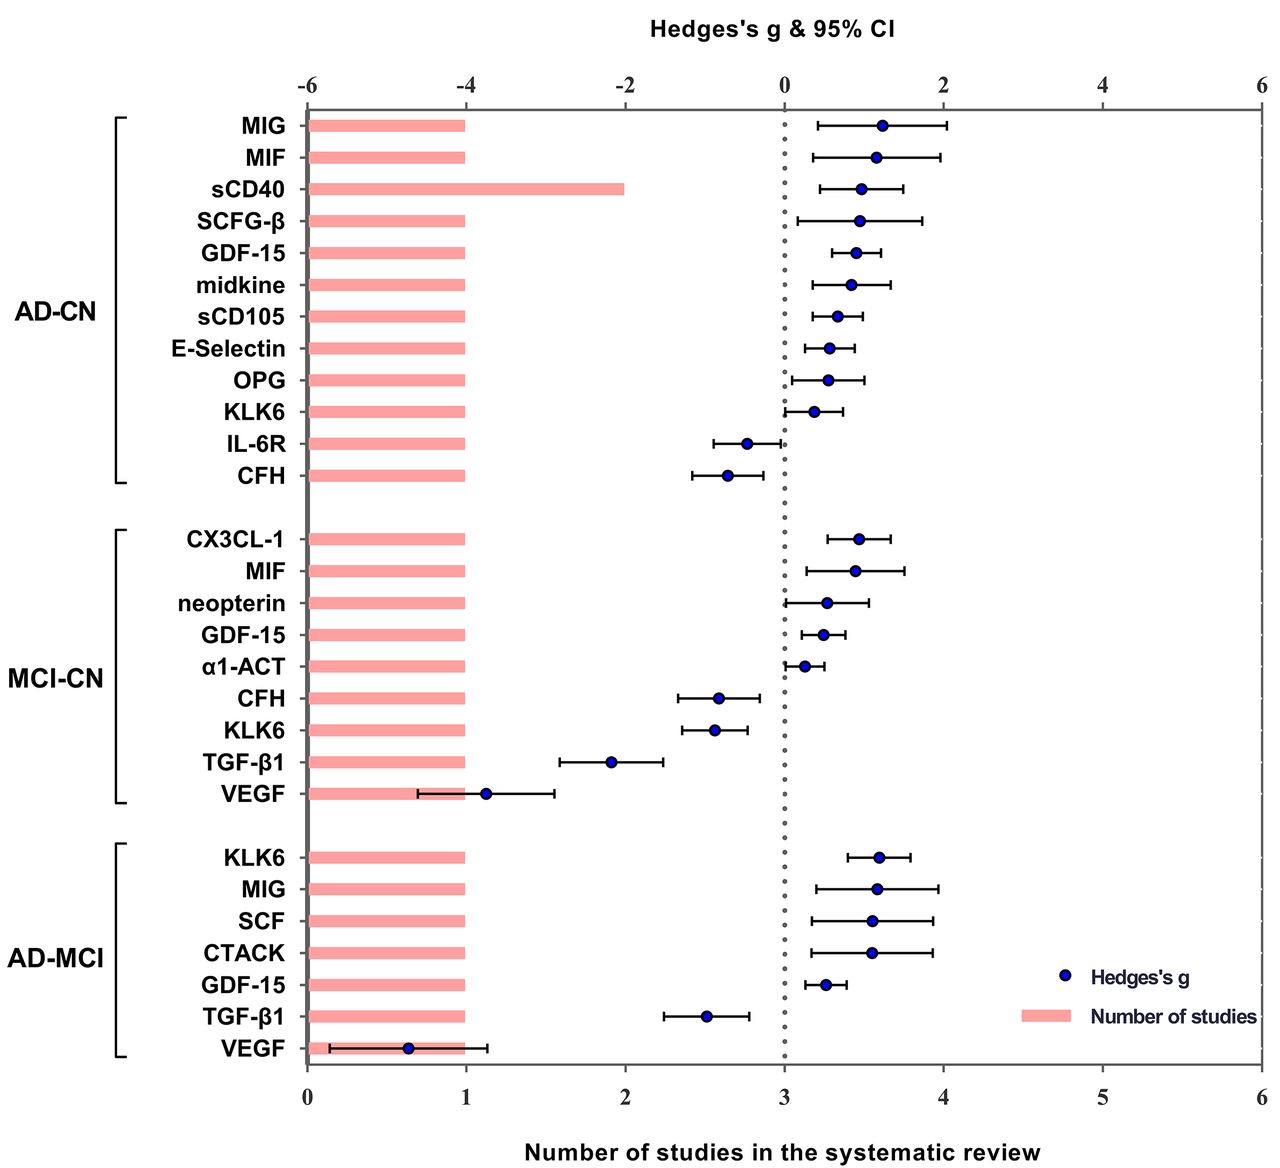
Performance of peripheral blood markers in the systematic review. Significant serum and plasma markers of one or two studies are performed in the systematic review. Blue spots indicate Hedges’s g of each marker, and pink bars indicate the number of studies included. α1-ACT, alpha1-antichymotrypsin; AD, Alzheimer’s disease; CFH, complement factor H; CN, controls; CTACK, cutaneous T-cell attracting chemokine; CX3CL-1, CX3 chemokine ligand 1; IL, interleukin; GDF-15, growth differentiation factor-15; KLK6, kallikrein-related peptidase 6; MCI, mild cognitive impairment; MIF, macrophage migration inhibitory factor; MIG, C-X-C motif chemokine ligand 9; OPG, osteoprotegerin; SCD40, sCD40, soluble CD40; SCFG-B, stochastic context-free grammar beta; TGF-β1, transforming growth factor-beta; VEGF, vascular endothelial growth factor.

Performance of CSF markers in the systematic review. Significant CSF markers of one or two studies are displayed in the systematic review. Blue spots indicate Hedges’s g of each marker, and pink bars indicate the number of studies included. AD, Alzheimer’s disease; BDNF, brain-derived neurotrophic factor; CN, controls; CSF, cerebrospinal fluid; CX3CL-1, CX3 chemokine ligand 1; GDNF, glial cell line-derived neurotrophic factor; IL, interleukin; IL-2r, soluble IL-2 receptor; IP, isoprostane; MCI, mild cognitive impairment; M-CSF, macrophage colony-stimulating factor; OPN, osteopontin; S100A9, S100 calcium-binding protein A9; SCD14, soluble CD14; SCF, haematopoietic growth factors-like stem cell factors; SP, substance P; sTNFR I, soluble tumour necrosis factor receptor 1; sTNFR II, soluble tumour necrosis factor receptor 2.
Comparisons between AD and control in peripheral marker levels
Random-effects results demonstrated that patients with AD had higher levels for high-sensitivity CRP (hsCRP) (Hedges’s g 0.281; 95% CI 0.051 to 0.511, p<0.05), IL-6 (Hedges’s g 0.429; 95% CI 0.160 to 0.699, p<0.005), soluble tumour necrosis factor receptor 1 (sTNFR1) (Hedges’s g 0.763; 95% CI 0.153 to 1.373, p<0.05), soluble tumour necrosis factor receptor 2 (sTNFR2) (Hedges’s g 0.354; 95% CI 0.126 to 0.582, p<0.005), alpha1-antichymotrypsin (α1-ACT) (Hedges’s g 1.217; 95% CI 0.421 to 2.013, p<0.005), IL-1 beta (IL-1β) (Hedges’s g 0.615; 95% CI 0.124 to 1.107, p<0.05) and soluble CD40 ligand (sCD40L) (Hedges’s g 0.868; 95% CI 0.289 to 1.448, p<0.005) (figure 2, online supplementary material 4A). The AD/control ratios of markers with significant ES were calculated to further manifest peripheral performances: hsCRP (mean ratio 3.046, p=0.176), IL-1β (2.463, p<0.001), sCD40L (2.368, p=0.007), sTNFR1 (1.962, p=0.036), IL-6 (1.898, p<0.0001), α1-ACT (1.325, p=0.006) and sTNFR2 (1.278, p<0.001) (figure 3).
Comparisons between MCI and control in peripheral marker levels
Random-effects meta-analyses showed increased peripheral levels of sTNFR2 (Hedges’s g 0.265; 95% CI 0.041 to 0.489, p<0.05), monocyte chemoattractant protein-1 (MCP-1) (Hedges’s g 0.779; 95% CI 0.036 to 1.521, p<0.05), IL-6 (Hedges’s g 0.129; 95% CI 0.013 to 0.246, p<0.05) and decreased levels of IL-8 (Hedges’s g −1.293; 95% CI −2.390 to −0.196, p<0.05) in patients with MCI compared with the controls (figure 2, online supplementary material 4B). The MCI to control ratios for IL-6 (1.467, p<0.0001), sTNFR2 (1.074, p<0.001), MCP-1 (1.137, p<0.0001) and IL-8 (0.861, p=0.011) are presented in figure 3.
Comparisons between AD and MCI in peripheral marker levels
Elevated peripheral concentrations of sTNFR1 (Hedges’s g 0.582; 95% CI 0.108 to 1.055, p<0.05) and sTNFR2 (Hedges’s g 0.254; 95% CI 0.072 to 0.436, p<0.05) were detected in AD compared with MCI (figure 2, online supplementary material 4C). Figure 3 also illustrates the AD to MCI ratios for sTNFR1 (1.255, p=0.016) and sTNFR2 (1.122, p<0.001).
Comparisons between AD and control in CSF marker levels
Higher CSF levels of IL-10 (Hedges’s g 0.434; 95% CI 0.037 to 0.830, p<0.05), MCP-1 (Hedges’s g 0.798; 95% CI 0.293 to 1.304, p<0.005), transforming growth factor-beta 1 (TGF-β1) (Hedges’s g 1.009; 95% CI 0.287 to 1.730, p<0.05), soluble triggering receptor expressed on myeloid cells2 (sTREM2) (Hedges’s g 0.587; 95% CI 0.446 to 0.728, p<0.005), YKL-40 (Hedges’s g 0.849; 95% CI 0.616 to 1.081, p<0.005), α1-ACT (Hedges’s g 0.638; 95% CI 0.328 to 0.947, p<0.005), nerve growth factor (NGF) (Hedges’s g 5.475; 95% CI 2.040 to 8.909, p<0.005) and visinin-like protein-1 (VILIP-1) (Hedges’s g 0.677; 95% CI 0.326 to 1.027, p<0.005) were observed in subjects with AD compared with controls (figure 2, online supplementary material 4D). The AD to control ratios were calculated for NGF (3.980, p=0.122), TGF-β1 (3.263, p=0.145), IL-10 (1.489, p=0.043), α1-ACT (1.424, p=0.0001), MCP-1 (1.361, p<0.0001), VILIP-1 (1.383, p=0.002), YKL-40 (1.359, p<0.0001) and sTREM2 (1.332, p<0.0001) (figure 3).
Comparisons between MCI and control in CSF marker levels
Random-effects meta-analysis demonstrated only a trend of higher CSF levels of YKL-40 (Hedges’s g 0.373; 95% CI 0.050 to 0.697, p<0.05), VILIP-1 (Hedges’s g 0.534; 95% CI 0.216 to 0.852, p<0.005) and sTREM2 (Hedges’s g 0.695; 95% CI 0.114 to 1.276, p<0.05) in subjects with MCI compared with controls (figure 2, online supplementary material 4E). The CSF MCI to control ratios of YKL-40 (1.202, p<0.0001), VILIP-1 (1.307, p=0.006) and sTREM2 (1.497, p=0.007) were observed slightly above 1.0 (figure 3).
Comparisons between AD and MCI in CSF marker levels
Differences in CSF levels of inflammatory markers between subjects with AD and with MCI were also tested (online supplementary material 4F). As there were no surprising findings, we did not perform further analysis for comparison between these groups. Markers which did not show significant differences in the comparison could be looked up in online supplementary materials 4 and 7.
Investigation of heterogeneity
Strong evidence of heterogeneity was found in most comparisons (online supplementary material 4). Sensitivity analyses indicated that the results of most markers’ performance in peripheral blood and CSF were not unduly influenced by some specific studies (online supplementary material 7). No significant publication bias was detected in most of the studies, as demonstrated by the funnel plots and confirmed by the Egger’s tests (online supplementary materials 4 and 7). Potential publication bias was detected of vascular cell adhesion molecule-1 (VCAM-1) (Egger’s intercept −2.847, p=0.045) in the comparisons of AD with control (online supplementary material 4). For further verification, the classic fail-safe N was used to assess publication bias of VCAM-1, of which the results revealed that 0 missing study would be required to make p>0.05.
The results of subgroup analyses for most of the markers did not significantly differ from the overall results (online supplementary material 7). However, random-effects results showed that there are some differences in concentrations of TNF-α in serum (Hedges’s g 0.252; 95% CI 0.027 to 0.477, p<0.05) and IL-8 (Hedges’s g −0.967; 95% CI −1.905 to −0.029, p<0.05) in plasma between the AD group and the controls. Subject to the studies’ limited information, meta-regression analyses were mainly conducted for peripheral CRP, TNF-α, IL-6, IL-1β, IL-8, IL-10 and CSF IL-6 and YKL-40 (numbers of relevant studies no less than 10) (online supplementary material 7). A slight correlation of Mini-Mental State Exam (MMSE) score against Hedges’s g of peripheral IL-6 level (slope −0.069, p<0.001) was found in the comparison between the AD and control groups. Potential correlations of CSF YKL-40 with age (0.086, p<0.001) and MMSE score (−0.132, p<0.001) in the comparison of AD with MCI and with age (−0.084, p<0.001) in the comparison of MCI with control were also detected. Furthermore, there were no significant outcomes in the remaining analytes.
Systematic review
Of 170 eligible studies, numerous inflammatory markers were qualitatively analysed in the systematic review rather than included in the meta-analysis. The performances of these markers in the periphery or CSF are presented in figures 4 and 5 and online supplementary material 5, illustrating the comparison outcomes of each marker in one or two qualified studies.
Besides, some of the potential markers for AD were also involved in other neurological diseases, which could complicate the clinical scenario.19 To explore the specificity, performance of those markers in other neurological diseases are further listed in table 1 (online supplementary material 8).
Supplemental material
Performance of potential inflammatory biomarkers in peripheral blood and CSF of AD and other neurological diseases
Discussion
Inflammatory marker performance
This meta-analysis analysed and summarised the inconsistent data of previous studies investigating peripheral blood or CSF inflammatory markers in relation to AD and MCI. It demonstrated multiple significant variances of inflammatory marker levels in the comparisons between AD, MCI and control groups. Further rated by ratios of peripheral or CSF concentrations between groups, several markers differentiated disease status with good performance. These findings suggested noteworthy blood and CSF alterations of inflammatory markers in AD and MCI, implying a critical role of inflammation in the pathological process of disease.
Results suggested that publication bias was less likely to be the cause for most of the statistical heterogeneity, while studies that included VCAM-1 had publication bias to some extent. Subgroup analyses showed that sample sources (plasma or serum) and assay types could explain a fraction of the heterogeneity. Different commercial ELISA systems may also result in different concentrations of the inflammatory markers, due to the sensitivity and specificity of antibodies used. Peripheral IL-6 concentrations proved to be significantly increased in patients with AD compared with controls, and were slightly correlated with MMSE scores by meta-regression analysis. It showed similarly prominent ratio in the comparison between MCI and the control, but did not exhibit obvious associations with MMSE or age. These may indicate to some extent that inflammatory responses correlate with disease severity and that the underlying associations might not be apparent in the early stages of the disease.
In the current study, performance of specific inflammatory marker in the periphery was not strictly in conformity with that in CSF. For instance, there were apparent increases in peripheral IL-6 and IL-1β levels between patients with AD and normal controls, whereas these differences did not prove significant in CSF comparisons. This could be due to diverse methodologies and population heterogeneity among the included studies. Besides, concentrations of some markers remained undetectable in the CSF or blood, and lack of much effective laboratory data may partially account for the inconformity. Previously, Llano and his colleagues20 found that multiple inflammatory markers increased over time in CSF between the AD and the control groups, and such differences peaked at 24 hours after placement of the lumbar catheter. With no changes in plasma during this time, it is suggested that CSF inflammatory responses to lumbar catheter placement vary between the AD and the control groups.20 Analysing the correlation of these marker levels with the CSF to serum albumin ratio, which is regarded as an index assessing the blood–cerebrospinal fluid barrier (BCSFB) integrity, peripheral plus central inflammatory processes were supported to play a critical role in the early changes of BCSFB function.21 This indicated a disruption of the blood–brain barrier (BBB), resulting in alterations of its permeability and transport capacity.21 Based on these, it is reasoned to speculate that the variances of specific inflammatory marker levels in body fluid may be related to that shifting distribution between the periphery and CSF.
Pathophysiological and clinical implications
Emerging evidence suggests that an early and substantial impact of inflammatory markers is involved in the pathogenesis of AD.4 5 Research showed that peripheral and CSF inflammatory processes could mediate cognitive impairment in the early phase of neurodegeneration, the pathogenic processes which include inhibiting angiogenic, neurotrophic and neuroprotective mechanisms, inducing neuron loss and activating injury to myelin.21
This meta-analysis verified that expression of proinflammatory cytokines and chemokines, such as IL-1β, IL-6 and IL-8, significantly increased in patients with AD, which have been broadly documented to correlate with the presence and metabolism of amyloid-beta (Aβ) or tau proteins that subsequently lead to neurodegenerative cascades of AD.22 23 Following Aβ deposition, IL-1β has been reported to bring neuron dysfunction and progressive neurodegeneration in AD.7 22 In accord with previous meta-analyses,24 IL-6 was found to possess potential property that detects the severity of cognitive impairment in patients with AD. It is found that in the presence of Aβ deposition, microglia and astrocytes release IL-6, which could accelerate the pathological cascade of AD.4 23 Decreased levels of IL-8 in patients with AD were linked to descending reparative mechanism in the central nervous system (CNS).7 The proinflammatory cytokine TNF-α and its receptors sTNFR1 and sTNFR2, which regulate numerous physiological processes in CNS, have been detected to exacerbate the main pathological changes of AD (both Aβ and tau pathologies) in vivo.25 Our meta-analyses proved notable variances in the peripheral concentrations of sTNFR1 and sTNFR2 between group comparisons, implying that these markers may be useful in helping to monitor disease progression.
Interestingly, elevated MCP-1 levels were found in the peripheral blood of patients with MCI and in the CSF of patients with AD compared with controls. Accumulating evidence has revealed that inflammatory responses mediated by MCP-1 were linked to Aβ pathology and microglia accumulations,26 and that peripheral MCP-1 may attract the blood-derived monocytes migrating to CNS.27 Meta-analysed results also demonstrated remarkably increased α1-ACT levels in both the peripheral and CSF of AD compared with the control, which were both in tight associations with dementia progression.28 29 Upregulated in AD, α1-ACT could induce abnormal tau phosphorylation in neurons that leads to neurite loss and eventually apoptosis.29 These provided opportunities to explore the promising therapeutic value of these markers in AD.
Anti-inflammatory strategies are regarded to be beneficial for AD, while our results illustrated elevated CSF levels of anti-inflammatory marker IL-10 in patients with AD compared with controls. In a transgenic mouse model, researchers also observed unexpected negative effects of IL-10 on Aβ proteostasis, which induced growing plaque burden and consequently cognitive decline.30 Besides, in our results, peripheral sCD40L and CSF NGF concentrations were found to be remarkably elevated in patients with AD compared with controls. Released by activated platelets and T-lymphocytes, sCD40L could interact with CD40 from activated vascular cells and platelets, inducing prothrombotic and proinflammatory responses.31 This interaction produces angiogenesis-related factors such as the vascular endothelial growth factor, correlating with the BBB function which plays a critical role in Aβ homeostasis.31 32 Serving as a neurotrophic factor, NGF contributes to the neuronal survival, growth and function maintenance, and its deficiency leads to increasing production of Aβ aggregates and neuron death.33
Most of the studies have consistently demonstrated obviously increased CSF levels of YKL-40, VILIP-1 and sTREM2 both in patients with AD and MCI compared with normal controls, and revealed their associations with neurodegeneration biomarkers, such as total tau and phosphorylated tau.34–36 As a calcium-mediated neuronal injury protein, VILIP-1 showed higher levels in patients with AD and progressive MCI and was related to accelerating hippocampal atrophy and cognitive decline.36 sTREM2, the soluble form of innate immune receptor, could trigger microglial to express proinflammatory cytokines in the brain.37 It is reported that CSF YKL-40 level was already increased during the prodromal and preclinical phases of AD and could predict conversion from MCI to AD as measured by MMSE scores during the follow-up.38 Collectively, this evidence supported that these proteins could serve as a promising candidate marker providing fair discrimination in the progression of AD.35 39
Limitations and future directions
Noticeable heterogeneity exists in most of the analyses. Meta-regression analyses showed minor correlations of CSF YKL-40 alteration with age and cognition levels, yet these correlations were not found in the comparisons of AD with the controls. Some inflammatory markers, hsCRP, NGF and TGF-β1, showed differences in concentrations between the AD and the control groups, but failed to preferably discriminate by ratios. There are also some markers that appear to be positive in individual studies but negative in comprehensive analyses. The foremost reason is lack of quantity in the concerned study and deficiency in research objectives, perspectives and content. Limited by incomplete information of the included studies, it is underpowered to investigate the underlying mechanism of these inflammatory markers in AD and potential correlations with other clinical moderators (ie, education year, ethnicity, medication status, disease duration, APOE gene carriage and level of mental health). Thus, future and modern studies better cover these aspects. Identifying inflammatory biomarkers in AD and MCI holds the promise of removing roadblocks to the therapeutic discovery.40 Further studies are needed to investigate how these peripheral or CSF markers correlate with the established markers such as Aβ and tau. Also, more longitudinal research establishing multiperiod data of inflammatory markers along with the widely acknowledged neurodegeneration biomarkers are critical for insights into inflammation in the progression of AD.
Conclusion
Our meta-analysis demonstrated remarkable alterations in the peripheral levels of IL-1β, IL-6, sTNFR1, sTNFR2, α1-ACT, sCD40L, hsCRP, IL-8 and MCP-1, and CSF concentrations of MCP-1, sTREM2, YKL-40, α1-ACT, NGF, VILIP-1 and IL-10, in pairwise comparisons of AD, MCI and control groups. These findings strengthened the evidence that AD and MCI are accompanied by systemic and CNS-derived inflammatory processes. For subsequent detection and supervision of MCI stage and progression to AD, these findings need to be validated in larger, multicentred cohort studies.
Supplemental material
References
Footnotes
X-NS and L-DN contributed equally.
Contributors J-TY conceptualised and designed the study. X-NS and L-DN conducted the study. X-NS, L-DN and J-TY analysed and extracted the data. X-NS, L-DN and J-TY wrote the first draft of the manuscript. All authors reviewed the manuscript.
Funding This work was supported by grants from the National Key R&D Program of China (2018YFC1314700), the National Natural Science Foundation of China (81471309, 81571245, 81501103 and 81701253), Taishan Scholars Program of Shandong Province (ts201511109, tsqn20161078 and tsqn20161079), Qingdao Key Health Discipline Development Fund, and Shandong Provincial Collaborative Innovation Center for Neurodegenerative Disorders.
Competing interests None declared.
Patient consent Not required.
Provenance and peer review Not commissioned; externally peer reviewed.