Article Text

Abstract
Objective Cerebellar disease burden and cerebro-cerebellar connectivity alterations are poorly characterised in amyotrophic lateral sclerosis (ALS) despite the likely contribution of cerebellar pathology to the clinical heterogeneity of the condition.
Methods A prospective imaging study has been undertaken with 271 participants to systematically evaluate cerebellar grey and white matter alterations, cerebellar peduncle integrity and cerebro-cerebellar connectivity in ALS. Participants were stratified into four groups: (1) patients testing positive for GGGGCC repeat expansions in C9orf72, (2) patients carrying an intermediate-length repeat expansion in ATXN2, (3) patients without established ALS-associated mutations and (4) healthy controls. Additionally, the cerebellar profile of a single patient with ALS who had an ATXN2 allele length of 62 was evaluated. Cortical thickness, grey matter and white matter volumes were calculated in each cerebellar lobule complemented by morphometric analyses to characterise genotype-associated atrophy patterns. A Bayesian segmentation algorithm was used for superior cerebellar peduncle volumetry. White matter diffusivity parameters were appraised both within the cerebellum and in the cerebellar peduncles. Cerebro-cerebellar connectivity was assessed using deterministic tractography.
Results Cerebellar pathology was confined to lobules I–V of the anterior lobe in patients with sporadic ALS in contrast to the considerable posterior lobe and vermis disease burden identified in C9orf72 mutation carriers. Patients with intermediate ATXN2 expansions did not exhibit significant cerebellar pathology.
Conclusions Focal rather than global cerebellar degeneration characterises ALS. Pathognomonic ALS symptoms which are typically attributed to other anatomical regions, such as dysarthria, dysphagia, pseudobulbar affect, eye movement abnormalities and cognitive deficits, may be modulated, exacerbated or partially driven by cerebellar changes in ALS.
Data availability statement
Processed data may be available upon reasonable request from the corresponding author subject to institutional, funder and departmental approval.
This is an open access article distributed in accordance with the Creative Commons Attribution 4.0 Unported (CC BY 4.0) license, which permits others to copy, redistribute, remix, transform and build upon this work for any purpose, provided the original work is properly cited, a link to the licence is given, and indication of whether changes were made. See: https://creativecommons.org/licenses/by/4.0/.
Statistics from Altmetric.com
Introduction
While cerebellar involvement is a recognised feature of amyotrophic lateral sclerosis (ALS), anatomical patterns of cerebellar disease burden are poorly characterised in vivo, cerebro-cerebellar connectivity changes are mostly inferred from functional studies, and the cerebellar signatures of specific genotypes are not firmly established. The majority of imaging studies in ALS conjecture that the cerebellum assumes a compensatory role as progressive supratentorial degeneration ensues, yet postmortem studies have not confirmed such changes. Cognitive, behavioural and extrapyramidal manifestations are now all accepted facets of ALS and supported by compelling postmortem and radiological observations. While the link between frontotemporal dementia and ALS has been cemented, the notion of an ALS–ataxia continuum remains contentious despite the association of intermediate-length CAG repeat expansions in ATXN2 with ALS1 and shared clinical features with spinocerebellar ataxias. Even though cerebellar changes in ALS have been confirmed by seminal postmortem and TDP-43 studies,2–4 their clinical manifestations are less clear than those linked to frontotemporal pathology. Common clinical manifestations of ALS, such as pseudobulbar affect, dysarthria, dysphagia, eye movement abnormalities, behavioural dysfunction and deficits in social cognition, are often exclusively linked to corticobulbar tract degeneration, brainstem and cranial nerve pathology, orbitofrontal atrophy, etc, which overlooks the likely contribution of cerebellar pathology to these symptoms.5–7 The pitfalls of linking imaging findings directly to clinical observations are well recognised,8 but the real value of computational imaging in ALS lies in its ability to characterise disease burden patterns in vivo in an impartial, descriptive, observer-independent fashion. Varying patterns of cerebellar changes have been noted on whole-brain analyses,9 but relatively few dedicated cerebellar studies have been undertaken.10 11 Cerebellar imaging studies in ALS have led to strikingly inconsistent findings,9 which may stem from methodological differences, sample size limitations, differences in inclusion criteria and divergent patient stratification strategies. Few imaging studies reported focal changes in specific lobules,12 implemented longitudinal designs across multiple timepoints,13 evaluated the integrity of cerebellar peduncles,14 investigated cerebellar nuclei15 or commented on presymptomatic changes.16 Popular MRI analysis pipelines are often confined to the evaluation of supratentorial changes, and electroencephalography (EEG) and magnetoencephalography (MEG) studies do not typically acquire cerebellar data at all.17 Positron emission tomography (PET) studies often detect hypermetabolism in various cerebellar regions,18 including the vermis and lobules IV and V, but propose strikingly different biological explanations, such as microglial activation, loss of inhibition or compensatory process. Reports of cerebellar degeneration in C9orf72-positive ALS are also inconsistent; while postmortem studies consistently confirmed C9orf72-associated cerebellar changes,4 19 some imaging studies did not detect cerebellar atrophy in vivo.20 ATXN2-associated cerebellar changes in ALS have not been systematically evaluated to date.
Based on these considerations, our main objective is the comprehensive and multiparametric evaluation of both intracerebellar pathology and cerebro-cerebellar connectivity in a genetically stratified cohort of patients with ALS. We are not seeking to explore direct clinical correlates,8 but endeavour to characterise anatomical patterns of cerebellar disease burden distribution. Our main hypothesis is that focal cerebellar pathology may be detected instead of global cerebellar degeneration with the selective vulnerability of specific cerebellar lobules. We hypothesise that cerebellar changes may also be readily detected in patients who test negative for established ALS-associated genetic variants. Additionally, we hypothesise that intracerebellar pathology is accompanied by cerebro-cerebellar disconnection.
Methods
Participants
A total of 271 participants, 161 patients with ALS and 110 healthy controls (HC), were included in a prospective, single-centre imaging study of cerebellar degeneration in ALS. All participants provided informed consent in accordance with the medical ethics approval of the research project (Beaumont Hospital, Dublin, Ireland). Exclusion criteria included prior traumatic brain injury, cerebrovascular events, and comorbid neoplastic, paraneoplastic or neuroinflammatory diagnoses. Participating patients with ‘probable’ or ‘definite’ ALS according to the revised El Escorial research criteria were drawn from a larger cohort (n=808) genotyped for repeat expansions in C9orf72 and ATXN2 and were stratified into three groups: (1) those testing positive for GGGGCC repeat expansions in C9orf72 (‘ALS-C9’, n=22), (2) those carrying an intermediate repeat expansion in ATXN2 with a max allele length of 27–33 (‘ALS-ATXi’, n=5) and (3) patients who tested negative for both ATXN2 and C9orf72 (‘ALS-NEG’, n=133). Additionally the cerebellar profile of a single patient with ALS was evaluated who had a max ATXN2 allele length of 62 ('ALS-SCA'). One hundred and twenty-five patients with ALS had a cerebellar assessment at the time of their scan. This included screening for dysdiadochokinesis, dysmetria and rebound, assessing rapid alternating movements, finger-to-nose/heel-to-shin coordination and gait where disability from upper motor neuron/lower motor neuron degeneration permitted.
Magnetic resonance imaging
A uniform imaging protocol was implemented on a 3 Tesla Philips Achieva magnetic resonance platform. T1-weighted (T1w) images were acquired with a three-dimensional inversion recovery prepared spoiled gradient recalled echo sequence with the following parameters: field of view (FOV) of 256×256×160 mm, flip angle=8°, spatial resolution=1 mm3, sensitivity encoding (SENSE) factor=1.5, repetition time/echo time (TR/TE)=8.5/3.9 ms and inversion time (TI)=1060 ms. Diffusion tensor images (DTI) were acquired with a spin-echo echo planar imaging pulse sequence using a 32-direction Stejskal-Tanner diffusion encoding scheme, FOV of 245×245×150 mm, 60 slices with no interslice gap, spatial resolution of 2.5 mm3, TR/TE of 7639/59 ms, SENSE factor of 2.5, b-value of 0, 1100 s/mm2, dynamic stabilisation and spectral presaturation with inversion recovery fat suppression. To assess for comorbid vascular and inflammatory pathologies, fluid-attenuated inversion recovery (FLAIR) images were also acquired from each participant. Axial orientation was used for FLAIR imaging with an inversion recovery turbo spin echo sequence: FOV=230×183×150 mm, spatial resolution=0.65×0.87×4 mm, 30 slices with 1 mm gap, TR/TE=11 000/125 ms, TI=2800 ms, 120° refocusing pulse, with flow compensation and motion smoothing and a saturation slab covering the neck region.
Cortical thickness and volume analyses
To evaluate cerebellar cortical thickness and lobular volume alterations, the cerebellum was parcellated using a validated segmentation algorithm.21 Preprocessing included the ‘denoising’ of raw structural data in native space, inhomogeneity corrections, affine registration to the Montreal Neurological Institute (MNI) space, inhomogeneity corrections in the MNI space, cerebellar cropping, low dimensional non-linear registration estimation and intensity normalisation. A patch-based segmentation algorithm was subsequently applied to generate cerebellar volume metrics for each lobule,22 separately for the right and left cerebellar hemispheres. The accuracy of anatomical segmentation and tissue-type parcellation was individually verified for each subject. White matter volumes in each lobule were calculated by subtracting grey matter volume values from total lobule volume estimates. The following anatomical labels were considered to retrieve regional cortical thickness and volume values: lobules I–II, III, IV, V, VI, VIIB, VIIIA, VIIIB, IX, X, crus I and crus II. The outputs considered for statistical interpretation included cortical thickness, grey matter volumes and white matter volumes in each lobule and crus.
Morphometry
First, total intracranial volume (TIV) was estimated for each subject to be used as a covariate in subsequent region of interest (ROI) morphometric analyses. TIV was estimated by linearly aligning each participant’s brain image to the MNI152 standard, and the inverse of the determinant of the affine registration matrix was calculated and multiplied by the size of the template. FMRIB’s FSL-FLIRT was used for spatial registration and FSL-FAST for tissue-type segmentation. Resulting partial grey matter, white matter and cerebrospinal fluid (CSF) volumes were added for TIV estimation. Cerebellar grey matter pathology was appraised by ROI morphometry using FMRIB’s FSL suite. Preprocessing included skull removal, motion corrections and tissue-type segmentation, followed by the individual visual inspection of the outputs for quality control. Affine registration was then used to align individual grey matter partial volume images to the MNI152 standard space. A study-specific grey matter template was generated representing each study group to which the grey matter images of each participant were then non-linearly co-registered. For the voxelwise analyses, permutation-based non-parametric inference was used to contrast the three patient groups to HC implementing the threshold-free cluster enhancement (TFCE) method. Design matrices included group membership, age, sex and TIV. Voxelwise statistics were constrained to a cerebellar ROI mask defined by ‘label 1’ of the MNI structural atlas. Resulting statistical maps were thresholded at p<0.05 family-wise error (FWE) TFCE and visualised in FSLeyes. The labels of the Diedrichsen probabilistic atlas were used as underlay to aid the localisation of statistically significant clusters.
White matter analyses
Raw DTI data first underwent eddy current corrections and skull removal; a tensor model was then fitted to generate maps of fractional anisotropy (FA), axial diffusivity (AD) and radial diffusivity (RD). FMRIB’s software library’s tract-based statistics (TBSS) module was used for non-linear registration and skeletonisation of individual DTI images. A mean FA mask was created and each subject’s individual FA, AD and RD images were merged into four-dimensional AD, FA and RD image files. The study-specific white matter skeleton was masked by atlas-defined labels for the entire cerebellum to restrict analyses to the cerebellum. Permutation-based non-parametric inference was used for the two-way, voxelwise comparison of diffusivity parameters between each patient group and controls using design matrix-defined contrasts which included age and sex as covariates. The TFCE method was applied and the results considered significant at p<0.01 TFCE FWE.
Segmentation for superior cerebellar peduncle volumetry
A Bayesian segmentation pipeline was implemented for the parcellation of the superior cerebellar peduncle (SCP) which is based on a probabilistic atlas generated based on 49 scans.23 The FreeSurfer image analysis suite was used for preprocessing: removal of non-brain tissue, segmentation of the subcortical white matter and deep grey matter structures, intensity normalisation, tessellation of the grey matter–white matter boundary and automated topology correction. Following preprocessing, segmentation and quality checks, raw superior cerebellar peduncle volume values were retrieved for each study participant for subsequent statistical interpretation with the appropriate covariates.
Cerebro-cerebellar connectivity
Cerebro-cerebellar connectivity was evaluated with deterministic tractography, and in a supplementary analysis diffusivity metrics in the cerebellar peduncles were evaluated separately. Tractography was performed using BrainanceMD (Advantis Medical Imaging, Eindhoven, The Netherlands). Before formal analyses, all DTI data sets were first corrected for motion and eddy currents using a scanner registration tool and a co-registration protocol. ROI fibre tractography (thresholds: FA=0.15, angle=70°, step size=1) was implemented for the main cortico-ponto-cerebellar tracts: (1) fronto-ponto-cerebellar (FPC), (2) parieto-ponto-cerebellar (PPC), (3) occipito-ponto-cerebellar (OPC), (4) temporo-ponto-cerebellar (TPC) and (5) dentate-rubro-thalamo-cortical (DRTC). ROI definitions and gating have been presented previously24 and are illustrated in figure 1. The following indices were extracted from each tract: FA, AD and RD. All DTI data sets were analysed twice by a single experienced rater (FC) within an interval of 3 weeks to verify intraobserver consistency. To evaluate interobserver consistency, the same data set was also analysed by a second experienced rater (EK), who was blinded to the results of the first rater. Intrarater and inter-rater consistencies were verified with intraclass correlation coefficient (ICC), and ICC values greater than 0.80 were found in all cases (ICC >0.8).

Tractography methods and anatomical targets for the fronto-ponto-cerebellar (FPC), parieto-ponto-cerebellar (PPC), occipito-ponto-cerebellar (OPC), temporo-ponto-cerebellar (TPC) and dentate-rubro-thalamo-cortical (DRTC) tracts.
In a supplementary analysis, the integrity of the cerebellar peduncles was also specifically evaluated. Labels 1, 11, 12, 13 and 14 of the 1 mm JHU-ICBM atlas were used to generate masks for the left and right inferior, the middle, and the left and right superior cerebellar peduncles. Average FA, AD and RD values were retrieved from the merged skeletonised diffusion data using these masks from each subject for statistical analysis.
Statistical analyses
Voxelwise statistics, covariate selection and design matrices are described above for morphometric and tract-based statistics. Multivariate analyses of covariance (MANCOVAs) were used to evaluate the effect of group membership on lobular cortical thickness, designating lobular cortical thickness values as dependent variables, the grouping variable as an independent factor, and age and sex as covariates. To test the effect of group membership on cerebellar grey matter volumes, MANCOVA was also conducted, including lobular grey matter volumes as dependent variables, the grouping variable as an independent factor, and age, sex and TIV as covariates. To test the effect of group membership on diffusivity metrics (FA, AD, RD), diffusivity values were included as dependent variables, the grouping variable as an independent factor, and age and gender as covariates. To test the effect of group membership on SCP volume, an analysis of covariance was conducted using SCP volume as dependent variable, the grouping variable as an independent factor, and age, sex and TIV as covariates. Due to cohort size considerations, only the imaging profile of the HC, ALS-NEG and ALS-C9 groups are presented in the main manuscript. Differences between HC and ALS-ATXi patients are reported in the online supplemental material. In case of a significant multivariate omnibus test (or univariate for the SCP volume), post-hoc comparisons were considered significant at p<0.05 following Bonferroni corrections for multiple comparisons to reduce type I error. For the interpretation of the imaging metrics of the single patient with ALS-SCA, an age-matched and sex-matched subgroup of 55 controls were used, implementing supplementary Bayesian statistics and using the SINGLEBAYES pipeline.25 The lobular cortical thickness, grey matter, white matter and peduncular diffusivity values of the patient with ALS-SCA were compared with the age-matched HC values at p<0.05 using Bonferroni correction for multiple comparisons.
Supplemental material
Genotyping
Nine hundred and seventy-seven patients with ALS from the Irish ALS DNA bank were included in genotyping analyses. DNA was extracted commercially from whole blood drawn from patients with ALS along with 562 age-matched and population-matched HC subjects. All patients provided written informed consent. The ATXN2 (CAG)n repeat locus was amplified by PCR using primers (5′−3′) ATXN2-F 6-FAM-CCCCGCCCGGCGTGCGAGCCGGTGTATG and ATXN2-R CGGGCTTGCGGACATTGG.26 Between 40 ng and 70 ng of genomic DNA was amplified using Q5 Hot Start High-Fidelity Polymerase (New England BioLabs) along with the provided high-GC enhancer. Resulting PCR products were purified using Agencourt Ampure XP beads (Beckman Coulter) and analysed for amplified fragment length polymorphism commercially by Eurofins Medigenomix on an Applied Biosystems 3730xl capillary electrophoresis instrument. All patients were also genotyped for the intronic GGGGCC repeat expansion in C9orf72 by repeat-primed PCR. Resulting capillary electrophoresis traces were visualised using GeneMapper V.4.0; patients unambiguously exhibiting 30 or more repeats were labelled C9orf72-positive. Additionally, all participating patients were screened for a panel of protein-altering, exonic or splice-site variants present in 32 genes linked to ALS in the ALS online database (ALSod) (online supplemental material).27
Results
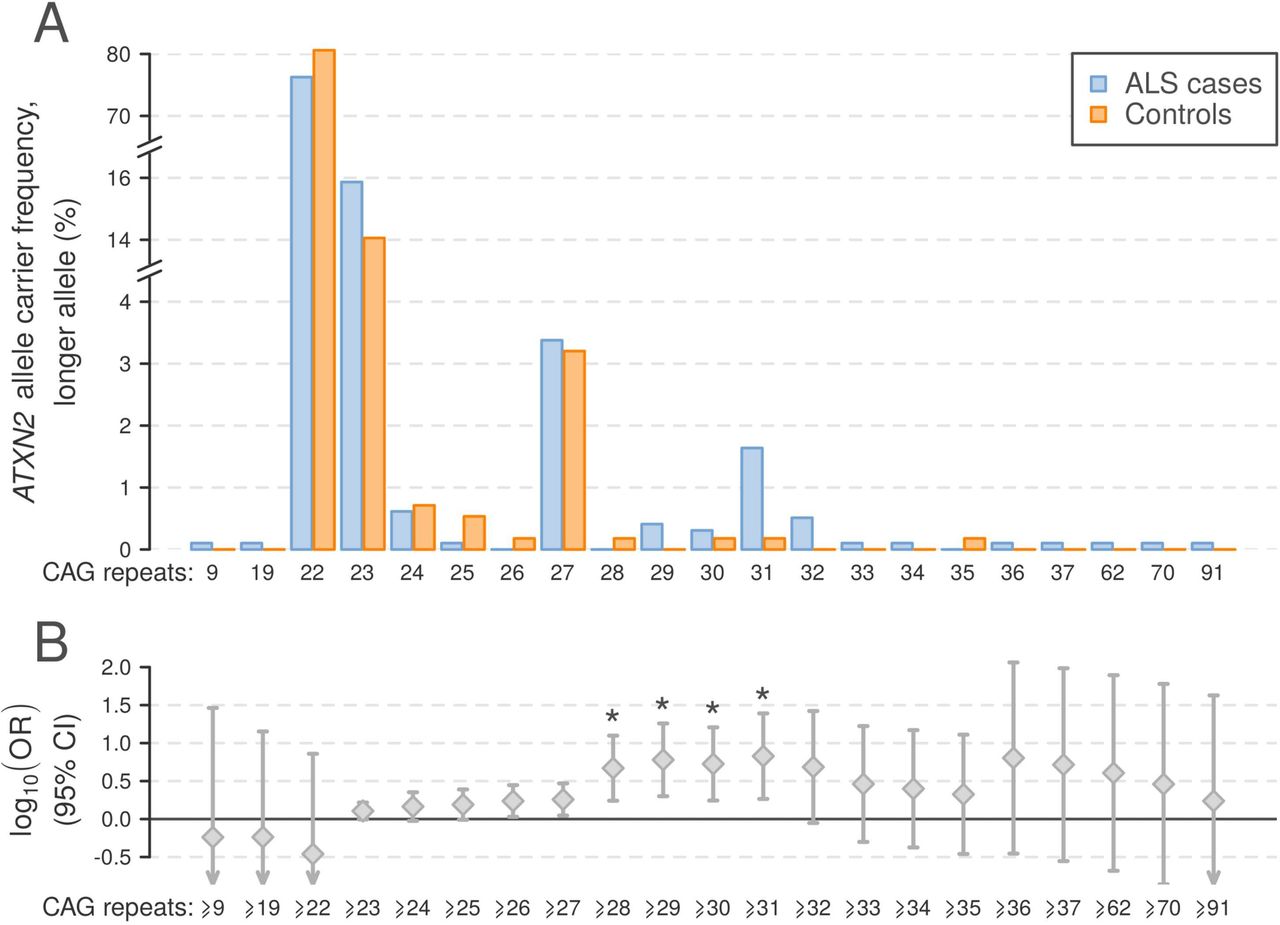
The frequency of pathogenic C9orf72 repeat expansions across the genotyped cohort was 7.6%. ATXN2 alleles contained between 8 and 91 trinucleotide repeats, with the most common alleles containing 22, 23 and 27 repeats at frequencies (cases and controls combined) of 87.4%, 8.2% and 1.7%, respectively. Consistent with previous reports, we observed an excess of ALS cases in which the larger ATXN2 allele was in the intermediate range of 27–33 repeats, as well as six patients with ALS and one HC with >33 repeats (figure 2A). Trinucleotide repeat counts ≥28, ≥29, ≥30 and ≥31 for the larger allele were significantly associated with ALS (Fisher’s exact test, p<2.4×10⁻³, corresponding to α=0.05 corrected for 21 tests; figure 2B), and the OR for ALS in the established ALS risk range (27–33 repeats)1 was 1.72 (95% CI 1.04 to 2.84).

Profile of ATXN2 repeat expansions in 977 Irish patients with ALS and 562 population-matched healthy controls. (A) Allele frequencies for ALS cases and controls for the larger ATXN2 allele observed per individual. (B) OR ±95% CI for ATXN2 repeat expansions in ALS, thresholded by each observed allele as a lower limit. Asterisks indicate repeat expansion size categories significantly associated with ALS (Fisher’s exact test p<2.4×10⁻³). ALS, amyotrophic lateral sclerosis.
MRI data from a total of 161 patients with ALS and 110 healthy controls (‘HC’, mean age: 59.2±10.5) were available for analyses. Patients with ALS were categorised into three groups: (1) patients with sporadic disease testing negative for established mutations (‘ALS-NEG’, n=133, mean age: 61.6±10.2, mean Revised Amyotrophic Lateral Sclerosis Functional Rating Scale (ALSFRS-r) score: 36.8±6.6, mean symptom duration: 19.6±9.2), (2) patients carrying the GGGGCC repeat expansion in C9orf72 (‘ALS-C9’, n=22, mean age: 56.4±8.9, mean ALSFRS-r score: 37.9±6.8, mean symptom duration: 20.8±6.2), and (3) patients with intermediate ATXN2 repeat expansions (‘ALS-ATXi’, n=5, mean age: 59.6±15.1, mean ALSFRS-r score: 35.8±3.7, mean symptom duration: 18.8±5.9). The groups were matched for age, sex, handedness, symptom duration and ALSFRS-r score. The comparative demographic and clinical profile of the patients groups are presented in online supplemental table 1. All patients tested negative for a panel of protein-altering, exonic or splice-site variants in 32 genes linked to ALS (online supplemental material).
Patients carrying hexanucleotide repeat expansion in C9orf72 exhibited cortical thickness reductions in lobules IV, V, VI and crura I and II in the left cerebellar hemisphere, and lobules V, VI, VIIB and crura I and II in the right cerebellar hemisphere (table 1.) This cohort also demonstrated volume reductions in the left lobule IV (table 2). ALS-NEG patients showed cortical thinning in crus I in the left (table 1) and volume reduction in the right and left lobule IV (table 2). ALS-ATXi patients exhibited no cerebellar cortical thinning or volume loss (online supplemental tables 2 and 3). No cerebellar white matter volume reductions were observed in any of the patient groups (online supplemental tables 4 and 5).
Cerebellar cortical thickness in HC and ALS-NEG and ALS-C9
Cerebellar grey matter volumes in HC and ALS-NEG and ALS-C9
Morphometric analyses captured predominantly symmetrical patterns of cerebellar atrophy in hexanucleotide repeat expansion carriers selectively affecting lobules I–IV, V, VIIIA/B, IX and the vermis (figure 3). ALS-NEG patients showed more focal and less widespread changes in lobules I–IV and V. No voxelwise partial volume reductions were captured in the ALS-ATXi cohort.

Cerebellar grey matter alterations as indicated by focal partial volume reductions at p<0.05 FWE TFCE corrected for age, gender and total intracranial volumes. (A) Focal changes in ALS-C9 are indicated in blue and (B) changes in ALS-NEG patients in red-yellow. The Diedrichsen probabilistic cerebellar atlas is presented as underlay to aid localisation. MNI coordinates are provided on the right side of the figure for sagittal (x), coronal (y) and axial (z) views. ALS, amyotrophic lateral sclerosis; ALS-C9, patients who tested positive for GGGGCC repeat expansions in C9orf72; ALS-NEG, patients who tested negative for both ATXN2 and C9orf72; FWE, family-wise error; MNI, Montreal Neurological Institute; TFCE, threshold-free cluster enhancement.
Tract-based spatial statistics detected decreased FA and increased AD and RD in lobules I–IV and V in GGGGCC repeat carriers. Additionally, decreased FA was also detected in crura I and II in ALS-C9 (figure 4). Symmetric patterns of FA reductions were also readily detected in the ALS-NEG group, which involved lobule IX in both hemispheres, in addition to lobules I–IV, V and crura I and II. Increased RD in ALS-NEG was less widespread, predominantly involving lobules I–IV, V and VI. Changes in AD did not reach significance in the ALS-NEG group. The ALS-ATXi cohort did not exhibit voxelwise diffusivity alterations.

Tract-based white matter changes in ALS as identified by FA, AD and RD alterations at p<0.01 TFCE adjusted for age and gender. Changes in ALS-C9 are indicated in blue (top), and changes in ALS-NEG are shown in red-yellow (bottom). The Diedrichsen probabilistic cerebellar atlas is presented as underlay to aid localisation. MNI coordinates are provided on the right side of the figure for sagittal (x), coronal (y) and axial (z) views. AD, axial diffusivity; ALS, amyotrophic lateral sclerosis; ALS-C9, patients who tested positive for GGGGCC repeat expansions in C9orf72; ALS-NEG, patients who tested negative for both ATXN2 and C9orf72; FA, fractional anisotropy; MNI, Montreal Neurological Institute; RD, radial diffusivity; TFCE, threshold-free cluster enhancement.
The comparison of superior peduncle volumes between the study groups did not reach significance after corrections for age, gender and TIV (online supplemental tables 6 and 7).
Cerebro-cerebellar tractography in ALS-NEG identified FA reductions in the FPC (left cerebellar hemisphere to contralateral cerebrum) and in the DRTC (left cerebellar hemisphere to contralateral cerebrum) (table 3), as well as increased RD in the left to contralateral FPC and in the left to contralateral DRTC (online supplemental table 8). ALS-C9 patients exhibited FA reductions in the left to contralateral FPC and in the left to contralateral PPC (table 3), as well as increased RD in the left to contralateral FPC and in the left to contralateral PPC (online supplemental table 8). No cerebro-cerebellar AD changes have been detected in the ALS-NEG or ALS-C9 group (online supplemental table 9). Cerebro-cerebellar tractography did not capture FA, RD or AD alterations in the ALS-ATXi group (online supplemental tables 10-12). The diffusivity profiles of the cerebellar peduncles were evaluated in dedicated ROI analyses. Both ALS-NEG and ALS-C9 patients exhibited FA reductions in the left and right inferior peduncles, whereas ALS-NEG showed additional FA reductions in the right superior and middle cerebellar peduncles. ALS-NEG and ALS-C9 also showed increased RD in the right superior and in the left and right inferior cerebellar peduncles. Furthermore, ALS-C9 exhibited increased AD in the right superior cerebellar peduncle (table 4). No FA, AD or RD changes were detected in the ALS-ATXi group (online supplemental table 13). No significant cortical thickness, grey matter or white matter volume reductions and peduncular diffusivity alterations were identified in the single patient with ALS-ATX with respect to matched controls.
Fractional anisotropy values for the cerebro-cerebellar tracts in HC and ALS-NEG and ALS-C9
Cerebellar peduncle profiles in HC and ALS
Discussion
In this study, we have identified relatively symmetric and focal cerebellar degeneration in ALS. These observations are not driven by intermediate-length alleles of ATXN2, indicating that cerebellar pathology is a broader feature of ALS than a simple overlap of clinical features with spinocerebellar ataxia type 2 due to pleiotropy of ATXN2 repeat expansions. The genetic causes of ALS in the ALS-NEG cohort remain undiscovered, but recent observations of intermediate-length ATXN1 risk alleles in ALS,28 coupled with polygenic enrichment in cerebellar genes,29 indicate that the aetiological agents underlying ALS have functional roles in the biology of the cerebellum, potentially explaining the structural changes that we have observed.
While ALS-NEG patients displayed predominantly anterior lobe pathology, patients carrying the pathogenic hexanucleotide repeat expansion in C9orf72 exhibited more widespread cerebellar atrophy involving the posterior lobe and the vermis. The posterior lobe of the cerebellum or ‘neocerebellum’ is regarded the newest part of the cerebellum phylogenetically and is associated with a variety of cognitive functions.30 31 The role of posterior lobe lobules in mediating cognitive processes has been consistently demonstrated by activation and lesion studies.32 33 While clinically the C9orf72 genotype in ALS is widely associated with cognitive and behavioural deficits, these symptoms are typically solely linked to frontotemporal degeneration.34 Cortical thickness analyses in ALC-C9 captured the involvement of lobules VI, VIIB and crura I and II, while morphometric analyses confirmed considerable posterior lobe pathology showcasing extensive lobule VIIIA, VIIIB and IX and posterior-inferior vermis involvement. The lobular distribution of diffusivity alterations mirrored the patterns of grey matter degeneration. Cerebro-cerebellar tractography highlighted the pathology of FPC and PPC projections.
The intracerebellar patterns identified by the various imaging methods are largely concordant; segmentation-based volumetric analyses mirror the most vulnerable regions identified by morphometry. The most significant white matter alterations were detected subjacent to grey matter regions affected by cortical thickness and partial volume reductions. The relative concordance between the various imaging streams suggests that voxelwise analysis pipelines such as TBSS and morphometry may readily detect focal cerebellar changes, potentially obviating the need for computationally demanding segmentation approaches and post-hoc statistics in future studies. Both cerebro-cerebellar tractography and intracerebellar tract-based analyses identified widespread FA reductions and increased RD, with relatively limited AD alterations. In contrast to the considerable diffusivity alterations, no white matter volume reductions were detected, which highlights the limitations of T1w data in detecting white matter degeneration.
In the existing literature, increased cerebellar activation during motor task, increased PET signal and increased functional cerebro-cerebellar connectivity are often interpreted as compensatory35–37 change in response to supratentorial degeneration, despite the fact that very few structural studies37 and no postmortem studies have actually demonstrated adaptive cerebellar hypertrophy. In this study, we have not identified increased cerebellar integrity metrics or increased cerebro-cerebellar connectivity indices. The apparent disparity between high-resolution structural findings and insights inferred from functional studies highlights the risks of interpreting functional observations in isolation without the interrogation of accompanying structural or postmortem data. The evaluation of putative compensatory processes would require dedicated multiparametric studies combining functional, metabolic and structural protocols.
This study is not without limitations; only a single patient with ALS-SCA was included, a small ALS-ATXi sample was evaluated and a cross-sectional study design was implemented. The interrogation of longitudinal cerebellar data, with the inclusion of presymptomatic mutation carriers, is likely to offer important additional insights regarding the chronology of supratentorial and infratentorial changes. Broader genotyping of SCA-associated genes (eg, ATXN1) and other repeat expansions known to contribute to neurodegeneration38 may provide a more comprehensive and better-powered categorisation strategy for understanding the pleiotropic expression of this type of genetic variant. Our tractography protocol did not evaluate the segmental profile of cerebro-cerebellar projections and the corticospinal tract, FPC, PPC and DRTC may overlap in certain voxels along their course. High angular resolution protocols, constrained spherical deconvolution and non-Gaussian diffusion models, such as neurite orientation dispersion and density imaging or diffusion kurtosis imaging, may be better suited for the nuanced characterisation of these tracts especially with regard to crossing fibres.
Notwithstanding these limitations, we have demonstrated focal anterior lobe degeneration in a large cohort of patients with ALS testing negative for ATX2 and C9orf72 and have shown posterior dominant and vermis atrophy in C9orf72 mutation carriers. From a clinical perspective our findings highlight the pitfalls of attributing specific clinical symptoms to single anatomical foci, as cerebellar pathology is likely to modulate a number of cardinal symptoms in ALS, such as dysphagia, dysarthria, pseudobulbar affect and respiratory rhythmicity.5 6 39 40 With our descriptive analyses we sought to add the cerebellum to the list of vulnerable anatomical regions preferentially affected in ALS and showcase the presence of considerable infratentorial disease burden.
Conclusions
Patients with ALS exhibit focal cerebellar degeneration and cerebro-cerebellar connectivity alterations which can be readily detected in vivo. The contribution of cerebellar pathology to the clinical heterogeneity of ALS, including cognitive, behavioural, pseudobulbar, bulbar, eye movement and gait manifestations, needs to be carefully considered instead of solely attributing these symptoms to supratentorial and brainstem pathology.
Data availability statement
Processed data may be available upon reasonable request from the corresponding author subject to institutional, funder and departmental approval.
Ethics statements
Patient consent for publication
Ethics approval
This study was approved by the Ethics (Medical Research) Committee, Beaumont Hospital, Dublin, Ireland (REC08/09). Genotyping was approved by the Beaumont Hospital Research Ethics Committee.
Acknowledgments
We are most thankful for the participation of each patient and healthy control, and we also thank all the patients who expressed interest in this research study but were unable to participate for medical or logistical reasons. We also express our gratitude to the caregivers of MND patients for facilitating attendance at our neuroimaging centre. Without their generosity this study would have not been possible.
References
Supplementary materials
Supplementary Data
This web only file has been produced by the BMJ Publishing Group from an electronic file supplied by the author(s) and has not been edited for content.
Supplementary Data
This web only file has been produced by the BMJ Publishing Group from an electronic file supplied by the author(s) and has not been edited for content.
Footnotes
PB, RHC and FC are joint first authors.
RLM and OH are joint senior authors.
Contributors Drafting the manuscript: PB, FC, RLM. Clinical assessments: PB, RHC, SLHS, OH. Neuroimaging analyses: PB, RHC, FC, EK, GA, JL, SLHS, GV. Genetic analyses: JCH, LD, MAD, AV, RLM. Conceptualisation of the study: PB, FC, RLM. Revision of the manuscript for intellectual content: PB, RHC, FC, JCH, EK, GA, JL, SLHS, GV, LD, MAD, AV, RLM, OH.
Funding PB and the Computational Neuroimaging Group are supported by the Health Research Board (HRB EIA-2017-019), the Irish Institute of Clinical Neuroscience (IICN), the Spastic Paraplegia Foundation (SPF), the EU Joint Programme - Neurodegenerative Disease Research (JPND), the Andrew Lydon Scholarship, the Research Motor Neurone Foundation (RMN) and the Iris O'Brien Foundation. RLM is supported by Science Foundation Ireland (17/CDA/4737). MAD is supported by Science Foundation Ireland (15/SPP/3244).
Competing interests None declared.
Provenance and peer review Not commissioned; externally peer reviewed.
Supplemental material This content has been supplied by the author(s). It has not been vetted by BMJ Publishing Group Limited (BMJ) and may not have been peer-reviewed. Any opinions or recommendations discussed are solely those of the author(s) and are not endorsed by BMJ. BMJ disclaims all liability and responsibility arising from any reliance placed on the content. Where the content includes any translated material, BMJ does not warrant the accuracy and reliability of the translations (including but not limited to local regulations, clinical guidelines, terminology, drug names and drug dosages), and is not responsible for any error and/or omissions arising from translation and adaptation or otherwise.
Linked Articles
- Editorial commentary