Article Text

Abstract
Objective To identify potential biomarkers of preclinical and clinical progression in chromosome 9 open reading frame 72 gene (C9orf72)-associated disease by assessing the expression levels of plasma microRNAs (miRNAs) in C9orf72 patients and presymptomatic carriers.
Methods The PREV-DEMALS study is a prospective study including 22 C9orf72 patients, 45 presymptomatic C9orf72 mutation carriers and 43 controls. We assessed the expression levels of 2576 miRNAs, among which 589 were above noise level, in plasma samples of all participants using RNA sequencing. The expression levels of the differentially expressed miRNAs between patients, presymptomatic carriers and controls were further used to build logistic regression classifiers.
Results Four miRNAs were differentially expressed between patients and controls: miR-34a-5p and miR-345-5p were overexpressed, while miR-200c-3p and miR-10a-3p were underexpressed in patients. MiR-34a-5p was also overexpressed in presymptomatic carriers compared with healthy controls, suggesting that miR-34a-5p expression is deregulated in cases with C9orf72 mutation. Moreover, miR-345-5p was also overexpressed in patients compared with presymptomatic carriers, which supports the correlation of miR-345-5p expression with the progression of C9orf72-associated disease. Together, miR-200c-3p and miR-10a-3p underexpression might be associated with full-blown disease. Four presymptomatic subjects in transitional/prodromal stage, close to the disease conversion, exhibited a stronger similarity with the expression levels of patients.
Conclusions We identified a signature of four miRNAs differentially expressed in plasma between clinical conditions that have potential to represent progression biomarkers for C9orf72-associated frontotemporal dementia and amyotrophic lateral sclerosis. This study suggests that dysregulation of miRNAs is dynamically altered throughout neurodegenerative diseases progression, and can be detectable even long before clinical onset.
Trial registration number NCT02590276.
Data availability statement
Data are available upon reasonable request (isabelle.leber@upmc.fr).
This is an open access article distributed in accordance with the Creative Commons Attribution Non Commercial (CC BY-NC 4.0) license, which permits others to distribute, remix, adapt, build upon this work non-commercially, and license their derivative works on different terms, provided the original work is properly cited, appropriate credit is given, any changes made indicated, and the use is non-commercial. See: http://creativecommons.org/licenses/by-nc/4.0/.
Statistics from Altmetric.com
Introduction
Frontotemporal dementia (FTD) designates neurodegenerative dementias characterised by progressive behavioural, executive and language impairments.1 Amyotrophic lateral sclerosis (ALS) is a degenerative disease of motor neurons that leads to progressive muscle atrophy and motor deficit. FTD and ALS form a clinical continuum, as these two diseases may be associated in the same patients (FTD-ALS) or within families. They also share common pathophysiological mechanisms and genetic causes.2 The most frequent genetic cause of familial FTD and ALS is a hexanucleotide (GGGGCC) repeat expansion in the chromosome 9 open reading frame 72 (C9orf72) gene.3 4 This autosomal dominant mutation may cause neurodegeneration through C9orf72 loss of function, aggregation of mutant RNA in nuclear foci and of dipeptide repeats generated by repeat-associated non-AUG translation, ultimately leading to pathological inclusions of TAR-DNA binding protein 43 (TDP-43).5
There are no effective treatments available in C9orf72 disease to date, but several promising trials including antisense therapies are being developed. Presymptomatic C9orf72 carriers represent an optimal target population for the development of new therapeutic interventions for FTD and ALS.6 7 Therefore, it is of paramount importance to identify biomarkers of preclinical progression for FTD and ALS, which could be used to initiate and monitor potential disease-modifying treatments before any irreversible brain damage has occurred.
There is increasing evidence that microRNA (miRNA) expression in body fluids, such as plasma/serum8 or cerebrospinal fluid (CSF),9 correlates with the diagnosis and progression of many neurodegenerative diseases, including FTD10 and ALS.11 MicroRNAs are a class of small non-coding RNAs that negatively regulate gene expression by promoting translational repression and messenger RNA degradation.12 Since TDP-43 promotes miRNA biogenesis,13 the dysregulation of TDP-43 activity associated with FTD and ALS pathogenesis could impact miRNA expression levels.14 Notably, miRNAs originating from neurons and glial cells are released through extracellular vesicles, especially exosomes, and can be measured in different body fluids, including CSF and plasma.15 Aberrant expression of miRNAs can be thus non-invasively detected in easily accessible body compartments, such as blood plasma, and potentially serve as biomarkers.16
Previous studies have explored selected plasma miRNAs as biomarkers for FTD/ALS17 or FTD18 19 using quantitative real-time PCR. Two of them have analysed the expression of a limited number of candidate miRNAs: nine miRNAs linked with apoptosis18 or 37 brain-enriched miRNAs.17 A wider miRNA profiling study19 analysed 752 miRNAs, as a first attempt to perform an unbiased assessment of circulating miRNAs in patients with FTD. In addition, a more recent study20 assessed the expression levels of 2313 miRNAs in a merged cohort of patients with FTD with different genetic forms (C9orf72, MAPT, GRN, TBK1) or with sporadic forms, by next generation RNA sequencing (RNA-seq). However, results among different studies have been conflicting so far, probably due to the heterogeneity of cohorts with respect to the underlying pathology (genetic or sporadic). Besides, these studies only compared healthy controls and symptomatic patients, focussing on evaluating potential diagnostic biomarkers. To date, no studies have evaluated plasma miRNAs as progression biomarkers for FTD or ALS in presymptomatic individuals.
The present work aims at investigating expression levels of plasma miRNAs in a large homogeneous genetic cohort of C9orf72 mutation carriers, both in the presymptomatic and in the clinical phases, to identify potential non-invasive biomarkers of preclinical and clinical progression in C9orf72-associated FTD and ALS. We hypothesise that performing large scale RNA-seq analyses in plasma samples, without a priori assumptions, will reveal significant differences in miRNA expression levels between healthy controls, presymptomatic and symptomatic mutation carriers.
Material and methods
Participants
PREV-DEMALS (https://clinicaltrials.gov/ Identifier: NCT02590276) is a national multicentric study focussed on C9orf72 mutation carriers. Between 2015 and 2017, 111 individuals were investigated with the same protocol in four French university hospitals (Paris, Limoges, Lille and Rouen), as previously described.6 21 Written informed consents were obtained from all participants.
This cohort included 22 patients (15 FTD, 4 FTD/ALS and 3 ALS) carrying a C9orf72 expansion and 89 asymptomatic first-degree relatives of C9orf72 patients (who have 50% risk to carry the mutation), out of 64 families. A pathogenic expansion was detected in 46 of them, denoted as the ‘presymptomatic group’. The control group was formed by the 43 asymptomatic individuals that did not carry an expansion.
At inclusion, each participant’s cognitive and behavioural clinical status was assessed based on standardised interview with relatives, comprehensive neurological examination, an extensive neuropsychological battery assessing all cognitive domains (including, notably, mini-mental state examination, Frontal Assessment Battery, Mattis Dementia Rating Scale and Ekman faces test) and behavioural scales (including Frontal Behavioural Inventory and Apathy Evaluation Scale) (table 1). The cognitive and behavioural evaluations and their scores have been described in more detail elsewhere6 21 and in online supplemental appendix A1. Neuromuscular function was thoroughly evaluated by means of quantitative motor testing according to Medical Research Council muscle scale, assessment of upper and lower motor neuron signs and administration of ALS-FRS (ALS-Functional Rating Scale), evaluating the degree of functional impairment. All participants underwent a systematic standardised interview to investigate the presence of cramps, fatigue, muscle pain, muscle weakness, muscle stiffness or fasciculations. Electromyography was proposed to the participants with even subtle motor signs or complaints.
Supplemental material
Demographic and clinical characteristics of the studied population
One participant was excluded because mild cerebellar syndrome was detected at a neurological examination, after inclusion. Thus, the present study comprises 110 individuals (22 patients, 45 presymptomatic carriers and 43 healthy controls), all of which underwent plasma sampling at their inclusion. The demographic and clinical characteristics of the studied population are shown in table 1.
The participants have then been clinically followed after their inclusion during a 3-year period, from 2017 to 2020. Four out of the 45 C9orf72 presymptomatic carriers have developed subtle frontal cognitive and/or behavioural changes and/or motor signs/symptoms during this period, without fitting diagnostic criteria for FTD or ALS, suggesting they were in the transitional ‘prodromal’ phase at the moment of or just after their inclusion visit. These cases are described in online supplemental appendix A2. All analyses in the presymptomatic group were performed with (n=45) and without (n=41) the four prodromal subjects. We also analysed these cases separately in an additional complementary approach.
Plasma collection and preparation
Blood samples were collected on EDTA using the same standardised collection and handling procedures for all participants across the centres. The mean disease duration at sampling was 6.2±4.0 years in the patients’ group. All were in fasted state. All samples were centralised at the ICM DNA and cell bank, and processed using the same protocol. Plasma was extracted at room temperature after centrifugation of blood samples at 2500 rpm for 10 min. Aliquots of 1 mL were stored in polypropylene tubes at −80°C.
MiRNA extraction and sequencing
MiRNA extraction was performed with a miRNeasy Serum/Plasma Kit (Qiagen) following the manufacturer’s instructions. We used 200 µL of plasma quickly melted and directly added to 1 mL of QIAzol solution. MiRNAs were eluted in 14 µL of water; 5 µL were used for miRNA sequencing library preparation with QIAseq miRNA Library Kit (Qiagen) according to the manufacturer’s protocol.
MiRNA sequencing was performed on Illumina NovaSeq 6000 in three independent batches, targeting a minimum of 10 million mapped reads per sample. Since batch effects may have a critical impact in high-throughput experiments, we randomly assigned each individual to one batch, equally distributing clinical status (control, presymptomatic and patient) and centres (Paris, Limoges, Lille and Rouen), to allow adjusting for batch effects during data analysis. Online supplemental table A1 describes the distribution of subjects across batches.
Raw reads to miRNA counts computation pipeline
Quality control of raw reads was performed with FastQC (Andrews S. 2010, http://www.bioinformatics.babraham.ac.uk/projects/fastqc). UMI-tools22 and Cutadapt23 were used respectively to extract UMIs and suppress adapting sequences as well as polyA tails. The resulting sequences were aligned with Bowtie24 and sorted by genomic location with Samtools sort.25 PCR bias was corrected with UMI-tools, its efficacy was assessed per chromosome with Samtools idxstats. After controlling for the overlap/ambiguity between miRNAs enrichment and Gencode annotation with FeatureCounts,26 miRNAs were counted with miRDeep2.27
Statistical analysis
Statistical analyses were performed using R V.3.6.1 (R Foundation for Statistical Computing, Vienna, Austria). The differential expression of miRNAs between clinical groups was assessed with the R package EdgeR.28 The analysis began with a count matrix with 2576 rows (one per miRNA i) and 110 columns (one per individual j). Only miRNAs considered above noise level (minimum count of 50 reads for at least one sample and a minimum total count of 1000) were retained for statistical analyses, reducing the count matrix to 589 rows. We assumed that miRNA counts followed a negative binomial distribution with mean  and dispersion
  and used generalised linear models to fit a log-linear model

for each miRNA, where  is the vector of covariates that describes sample j and
  is the vector of coefficients to be fitted for miRNA i. To control for possible batch, centre, age and gender effects, we added these variables as covariates in the model, in addition of clinical status. Raw counts were normalised using a trimmed mean of M-values.29 Once the models were fitted, quasi-likelihood F-test was employed to determine the subset of miRNAs differentially expressed between clinical conditions (miRNA signature). Statistical significance was set at level
  and p values were adjusted for multiple testing using the Benjamini-Hochberg method.
Machine learning for binary classification
After the differentially expressed miRNAs were identified, we implemented logistic regression classifiers with L2 regularisation in Python 3.8.0 using scikit-learn30 V.0.22.1. We used the expression levels of the miRNA signature as features to train binary classification models for each pairwise comparison between clinical status: controls versus presymptomatic individuals, controls versus patients and presymptomatic individuals versus patients. A stratified nested cross-validation strategy (online supplemental figure A1) was chosen to find the optimal hyperparameter (L2 regularisation coefficient) and to assess model performance using the area under the receiver operating characteristic curve (ROC AUC). We computed 90% CIs for the ROC AUC scores from 2000 bootstrap samples, by taking the 5th and 95th percentiles of the bootstrap distribution. Stratification with respect to clinical status was performed to preserve the proportion of healthy controls, presymptomatic subjects and patients in each fold.
Generalisation analysis
Since the differentially expressed miRNAs were computed with the entire data set, the test folds of the cross-validation were also used in the feature selection for our classification models, which could inflate prediction performance. To estimate this possible bias, we then incorporated feature selection in the nested 5-fold cross-validation process: differentially expressed miRNAs were computed using only the outer cross-validation loop training data (four out of five folds) at each iteration. The nested cross-validation was repeated 100 times with different fold splits to assess the generalisation performance of our classifiers.
Analysis of the transitional stage to clinical FTD/ALS disease
Since we hypothesised that the expression levels of differentially expressed miRNAs might provide information relevant to C9orf72 disease progression, we designed an experiment to evaluate prediction performance of clinical conversion to FTD/ALS in presymptomatic carriers. A logistic regression classifier was fitted with the expression levels of differentially expressed miRNAs from controls and patients. We used a regular 5-fold cross-validation to determine the optimal hyperparameter (L2 regularisation coefficient). Subsequently, this model was tested with the expression levels from the four known presymptomatic carriers who were in their transitional stage to the clinical disease. Scores from 0 to 1 were provided for each subject, indicating proximity with the expression levels of controls (scores near 0) or patients (scores closer to 1).
Target prediction and pathway analysis
A target-gene based miRNA enrichment analysis was performed, to discover potential biological functions regulated by the differentially expressed miRNAs. We used the publicly available tool DIANA-miRPath V.3,31 which implements an in silico miRNA target prediction algorithm (DIANA-microT-CDS) as well as an experimentally validated miRNA:gene interaction dataset (DIANA-TarBase V.7.0). Both approaches were carried out to identify target genes and the associated Kyoto Encyclopedia of Genes and Genomes (KEGG) pathways, using the set of differentially expressed miRNAs as input. The enrichment analysis method consisted of Fisher’s exact test (hypergeometric distribution) with Benjamini-Hochberg adjusted p value threshold of 0.05, giving as output a union set of associated KEGG pathways.
Results
Differentially expressed miRNAs computed with the entire data set
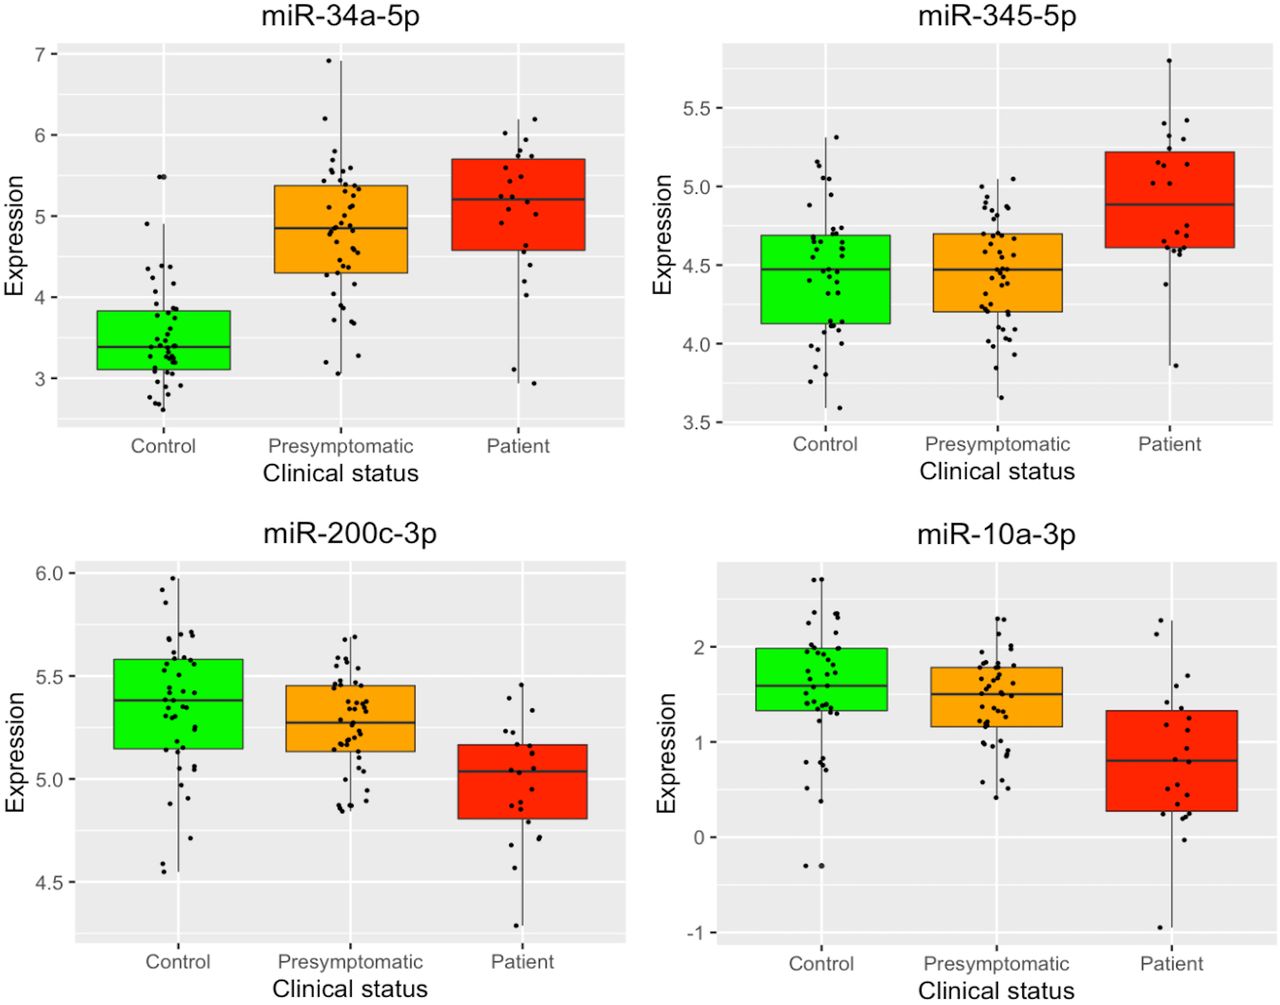
Table 2 displays all miRNAs identified as differentially expressed, for each pairwise comparison between clinical status, after correction for multiple comparisons. Four miRNAs were computed as differentially expressed between healthy controls and patients: miR-34a-5p and miR-345-5p were overexpressed, while miR-200c-3p and miR-10a-3p were underexpressed in symptomatic mutation carriers. Interestingly, miR-34a-5p was identified as significantly overexpressed also in presymptomatic mutation carriers compared with healthy controls, suggesting that miR-34a-5p expression is associated with C9orf72 mutation status. Additionally, miR-345-5p was also significantly overexpressed in patients when compared with presymptomatic carriers. When removing the four prodromal subjects from the presymptomatic group, the same miRNAs were identified as differentially expressed, indicating that the differences between the presymptomatic and other groups were not mainly driven by the four prodromal subjects.
Differentially expressed miRNAs identified by EdgeR, after correction for multiple comparisons, for each pairwise comparison between clinical status: Control (n=43), presymptomatic (n=45) and patient (n=22)
We considered these four miRNAs (miR-34a-5p, miR-345-5p, miR-200c-3p and miR-10a-3p) as our miRNA signature for further analyses. The complete output from EdgeR is available in online supplemental table A2.
Figure 1 displays boxplots with the expression levels, for each clinical group, of the four miRNAs identified as differentially expressed. There is a clear difference in miR-34a-5p expression levels between controls and C9orf72 expansion carriers (presymptomatic and symptomatic). Moreover, the other three identified miRNAs differentiate the mutation carriers at different stages of the pathology: miR-345-5p showed increased expression in patients, while miR-200c-3p and miR-10a-3p exhibited decreased expression. An expression heatmap of the miRNA signature is displayed in online supplemental figure A2.

Boxplots depicting the normalised log2 expression levels of the four microRNAs identified as differentially expressed. Box boundaries represent the first and third quartiles and the median is indicated by the line dividing the IQR. The upper whiskers extend to the values that are within 1.5×IQR over the third quartiles. The lower whiskers extend to the values that are within 1.5×IQR under the first quartiles.
MiRNA signature to classify between clinical groups
To assess whether the identified miRNA signature could distinguish between clinical groups, we implemented logistic regression models using as features the expression levels of the four differentially expressed miRNAs (miR-34a-5p, miR-345-5p, miR-200c-3p and miR-10a-3p). The ROC AUC for the classification of healthy controls and presymptomatic mutation carriers was 0.90 (90% CI 0.83 to 0.95), for controls and patients was 0.90 (90% CI 0.82 to 0.97) and to distinguish presymptomatic carriers and patients was 0.80 (90% CI 0.67 to 0.90) (figure 2). The distributions of the bootstrapped ROC AUC scores are displayed in online supplemental figure A3.

ROC (receiver operating characteristic) curves for each pairwise classification (control vs presymptomatic, control vs patient and presymptomatic vs patient) obtained with logistic regression using as features the expression levels of the microRNAs signature (miR-34a-5p, miR-345-5p, miR-200c-3p and miR-10a-3p). Bootstrapped 90% CIs are reported in brackets. AUC, area under the ROC curve.
Generalisation analysis
Since we used the entire data set to identify the miRNA signature, including test data, classification performance could be inflated. In order to assess the generality of our classification scores, we then incorporated feature selection in the nested cross-validation scheme (online supplemental figure A1), by using only the training data from the outer cross-validation loop to compute differentially expressed miRNAs. Figure 3 shows the distribution of miRNAs identified as differentially expressed after performing nested 5-fold cross-validation with 100 different fold splits. Notably, the most frequent miRNAs (highlighted in blue) correspond to the ones computed using the entire data set: miR-34a-5p (500 occurrences) when comparing healthy controls and presymptomatic mutation carriers; miR-34a-5p, miR-345-5p, miR-200c-3p and miR-10a-3p (respectively 497, 335, 259 and 196 occurrences) for controls and patients; miR-345-5p (157 occurrences) when analysing presymptomatic subjects and patients.

Number of times each miRNA was found differentially expressed, when performing a repeated 5-fold nested cross-validation for 100 times with different fold splits. In each step of the outer cross-validation loop, four of the five folds were used to identify differentially expressed miRNAs. Since one outer loop consists of five steps, and we performed 100 repetitions, 500 sets of miRNAs were computed for each pairwise comparison between groups, respectively: control vs presymptomatic, control vs patient and presymptomatic vs patient. MiRNAs from the signature computed with the entire data set are highlighted. miRNA, microRNA.
Regarding prediction performance, the average ROC AUC when classifying controls versus presymptomatic subjects was 0.88 (90% CI 0.83 to 0.91), for controls versus patients was 0.89 (90% CI 0.83 to 0.94) and for presymptomatic individuals versus patients was 0.67 (90% CI 0.52 to 0.77). The distributions of the ROC AUC scores computed with 100 different fold splits are displayed in online supplemental figure A4.
Analysis of the transitional stage to clinical FTD/ALS disease
We evaluated the performance to predict the transitional stage to FTD/ALS disease by training a logistic regression classifier with the expression levels from patients and controls and testing with the expression levels of presymptomatic individuals. The probability scores computed for the four subjects in their transitional stage were all above 0.50, indicating a stronger similarity with patients: 0.54, 0.75, 0.80 and 0.82. The distribution of probability scores for all presymptomatic subjects is displayed in online supplemental figure A5.
Target prediction and pathway analysis
Using the four differentially expressed miRNAs (miR-34a-5p, miR-345-5p, miR-200c-3p and miR-10a-3p) as input, we performed target prediction and pathway analysis with two methods available in DIANA-miRPath V.3. The in silico miRNA target prediction algorithm (microT-CDS) identified 31 influenced pathways (14 significant after Benjamini-Hochberg correction), while the experimentally supported approach (TarBase) resulted in 54 associated pathways (38 significant after Benjamini-Hochberg correction). Complete outputs concerning the list of the putative target genes and their related pathways are given in online supplemental tables A3 and A4. Table 3 reports the 13 pathways that were identified by both methods and have significant adjusted p values in at least one of them.
Results from pathway analysis using the four differentially expressed microRNAs as input
Online supplemental figure A6 shows miRNA versus KEGG pathways heatmaps, which depict the level of enrichment in significant KEGG pathways for the four differentially expressed miRNAs as computed by the two approaches.
Discussion
The present study aimed to identify fluid biomarkers by analysing expression levels of plasma miRNAs without a priori knowledge in a large cohort of healthy controls, presymptomatic and symptomatic C9orf72 carriers. We identified four miRNAs differentially expressed between clinical conditions: miR-34a-5p, miR-345-5p, miR-200c-3p and miR-10a-3p. Significantly higher expression of miR-34a-5p was found in mutation carriers when compared with healthy controls, which suggests that miR-34a-5p expression is deregulated in cases with C9orf72 mutation. Additionally, we observed miR-345-5p expression to be significantly increased in patients when compared with presymptomatic carriers, which supports the correlation of miR-345-5p expression with the progression of C9orf72-associated disease. Finally, our results also suggest that miR-200c-3p and miR-10a-3p underexpression might be associated with full-blown disease as decreased expression levels were significant only between patients and healthy controls.
We used the expression levels of the miRNA signature to train logistic regression classifiers, which were able to differentiate individuals from different clinical groups with good predictive performance (figure 2). Notably, presymptomatic and symptomatic C9orf72 carriers were distinguished with ROC AUC of 0.80 (90% CI 0.67 to 0.90), which suggests the suitability of plasma miRNAs for following preclinical progression and determining disease onset. We believe that this score was lower in our generalisation analysis (0.67, 90% CI 0.52 to 0.77) because the limited number of patients (22) led to a higher variability in the differentially expressed miRNAs in each step of the cross-validation loop (figure 3). Furthermore, we have obtained promising results regarding prediction performance of conversion from the presymptomatic to the clinical stage of FTD/ALS. The four presymptomatic subjects in transitional stage exhibited scores above 0.50, denoting a stronger similarity with the expression levels of patients. Although preliminary, these results suggest that the expression levels of our miRNA signature might be used as early predictors of the C9orf72 disease conversion.
Previous studies have shown the potential of miRNAs in serum, plasma or CSF as diagnostic biomarkers for FTD and ALS,9 17–20 focussing on comparing healthy controls and patients. However, our findings differ from preceding results: only two miRNAs from our signature (miR-345-5p and miR-200c-3p) were identified as differentially expressed in one of these studies,20 none in the others.17–19 Results are conflicting probably due to restricted choices for the analysed miRNAs17 18 and heterogeneous cohorts, either with sporadic forms18 19 or a mixture of sporadic and familial forms with different mutations.20 To the best of our knowledge, the present work is the first to compare the expression levels of plasma miRNAs between presymptomatic and symptomatic carriers focussing on C9orf72 mutation, in addition to providing a plasma miRNA signature that may contribute to the assessment of preclinical progression for C9orf72-associated FTD and ALS. Table 4 displays a comparison among studies evaluating miRNAs from blood samples (serum or plasma) of patients with FTD and/or ALS.
Comparison of studies investigating miRNAs from blood samples (serum or plasma) of patients with FTD and/or ALS
Overall, our work suggests that miR-34a-5p, miR-345-5p, miR-200c-3p and miR-10a-3p are likely involved in neuronal degeneration and C9orf72-associated pathogenesis. Among the KEGG pathways identified in this study, some involved in neurodevelopment (Hippo signalling and FoxO signalling), inflammation (TGF-beta signalling), intracellular transduction (neurotrophin signalling) and apoptosis (TGF-beta and FoxO signalling) were relevant as previously shown to be involved in C9orf72-disease.32–34 Accordingly, these four miRNAs have been previously linked with a range of neurodevelopmental processes, neuropsychiatric and neurodegenerative conditions.35–38 For instance, miR-200c and miR-34a family members are implicated in synaptic function, neuronal maturation, differentiation and survival.39 40 Aberrant expression of miR-34a and miR-345 are also associated with neuronal apoptosis,41 whereas members of miR-10a family were found to be differentially expressed in the muscle tissue of patients with ALS.42
How these four miRNAs are implicated in C9orf72-associated pathogenesis, and their relevance in brain pathology are important questions to go further. So far, only few studies addressing miRNA dysregulation in brain tissues of patients with FTD/ALS have been performed, and are summarised in online supplemental table A5. They specifically addressed GRN-associated,43 44 sporadic FTD,45 46 sporadic47 or mixed genetic-sporadic ALS patients.48 Notably, there was no miRNA dysregulation in common between the aforementioned studies, nor between any of those studies on the brain and ours on plasma. Those discrepancies may stem from the heterogeneity of the previous autoptic cohorts and the differences in the methods of miRNA expression analysis. Noteworthy, and differently from our investigation, none of the patient cohorts mentioned in online supplemental table A5 were exclusively made up of C9orf72 carriers. Additionally, the observed differences between brain tissue and plasma miRNA profiles may be due to the tissue-specific expression of miRNA on the one hand, and to the time-dependent variations of detectable miRNAs all along the disease course on the other. Due to the disease process itself and other potential confounding factors, significant changes in miRNA expression are likely to occur between a relatively early phase of the disease, in which plasma miRNAs may be used as biomarkers, and the ultimate disease stage, at the moment of brain sampling. At this point, further miRNA profiling studies on C9orf72 brain tissue are needed to better understand whether tissue miRNAs correlate with plasma expression profiles and their contribution to the disease pathogenesis.
Regardless, it is noteworthy that some studies pointed towards a direct relationship between these miRNAs and C9orf72 pathogenesis. C9orf72 stands as a putative target of miR-34a-5p, likely acting as a negative regulator of C9orf72 mRNA expression.49 Additionally, miR-200c-3p and miR-345-5p are down-regulated and up-regulated, respectively, in the extracellular vesicles secreted by induced astrocytes obtained from C9orf72 patients.50 Even if not completely explained so far, these important results parallel our study showing a comparable upregulation of miR-34a-5p and miR-345-5p and downregulation of miR-200c-3p in carriers, and provide converging evidence for a link between our set of miRNAs and C9orf72-pathogenesis, which will need further investigations.
Previous studies have provided the proof-of-concept that specific sets of miRNAs have the potential to serve as biomarkers of the preclinical/premanifest stages of other neurodegenerative diseases, such as ALS,11 Huntington39 and Prion diseases.51 Our study supports the usefulness of our four miRNAs as biomarkers of disease progression from the presymptomatic to the symptomatic phase of C9orf72 disease. Nevertheless, some of them may be dysregulated in a broader range of neurodegenerative conditions. For instance, miR-345 and miR-200c-3p were also dysregulated during the presymptomatic stage of Prion51 and Huntington’s diseases,39 respectively. This would not prevent, however, their use in longitudinal monitoring of specific genetic neurodegenerative disorders, possibly in combination with other biomarkers. Together, all these studies and ours suggest that dysregulation of such miRNAs is dynamically altered throughout neurodegenerative diseases progression, and can be detectable even long before clinical onset.
The current study has limitations. First, the significant age difference between patients and the other clinical groups may have introduced a confounding factor, which we considered by including age as a covariate. Second, the absence of validation in other tissues or of a replication cohort means that further studies in independent cohorts are required to confirm our results, even though our generalisation analysis confirmed the identified miRNA signature. Finally, the limited number of patients does not allow any conclusions about the correlation of plasma miRNAs and different disease phenotypes. Future work will explore longitudinal analyses of plasma miRNAs to assess their use as biomarkers of FTD and ALS progression.
In summary, the current work revealed significant differences in miRNA expression levels in plasma when comparing healthy controls, presymptomatic and symptomatic C9orf72 mutation carriers. Specifically, we highlighted the potential of miR-34a-5p, miR-345-5p, miR-200c-3p and miR-10a-3p expression levels in plasma as biomarkers of preclinical progression for C9orf72-associated FTD and ALS. Our results encourage the use of plasma miRNAs, possibly in combination with other markers, to improve the design of clinical trials for these neurodegenerative disorders.
Data availability statement
Data are available upon reasonable request (isabelle.leber@upmc.fr).
Ethics statements
Ethics approval
This study was approved by the Comité de Protection des Personnes CPP Ile-De-France VI (CPP 68-15 and ID RCB 2015-A00856-43).
Acknowledgments
We thank Justine Guégan, from iCONICS (ICM bioinformatics facility) for microRNA raw reads to counts pipeline handling. We also thank Yannick Marie and Delphine Bouteiller, from iGenSeq (ICM sequencing facility), for library preparation and sequencing. We thank the DNA and cell bank of the ICM for the technical assistance, notably Philippe Martin-Hardy (DNA and cell bank, ICM). The study was conducted with the support of the Centre d’Investigation Clinique Neuroscience (CIC 1422), GH Pitié Salpêtrière, Paris, and the Centre pour l’Acquisition et le Traitement des Images platform.
References
Supplementary materials
Supplementary Data
This web only file has been produced by the BMJ Publishing Group from an electronic file supplied by the author(s) and has not been edited for content.
Footnotes
Twitter @EmmanuelleBeck4
Collaborators The PREV-DEMALS study group includes: Eve Benchetrit (Hôpital de la Salpêtrière, Paris), Anne Bertrand (Hôpital de la Salpêtrière, Paris), Anne Bissery (Hôpital de la Salpêtrière, Paris), Marie-Paule Boncoeur (CHU Dypuytren, Limoges), Stéphanie Bombois (CHU Roger Salengro, Lille), Agnès Camuzat (ICM, Paris), Mathieu Chastan (CHU Charles Nicolle, Rouen), Yaohua Chen (CHU Roger Salengro, Lille), Marie Chupin (ICM, Paris), Olivier Colliot (ICM, Paris), Philippe Couratier (CHU Dypuytren, Limoges), Xavier Delbeuck (CHU Roger Salengro, Lille), Vincent Deramecourt (CHU Roger Salengro, Lille), Christine Delmaire (CHU Roger Salengro, Lille), Emmanuel Gerardin (CHU Charles Nicolle, Rouen), Claude Hossein-Foucher (CHU Roger Salengro, Lille), Bruno Dubois (Hôpital de la Salpêtrière, Paris), Marie-Odile Habert (Hôpital de la Salpêtrière, Paris), Didier Hannequin (CHU Charles Nicolle, Rouen), Géraldine Lautrete (CHU Dypuytren, Limoges), Thibaud Lebouvier (CHU Roger Salengro, Lille), Isabelle Le Ber (Hôpital de la Salpêtrière, Paris), Benjamin Le Toullec (ICM, Paris), Richard Levy (Hôpital de la Salpêtrière, Paris), Olivier Martinaud (CHU Charles Nicolle, Rouen), Kelly Martineau (ICM, Paris), Marie-Anne Mackowiak (CHU Roger Salengro, Lille), Jacques Monteil (CHU Dypuytren, Limoges), Florence Pasquier (CHU Roger Salengro, Lille), Gregory Petyt (CHU Roger Salengro, Lille), Pierre-François Pradat (Hôpital de la Salpêtrière, Paris), Assi-Hervé Oya (Hôpital de la Salpêtrière, Paris), Armelle Rametti-Lacroux (Hôpital de la Salpêtrière, Paris), Daisy Rinaldi (Hôpital de la Salpêtrière, Paris), Adeline Rollin-Sillaire (CHU Roger Salengro, Lille), François Salachas (Hôpital de la Salpêtrière, Paris), Sabrina Sayah (Hôpital de la Salpêtrière, Paris), David Wallon (CHU Charles Nicolle, Rouen).
Contributors VK had full access to all the data in the study and takes responsibility for the integrity of the data and the accuracy of the data analysis. Study concepts and study design: VK, VA, DS, ILB, OC and EB. Acquisition, analysis or interpretation of data: All authors. Manuscript drafting or manuscript revision for important intellectual content: All authors. Approval of final version of submitted manuscript: All authors. Literature research: VK, VA, DS and ILB. Statistical analysis: VK. Obtained funding: ILB and OC. Administrative, technical or material support: ILB, OC and EB. Study supervision: ILB, OC and EB.
Funding The research leading to these results has received funding from the programme 'Investissements d’avenir' ANR-10-IAIHU-06, from the French government under management of Agence Nationale de la Recherche as part of the 'Investissements d'avenir' programme, reference ANR-19-P3IA-0001 (PRAIRIE 3IA Institute), from Agence Nationale de la Recherche/DGOS (project ANR-PRTS PREV-DEMALS, grant number ANR-14-CE15-0016-07, promotion Assistance Publique-Hopitaux de Paris), from the Inria Project Lab Program (project Neuromarkers), from Fondation Vaincre Alzheimer FR-17035 and from the Institut Français de Bioinformatique (ANR-11-INSB-0013).
Competing interests OC reports having received consulting fees from AskBio (2020), having received fees for writing a lay audience short paper from Expression Santé (2019), having received speaker fees for a lay audience presentation from Palais de la découverte (2017) and that his laboratory has received grants from Qynapse (2017-present). Members from his laboratory have co-supervised a PhD thesis with myBrainTechnologies (2016-present). OC’s spouse is an employee of myBrainTechnologies (2015-present). OC has submitted a patent to the International Bureau of the World Intellectual Property Organization (PCT/IB2016/0526993, Schiratti J-B, Allassonniere S, Colliot O, Durrleman S, A method for determining the temporal progression of a biological phenomenon and associated methods and devices) (2016). ILB served as a member of advisory boards for Prevail Therapeutic and received research grants from ANR, DGOS, PHRC, Vaincre Alzheimer Association, ARSla Association, Fondation Plan Alzheimer outside of the present work. PG is co-founder and director of GenoSplice. NR is employee at GenoSplice.
Provenance and peer review Not commissioned; externally peer reviewed.
Supplemental material This content has been supplied by the author(s). It has not been vetted by BMJ Publishing Group Limited (BMJ) and may not have been peer-reviewed. Any opinions or recommendations discussed are solely those of the author(s) and are not endorsed by BMJ. BMJ disclaims all liability and responsibility arising from any reliance placed on the content. Where the content includes any translated material, BMJ does not warrant the accuracy and reliability of the translations (including but not limited to local regulations, clinical guidelines, terminology, drug names and drug dosages), and is not responsible for any error and/or omissions arising from translation and adaptation or otherwise.