Article Text

Abstract
Identifying biomarkers of Alzheimer’s disease (AD) will accelerate the understanding of its pathophysiology, facilitate screening and risk stratification, and aid in developing new therapies. Developments in non-invasive retinal imaging technologies, including optical coherence tomography (OCT), OCT angiography and digital retinal photography, have provided a means to study neuronal and vascular structures in the retina in people with AD. Both qualitative and quantitative measurements from these retinal imaging technologies (eg, thinning of peripapillary retinal nerve fibre layer, inner retinal layer, and choroidal layer, reduced capillary density, abnormal vasodilatory response) have been shown to be associated with cognitive function impairment and risk of AD. The development of computer algorithms for respective retinal imaging methods has further enhanced the potential of retinal imaging as a viable tool for rapid, early detection and screening of AD. In this review, we present an update of current retinal imaging techniques and their potential applications in AD research. We also discuss the newer retinal imaging techniques and future directions in this expanding field.
- Alzheimer's disease
- image analysis
- ophthalmology
Statistics from Altmetric.com
Introduction
Alzheimer’s disease (AD), the most common form of dementia, is a major public health and clinical challenge globally.1 Despite decades in research, the pathophysiology of AD remains unclear. The current thinking is that the neuropathology of AD, as characterised by accumulation of misfolded amyloid-β and tau protein, begins years before the onset of clinical symptoms. Given this long natural history, there are opportunities for early disease detection and thus timely intervention.2 3 Indeed, recent clinical trials have suggested the efficacy of certain measures (eg, lifestyle interventions or medication) in improving symptoms or slowing progression of AD.4
The definition of AD has also evolved in the past decade with the discovery of novel in vivo biomarkers for AD.5 6 It has been shown that clinically diagnosed cases of dementia presumably due to AD may be amyloid-negative in up to 25% of cases.7 8 Thus, biomarker confirmation has been proposed to improve the precision of AD diagnosis and now even biomarkers are indispensable for an AD diagnosis.9–11 The evolution in definition and diagnostic criteria of AD and other dementias may account for some of the variations and differences seen between studies discussed in this review. The 2018 National Institute on Aging and Alzheimer’s Association Research Framework defines AD in vivo by abnormal biomarkers of cerebral amyloid-β deposition and pathologic tau and treats cognitive impairment as a symptom or sign of the disease.9 This implies the cognitive function of a person affected by AD can thus range from cognitively unimpaired (preclinical AD) to mild cognitive impairment (MCI) (AD MCI), to dementia (AD dementia).9 Although this latest framework encourages in vivo detection and study of AD at an earlier stage (eg, preclinical AD or AD MCI), current technologies to detect amyloid-β and tau pathology using positron emission tomography (PET) brain imaging or cerebrospinal fluid (CSF) examination are limited due to their high cost, technical complexity, invasiveness of the procedures and/or the necessity of using radioactive tracers. Thus, identifying alternative, more accessible technologies and biomarkers of preclinical AD prior to onset of cognitive impairment may accelerate the understanding of the pathogenesis of AD, facilitate screening and stratification of risk, and ultimately aid in the discovery, development and testing of new treatments or preventive therapies in clinical trials.3
The retina, a neurosensory layered tissue lining the back of the eye and directly connected to the brain via the optic nerve, receives light that the lens has focused, converts the light into neural signals and sends these signals on to the brain for visual recognition. The retina has long been considered a ‘platform’ to study disorders in the central nervous system (CNS), as it is an accessible extension of the brain in terms of embryology, anatomy and physiology (box 1).12 Figure 1 shows the optic nerve head, macular area, nerve fibre layer, arterioles and venules captured from a retinal photograph. Similar to the neurovascular unit (NVU) in the CNS, the retinal NVU contains neurons (ganglion cells, amacrine cells, horizontal and bipolar cells), glial cells (Müller cells and astrocytes) and vascular cells (endothelial cells and pericytes).13 Evidence of retinal involvement in AD dementia has been shown in histopathological studies of postmortem specimens.14 ,S1 Associations of AD dementia with common eye diseases with overt clinical signs, such as age-related macular degeneration (AMD), diabetic retinopathy (DR) and glaucoma, have also been reported. In addition to digital retinal photography (figure 1), recent advances in non-invasive retinal imaging technologies allow more detailed interrogation of the different retinal layers, and even deeper structures beyond the retina, such as the choroid including the choroidal vasculature. These retinal imaging technologies, which include optical coherence tomography (OCT) (figure 2) and OCT angiography (OCT-A) (figure 3), have provided researchers with further access to detailed retinal neuronal structure (eg, nerve fibre layer, ganglion cell layer and inner-plexiform layer) and microvasculature (eg, foveal avascular zone), respectively. Table 1 shows a glossary of retinal imaging technologies and parameters used in studying AD. Details of these technologies are summarised in online supplemental section 1. In comparison to brain imaging technology, retinal imaging has the advantages of being non-invasive, comparatively low cost, increasingly widely available in non-tertiary (eg, primary care and community) settings, and having different variables for quantifying the structures of retina. The development of next-generation computational techniques such as artificial intelligence (AI) and deep learning (DL) algorithms has further enhanced the potential of data-rich retinal imaging as a promising tool and a source of biomarker for AD, particularly for individuals at preclinical AD stage. However, most of the retinal imaging technologies are still specialised equipment and the interpretation of data requires expertise from ophthalmologists or visual scientists.
Supplemental material
Similarities between the retina and the brain
Embryological
During embryonic development, the retina and optic nerve originate from the diencephalon. The retina maintains its connection with the brain via the optic nerve after birth, being an integral component of the CNS.12
Anatomical
Anatomically, the layered cytological and vascular structures and the presence of a blood barrier are similar in the retina and the brain. The retinal layers are composed of several types of neurons including the retinal ganglion cell (RGC) which comprises a cell body, dendrites and an axon, similar to neurons in the CNS. In addition, the RGC axons, which collectively form the optic nerve, are myelinated by oligodendrocytes and are ensheathed by all three layers of meninges. Furthermore, the retinal tissue is isolated by the blood–retinal barrier which maintains a distinct immunological and physiological environment, similar to the blood–brain barrier.S153 In terms of vascular structure, both the cerebral and the retinal microvasculature components are surrounded by a single layer of endothelial cells, which are non-fenestrated and possess similar intercellular tight junctional complexes.S154 Both are also surrounded by the perivascular end feet from astrocytes.S155 The choroid, the primary vascular supply for the outer retina, is sandwiched between the retina and the sclera. This has one of the highest blood flows per volume unit of any structure in the body.
Physiological
There are many physiological similarities between retina and brain. First, a NVU is present in both retina and brain, widely known as the ‘blood–retinal barrier’ and ‘blood–brain barrier’, respectively.13 , S156 The NVU allows functional coupling and interdependency of neurons, glia and the vasculature, for example, regulating blood flow in response to neural activity or metabolic demands. S157,S158 Retinal vascular autoregulation is achieved by retinal glial-synaptic interaction.S158 Second, similar to the CNS neurons, the RGCs produce an identical response to insults, including axonal degeneration, myelin destruction, scar formation and secondary degeneration.S159-S161 In addition, the RGCs have limited regenerative ability after injury.S162 Third, the retina is considered an immune-privileged site and contain similar collection of cell-surface molecules, immunoregulatory molecules and cytokines.S163,S164 Moreover, both cerebral and retinal microglia show phagocytic properties and phagocytose injured neurons.S165,S166 The cerebral vasculature is devoid of autonomic innervation beyond the pia vessels.S167 Similarly, there is no autonomic innervation to the retinal vasculature beyond the level of the lamina cribrosa (except the choroidal circulation).S168,S169 Finally, both the inner retinal and the cerebral circulation are under the fine control of the autoregulatory mechanism, which consists of myogenic and metabolic components.S154

(A) Retinal photograph showing the optic nerve head, macular area, nerve fibre layer, arterioles and venules. (B) Examples of a cognitively normal subject; and (C) a subject with Alzheimer’s disease (AD) dementia (Global Clinical Dementia Rating Score of 1). Retinal photographs assessed quantitatively with Singapore I Vessel Assessment software (SIVA, V.4.0; National University of Singapore, Singapore). Arterioles are in red and venules are in blue. The measured area is standardised and defined as the region 0.5 to 2.0 disc diameters away from the disc margin. The subject with AD dementia was also diagnosed with age-related macular degeneration. The subject with AD dementia had a sparser retinal vascular network (arteriolar fractal dimension: 1.246 vs 1.316; venular fractal dimension: 1.253 vs 1.273) and more tortuous retinal vessels (arteriolar tortuosity (×104): 0.61 vs 0.48; venular tortuosity (×104): 1.4 vs 0.50), compared with the cognitively normal subject.
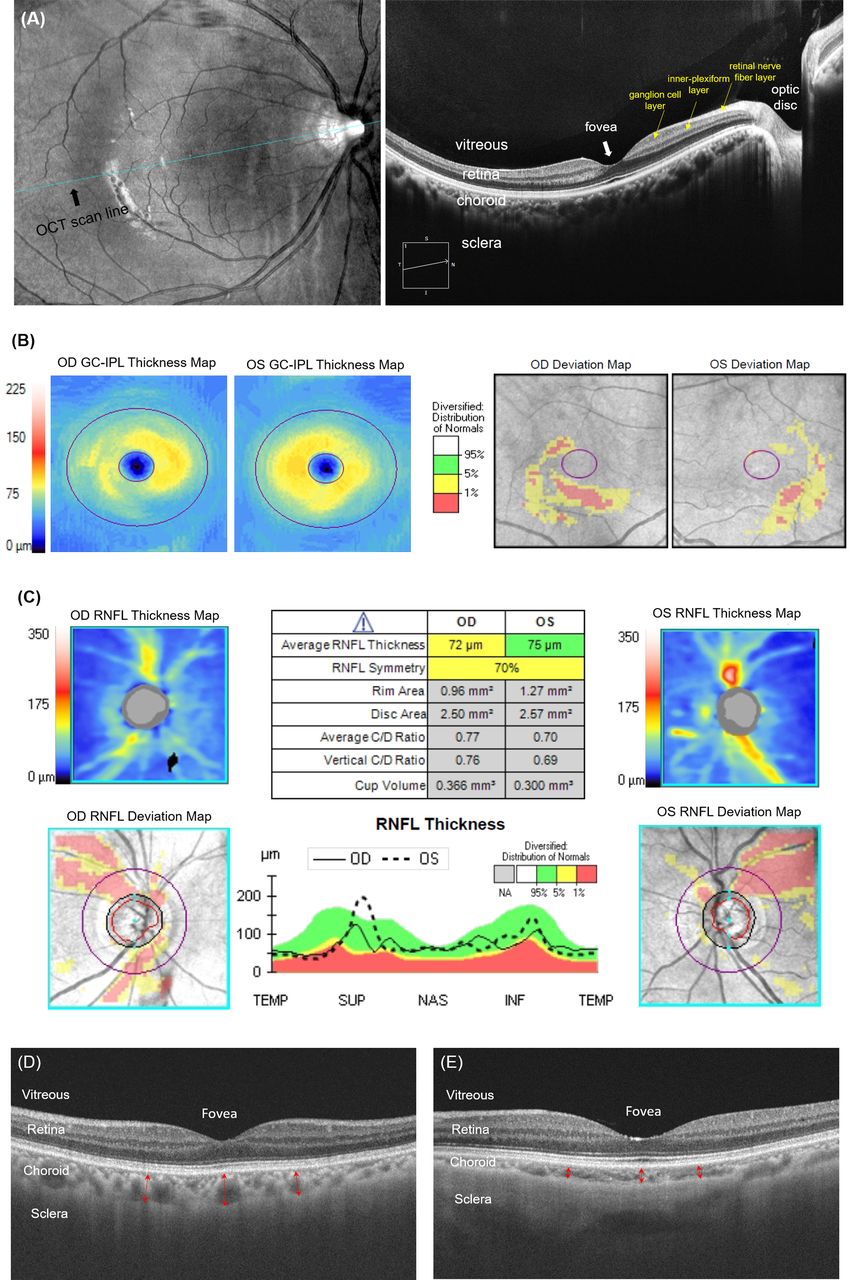
(A) Cross-sectional view of retina captured by optical coherence tomography (OCT). (B) Assessment of macular ganglion cell-inner plexiform layer (GC-IPL) and (C) peripapillary retinal nerve fibre layer (RNFL) of a subject who presented with mild cognitive impairment having a positive cerebral amyloid positron emission tomography (PET) imaging, measured with Cirrus HD-OCT (Carl Zeiss Meditec, Dublin, California, USA) (OD=right eye; OS=left eye). No retinal disorders were observed in this subject. The GC-IPL thickness map (B) and peripapillary RNFL thickness map (C) use a false colour coding with warm colours represent high and cool colours represent low thickness values. The software further compares the measured thickness to the device’s internal normative age-matched database and generates a deviation map. Thinner GC-IPL and RNFL thicknesses are observed in this example in prodromal stage. (D) A cross-sectional view of choroidal vasculature in an example of a cognitively normal subject; and (E) in a subject with Alzheimer’s disease (AD) dementia (Global Clinical Dementia Rating Score of 1). The choroid is indicated by red arrows. Choroidal-scleral interface can be clearly identified. The subject with AD dementia had a thinner choroidal layer compared with the cognitively normal subject.

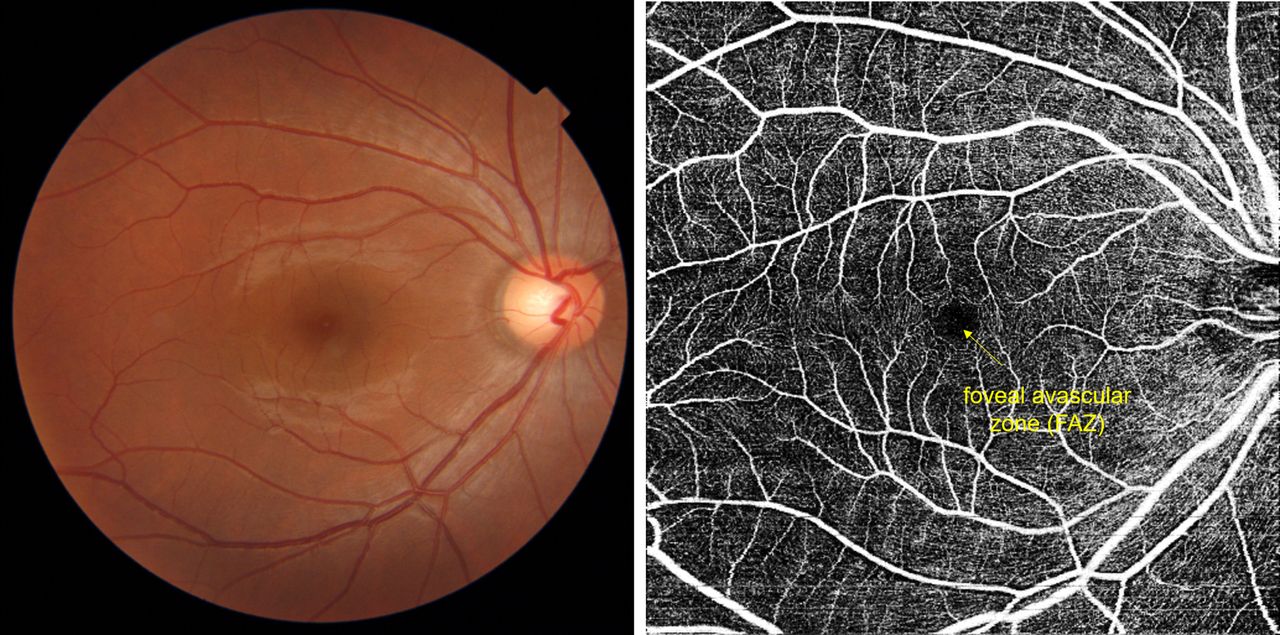
Imaging of retinal capillary network using optical coherence tomography angiography (OCTA), which is not visualised using conventional retinal camera.
Glossary of retinal imaging technologies and parameters used in studying Alzheimer’s disease
In this review, we present an update of the current retinal imaging technologies, recent research findings and future research applications in the study of AD.
Common eye diseases and AD
Vision itself may be an important stimulus for the maintenance of cognitive health or reflect possible relationships between AD with underlying eye diseases.S2-S7 Population-based and clinical studies have consistently shown that visual impairmentS8-S14 and a range of common eye diseasesS15-S19 are associated with dementia and impaired cognitive function. For example, in one study, older persons with visual impairment were twice as likely to have cognitive dysfunction than those with good vision.S11
Online supplemental table 1 summarises research on the relationship between common eye diseases, including AMD,S2-S5 DRS5 and open-angle glaucoma,S5-S7 with AD dementia. These epidemiological relationships suggest shared risk factors (eg, hypertension, smoking) and possibly pathogenic pathways (eg, neurodegeneration, amyloid-β deposits, chronic microvascular insults) between these ocular diseases and AD dementia. However, the associations have not been consistently observed in the literature, particularly in studies at a population level using large data linkage.S2,S3,S7 For example, a linkage study using English National Health Service data (AD cohort n=251 703, reference cohort n>2.5M), found no associations between AMD (relative risk 0.86 (0.67–1.08), compared with the reference cohort) and glaucoma (rate ratio 1.01 (0.96, 1.06), compared with the reference cohort) with AD dementia.S2,S7 Lee et al however suggested that the patterns of associations between eye diseases and AD dementia may be different when the ocular conditions are categorised as recent (diagnosed within 0–5 years) or established (>5 years) diagnoses.S5 They found only established AMD (HR 1.50 (1.25, 1.8)) and recent glaucoma (HR 1.46 (1.08, 1.91)) are associated with AD dementia, while both established DR (HR 1.50 (1.05, 2.15)) and recent DR (HR 1.67 (1.01, 2.74)) are associated with AD dementia.S5 A recent meta-analysis (21 studies, 7 876 499 study subjects) reported that patients with AD dementia are at greater risk for AMD (OR 2.22, I2=50%), and patients with AMD are also at increased risk of AD dementia/cognitive dementia (OR 2.42, I2=38%).15 Hence, it is likely that AD dementia and common eye diseases are linked via complex, interlinked, multimechanistic pathophysiology and pathways.
Retinal imaging measures and AD
Retinal neuronal layer changes at optic disc and macula
AD is classically characterised by loss of neurons and synapses in the cerebral cortex and specific subcortical regions. Previous histological studies have demonstrated that patients with AD also have loss of retinal ganglion cells (RGCs) and their axons.S20,S21 A more recent postmortem study further suggested that the number of melanopsin RGCs, photoreceptors driving circadian photoentrainment, may be reduced in AD.14 These observations have been the basis of clinical studies using OCT to determine the relationship between different retinal layers and AD.
The retinal nerve fibre layer (RNFL) surrounding the optic disc (peripapillary RNFL) reflects RGC axons (figure 1). RNFL thickness can be measured by techniques including time-domain OCT (first generation of OCT)S22-S32 as well as confocal scanning laser ophthalmoscopyS33 and scanning laser polarimetry.S34 These studies showed that in patients with AD dementia, there is a significant reduction in RNFL thickness compared with age-matched cognitively normal controls.
Spectral-domain OCT (SD-OCT) and swept-source OCT, a newer generation of OCT, provides information on inner retinal layers with greater resolution, such as the ganglion cell layer and the inner-plexiform layer (figure 2).S35 SD-OCT is now routinely used to not only to measure peripapillary RNFL but also to assess RGC cell body and dendrites together by segmenting and quantifying the thickness of the ganglion cell inner plexiform layer (GC-IPL, a combination of the ganglion cell layer and the inner plexiform layer) at the macula, since this region contains more than 50% of the total RGCs volume.S36 Numerous studies have investigated the association between SD-OCT measures and AD (online supplemental table 2). These studies first showed that SD-OCT measurements of both peripapillary RNFL (inter-visit intraclass correlation coefficient (ICC) 0.927 (range 0.845–0.961) and coefficients of variation (CoV) 3.83% (range 2.71%–5.25%)), and GC-IPL (inter-visit ICC was 0.968 (0.941–0.985), and CoV was 1.91% (range 1.24%–2.32%)) are reproducible in patients with cognitive impairment.S37 Second, while a few studies have reported thicker retinal layers in eyes of patients with AD dementia compared with controls,S38,S39 or no significant thickness differences,16 17 the majority of studies, including a meta-analysis, indicate that patients with AD dementia have thinner peripapillary RNFL (standardised mean difference (SMD)=−0.67; I2=89%) and macular GC-IPL (SMD=−0.46, I2=71%) compared with controls,18 consistent with a human postmortem study.19
Of the two SD-OCT measurements, some studies suggested that macular GC-IPL may be more sensitive than peripapillary RNFL for assessing neurodegeneration related to AD.20 21 For example, Cheung et al reported that macular GC-IPL has a better performance to discriminate AD from normal controls than that of peripapillary RNFL (area under receiver operating characteristic curves (AUROCs) 0.685 vs 0.601), adjusting for age and gender.20 Figure 2B,C shows an example of GC-IPL and RNFL measurement in a MCI subject with a positive cerebral amyloid PET imaging. Finally, these OCT studies are also consistent with research on other neurodegenerative diseases, such as patients with Parkinson disease and Lewy body dementia, who also have thinner RNFL and thinner inner retinal layers.S40,S41 Furthermore, thinner RNFL, GC-IPL and ganglion cell layer are also associated with reduced cerebral grey matter and white matter volumes and brain volume measured from MRI.22–26
Several possibilities have been proposed to explain the above findings on thinning of the retinal neuronal layer.18 27 First, the cerebral pathology of AD may affect the neuronal connections of the visual tract and cause retrograde degeneration of the optic nerve and retinal layers, resulting in thinner retinal neuronal and axonal layers including RNFL and GC-IPL.27 However, peripapillary RNFL could not discriminate controls from AD patients with posterior cortical atrophy, a clinical variant of AD with dominant involvement of parieto-occipital (ie, visual) cortex, where one would explicitly expect this retrograde degeneration to occur.S42 Alternatively, it is speculated that cerebral signs of AD pathology including amyloid-β plaques, fibrillar tau and signs of neuroinflammation occur simultaneously both in the brain and the retina, underlining a common pathogenesis linking retinal neuronal and axonal layer changes and AD.S1 S43-S47 The less common observation of thickened RNFL in ADS38,S39 may be explained by occurrence of reactive gliosis in inner retina, an inflammatory response, during early stages of AD, which may precede retinal neuronal layer thinning or mask underlying subtle retinal neuronal layer thinning on OCT.S48
There are fewer prospective studies on the longitudinal relationship of SD-OCT measures and development of cognitive function deterioration and AD dementia.27–31 The Rotterdam Study (n=3289) showed that a thinner peripapillary RNFL is associated with a higher risk of developing dementia (per 1 µm decrease HR 1.02 (1.01, 1.04)), including AD dementia (per 1 µm decrease HR 1.02 (1.01, 1.04)), independent of cardiovascular risk factors.27 In addition, longitudinal data from the UK Biobank (n=32 038) enrolling healthy community dwelling participants also showed that thinner RNFL is a precursor of future decline in cognitive function.28 Specifically, they found that those in the lowest two quintiles of baseline peripapillary RNFL distribution had twice the likelihood of a developing a decline in cognitive function over a 3-year follow-up interval compared with those in the top RNFL quintile.28 In regard to GC-IPL, data from the Rotterdam Study showed that thinner GC-IPL is only associated with prevalent dementia (per 1 µm decrease OR 1.03 (1.00, 1.09)), but not with incident dementia (per 1 µm decrease HR 1.02 (0.99, 1.05)) or incident AD dementia (per 1 µm decrease HR 1.02 (0.99, 1.05)).27 The Rotterdam Study group speculated that there may be a time delay between optic nerve degeneration (reflected by RNFL thinning) and RGC loss (reflected by GC-IPL thinning) as the damage to the optic nerve may cause swelling or gliosis formation of the RGC axons (ie, RNFL). Therefore, the neurodegenerative process may manifest itself in the retina initially as thinner peripapillary RNFL, after which thinning of GC-IPL follows.27
Retinal arteriolar and venular changes
There is also substantial evidence indicating a vascular disease component in AD pathophysiology. Clinical and epidemiological studies show that vascular diseases and their risk factors commonly accompanies AD.32 Vascular risk factors are associated with higher cerebral Αβ burden.33 Comorbidity of cerebrovascular disease and amyloid-β is associated with cognitive decline and neurodegeneration.34 In particular, microvascular or small vessel disease is now thought to be a major contributor to dementia and cognitive decline.S49-S52 For example, an autopsy-based neuropathological study showed that a large majority of patients diagnosed with AD without clinical evidence of mixed (vascular) dementia had microvascular pathology including lacunes, cerebral microbleeds and multiple microinfarcts indicative of small vessel disease.35
The retinal circulation of arterioles and venules, measuring 100–300 µm in size, are the only optically accessible small blood vessels in the human body. The retinal vasculature can be imaged by either conventional retinal photography (figure 1A) or dye-based fluorescein angiography. However, because dye-based fluorescein angiography is invasive, conventional retinal photography has been the most commonly used retinal imaging technique to capture clinical vascular disease signs, such as those typically seen in patients with diabetes or hypertension (eg, retinal haemorrhage, cotton wool spots, microaneurysms, arteriovenous nicking, enhanced arteriolar light reflex). In addition to these qualitative signs, computerised algorithms have been developed to measure quantitative changes in the retinal vasculature, for instance, the calibre of arterioles and venules.36–38 Furthermore, geometric patterns of the retinal vasculature may also provide information on microvascular health. Based on Murray’s principle of minimum work, the human circulatory system is a branching system that conforms to optimum design principal to minimise the energy required to maintain blood flow.S53 Algorithms estimating a number of retinal geometric parameters such as fractal dimension, tortuosity and bifurcation have been further reported.S54-S61 These algorithms capture deviations from the normal optimal architecture of the retinal vascular network. Several algorithms can be used to analyse retinal photographs taken by conventional retinal cameras. Figure 1B,C shows examples of quantitative retinal vasculature analysis using a widely used software, the Singapore I Vessel Assessment (SIVA), in a cognitively normal subject and a subject with AD, respectively. Other software and algorithms include IVAN (Integrative Vessel Analysis),36 VAMPIRE (Vascular Assessment and Measurement Platform for Images of the REtina)S57 and QUARTZ (QUantitative Analysis of Retinal vessel Topology and siZe).S58
Online supplemental table 2 summarises the clinical studies reporting relationship of quantitative retinal vasculature analysis from retinal photographs with AD. In general, these studies showed a sparser retinal vascular network (indicated by decreased retinal vascular fractal dimension) is associated with AD dementia,39–42 poorer cognitive test score performances43 44 and MRI markers of cerebral small vessel disease.45 For example, Frost et al found that decreased arteriolar fractal dimension (1.201 vs 1.235, p=0.008) and venular fractal dimension (1.171 vs 1.210, p<0.001) in AD dimension, compared with controls.39 Cheung et al found that decreased arteriolar fractal dimension (per-SD decrease OR 1.35 (1.08, 1.68)) and venular fractal dimension (per-SD decrease OR 1.47 (1.17, 1.84)) are associated with AD dementia.40 These findings suggest that changes in the retinal vascular fractal dimension may also reflect a departure from optimal integrity of the cerebral microcirculation (eg, rarefaction) related to cognitive impairment.46 Studies also showed that narrower retinal venular calibre is associated with AD dementia, which may be related to an increased venous wall thickness due to collagen deposition in cerebral veins.39 40 Although some studies observed significant associations between retinal vascular tortuosity and AD dementia, the relationship remains equivocal. Cheung et al 40 found that both increased retinal arteriolar (per-SD increase OR 1.80 (1.40, 2.31)) and venular tortuosity (per-SD increase OR 1.94 (1.48, 2.53)) are associated with AD dementia, while Williams et al 41 found that decreased retinal arteriolar (per-SD increase OR 0.78 (0.63, 0.97)) tortuosity is associated with AD dementia. It is noted that increased retinal vascular tortuosity is associated with higher blood pressure and diabetes,S59,S62 and difference between studies may reflect differences in prevalence of hypertension and diabetes (eg, participants in the study by Cheung et al had higher prevalence of both hypertension and diabetes than participants in studies by Williams and Frost). On the other hand, if different pathophysiological mechanisms occur at different stages of AD,47 associations with retinal parameters would be expected to change correspondingly. Thus, clinical and demographic data and stages of AD should be taken into account when interpreting findings across studies.
Retinal capillary changes
In addition to the arterioles and venules, changes at the capillary level (5–15 µm) may also be studied for their relationship to AD.48 49 The retinal capillary network can now be imaged by dye-free OCT-angiography (OCT-A) which visualises capillary levels at different levels and sites of the retina: the superficial capillary plexus, the deep capillary plexus and the radial peripapillary capillary plexus. Images captured by OCT-A (figure 3) have helped to identify and quantify capillary level abnormalities in primary retinal diseases such as DR and AMD.S63-S66 Online supplemental figure 1 shows image processing steps adopted to quantify the capillary networks from OCT-A images.S63 Recent reports (online supplemental table 2) have identified changes in the retinal capillary networks using OCT-A in AD dementia and preclinical AD. S67-S75 For example, Bulut et al observed decreased capillary network density (45.5% vs 48.7%, p=0.002) and an enlarged foveal avascular zone area (0.47 mm2 vs 0.33 mm2, p=0.001) in 26 patients with AD dementia, compared with 26 age-matched and sex-matched controls.S67 O’Bryhim et al further demonstrated that enlarged foveal avascular zone measured from OCT-A is associated with preclinical AD (0.364 mm2 vs 0.275 mm2, p=0.002), as defined by the presence of amyloid-β biomarkers from PET or CSF, compared with those amyloid-β-negative control subjects (n=32 participants).S74 In addition, they reported that foveal avascular zone area can discriminate participants with biomarker positive and biomarker negative with an AUROC of 0.801.S74 These observations are in line with disturbances in the morphology and function of cerebral capillary networks observed as antecedents to neurodegenerative changes associated with AD in animal models and postmortem studies. S76-S78 However, the current literature is not entirely consistent. For example, Querques et al and den Haan et al did not observe any differences in capillary network density and foveal avascular zone between patients with AD dementia and controls.S71,S72 Van de Kreeke et al have reported that an increased capillary network density in patients with preclinical AD, instead of a decreased one, compared with controls (inner ring macula difference: 0.81%, p=0.002; outer ring macula difference: 0.50%, p=0.024; and around optic nerve head difference: 0.83%, p=0.015), which may be due to an inflammatory state of the retina in the early stages of amyloid-β accumulation.S75 It is noteworthy that similar to the literature on retinal imaging technologies as mentioned above, the diagnosis of AD dementia differs between different OCT-A studies, and most of studies are currently limited by small sample size and the inability to adequately account for potential confounding factors (eg, diabetes, axial length of the eyeball).
Choroidal vasculature changes
Deep to the retina, the choroid contributes blood supply to the outer retina. In addition to the retinal vasculature (arterioles, venules, capillary network), SD-OCT with enhanced depth imaging, or swept-source OCT, has now made it possible to image the choroidal vasculature. Figure 2D,E shows a cross-sectional view of the choroidal vasculature imaged by SS-OCT in a cognitively normal subject and a subject with AD, respectively. A few case–control studies have observed thinning of the choroidal layer as assessed by SD-OCT with enhanced depth imaging in AD dementia (online supplemental table 2).S67,S79,S80 For example, Gharbiya et al first reported reduced subfoveal choroidal thicknesses (200.9 µm vs 266.1 µm, p=0.001) in 21 patients with mild to moderate AD dementia compared with controls. It was postulated that choroidal thinning indicates an abnormal choroidal blood supply associated with vasoregression or atrophic changes related to a series of pathologic events (eg, inflammatory cascade) triggered by amyloid-β deposition in the brain.S80,S81 In a recent prospective study (n=78), a larger reduction in choroidal thicknesses is observed in AD dementia over a 12-month follow-up (changes in subfoveal choroidal thickness: −10.47 µm vs −2.0 µm), compared with controls.S81 This finding is consistent with a report on postmortem eyes from patients with AD dementia and animal models of AD.S82 Furthermore, a population-based study with more than 3000 participants found reduced subfoveal choroidal thickness is significantly associated with lower Mini Mental Status Examination score, in line with the findings in AD dementia eyes.S83
Vasodilatory response changes
The retinal NVU contains neurons, glial cells and vascular cells, similar to the NVU in the CNS.13 Flickering light stimulates activity of the neural retina and leads to retinal vessel dilation as a result of the release of vasodilating factors, especially nitric oxide, from endothelial and neural cells. This dynamic reaction of retinal vessels to flickering light is influenced by neurovascular coupling and can therefore be used to assess the function of NVU in the retina.S84 The flicker-induced vasodilatory response can now be measured non-invasively using a dynamic vessel analyser (DVA). A few studies have explored to use DVA to investigate the flicker-induced vasodilatory response in AD, but the current findings are still preliminary and inconclusive. Kotliar et al observed that overall flicker-induced vasodilatory response is delayed in AD dementia (arterial time to reach 30% of maximum dilation: 7.0 s vs 5.0 s, p<0.001) compared with controls, suggesting delayed arterial reaction in AD.50 They also demonstrated that this DVA parameter can discriminate AD dementia with an AUROC of 0.853.50 However, Golzan et al only found a positive correlation between neocortical amyloid-β standardised uptake value ratio measured by PET with the amplitude of retinal arterial pulsations, but did not observe any correlations with dynamic flicker-induced retinal arteriolar or venular dilation in an elderly cohort.51 It is noteworthy that patients with diabetes and DR have reduced flicker-induced vasodilatory response.S85,S86 Kotliar’s and Golzan’s studies did not specifically exclude those with diabetes and with ocular diseases, which may confound the results reported. Querques et al recently conducted a similar study but excluded subjects with diabetes and optic nerve or retinal diseases and reported that retinal arteriolar dilation in response to flickering light is reduced in the AD dementia group, compared with controls (0.77% vs 3.53%, p=0.002) and the MCI group (0.77% vs 2.84%, p=0.045).S71 This study suggests that the neurovascular coupling of retinal vessels in AD dementia is impaired, especially in retinal arterioles, and the effect is independent of diabetes. This observation suggests that decreased retinal and cerebral blood flow (ie, hypoperfusion) might impair the endothelial function and the production of nitric oxide, which is vital for the vasodilatation process.52 , S71
Retinal vessel oxygen saturation changes
The retina is one of the most metabolically active tissues in the human body. Retinal vessel oxygen saturation can now also be measured non-invasively, based on estimation of haemoglobin oxygen saturation in retinal vessels by taking two simultaneous retinal photographs with 570 and 600 nm light.S87 Studies have reported that retinal oxygen saturation in arterioles and venules is significantly higher in both AD dementia and MCI eyes compared with controls.S88, S89 Einarsdottir et al showed that retinal arterioles have 94.2%±5.4% oxygen saturation in moderate AD compared with 90.5%±3.1% in healthy subjects (p=0.028). Retinal venules were 51.9%±6.0% saturated in moderate AD compared with 49.7%±7.0% in healthy subjects (p=0.02).S88 Olafsdottir et al further showed that arteriolar and venular oxygen saturation was increased in patients with MCI compared with healthy individuals (93.1%±3.7% vs 91.1±3.4%, p=0.01; 59.6±6.1% vs 54.9±6.4%, p=0.001, respectively).S89 These studies demonstrate a decreased metabolic activity in the retina and this exploratory finding may provide new insight into the pathophysiology of AD related to hypometabolism.
Peripheral retinal changes
Drusen deposits are the hallmark of AMD. Amyloid-β has been found in drusen deposits in the retina.S90 In a recent pilot study, Csincsik et al used ultra-widefield scanning laser ophthalmoscopy and examined AMD-like drusen deposits in a wider field of the peripheral retina, in addition to the macular region.42 They found that patients with AD dementia are more likely to have drusen deposits in the peripheral retina compared with controls (25.4% vs 4.2%, p=0.04), especially in the superior nasal quadrant.42 Online supplemental figure 2 shows an example of presence of drusen deposits in the peripheral retina imaged by ultra-widefield scanning laser ophthalmoscopy in a subject with AD dementia. In addition, Ukalovin et al also found that the severity of cerebral amyloid angiopathy, a vascular feature associated with AD dementia and cognitive decline,S91 is correlated with the number of drusen in the peripheral retina from postmortem AD eyes (r=0.78, p<0.05).S92 The preliminary findings from these exploratory studies suggest that retinal abnormalities related to AD are also present in peripheral retina, in addition to retinal changes measured from conventional retinal imaging areas focused centrally (ie, macular and optic disc regions). Further studies are required to determine whether the peripheral retinal changes have similar or additional predictive value for AD dementia or cognitive decline, and to develop better understanding of the significance of these associations, particularly since peripheral changes can also occur in the intermediate to advanced stage of AMD.S93
Retinal fluorescence lifetime changes
The retina has several kinds of endogenous fluorophores, including lipofuscin, advanced glycation end products, collagen, melanin and elastin. Retinal fluorophores can be excited by monochromatic light (eg, laser) and gain a higher level of energy before returning to their ground state by emitting photons of longer wavelengths than the exciting light (ie, fluorescence lifetime).S94 Each fluorophore possesses a characteristic fluorescence lifetime. Fluorescence lifetime imaging ophthalmoscopy (FLIO) is a technique for measuring fluorescence lifetime, which is calculated by the average amount of time a fluorophore remains in the excited state following excitation, to allow detecting metabolic alterations in the retina for various retinal disease such as AMD at an early stage.S94 Jentsch et al found that a longer retinal fluorescence lifetime measured by FLIO is correlated with higher tau protein concentration in CSF in patients with AD dementia.S95 In a pilot study, Sadda et al also found that subjects with preclinical AD, compared with controls, have longer retinal fluorescence lifetime (593.9±93.3, 454.4±38.6 ps; 475.0±71.6, 394.1±28.2 ps in short spectral channel and long spectral channel of AD and control groups, respectively, p=0.036 and 0.024), which is also correlated with GC-IPL thickness, amyloid-β and tau protein in CSF.S96 The preliminary findings from these exploratory studies suggest that the fluorophore composition in the retina may be related to AD.
Age-related effect on the retina
Age-related changes are well reported in the retinal neuronal and vascular structures as well as in the choroid. RNFL and GC-IPL thicknesses decrease with increasing age in healthy adults.S97-S99 In a longitudinal analysis, the mean rate of change of average RNFL is −0.52 µm/year in normal individuals.S100 Similarly, narrower retinal vessel calibre, straighter retinal vessels, sparser retinal vasculature and decreased choroidal thickness are correlated with increasing age in healthy adults as reported from population-based studies.S101-S105 In the Singapore Malay Eye Study-2, for each 1-year increase in age, subfoveal choroidal thickness decreased by 3.10 μm.S104 These age-related effects on retinal imaging measures are considered as a physiological process; however, the current measurements are not standardised by age. Although most of the reported studies were case–control study design matched with age or included age as a confounding factor in the statistical models, how to taking ageing effect into account during image interpretation in clinical practice should be further addressed.
Evidence of AD pathology in the retina is equivocal
Amyloid-β protein plaques and neurofibrillary tangles comprised of hyperphosphorylated tau protein are pathological hallmarks of AD. Several histopathological studies have identified retinal amyloid-β deposits in animal models of ADS82,S106 as well as human subjects with definite AD14 , S1 and suspected early AD.S44 The majority of amyloid-β deposits are in the GC-IPL,S46 and some show perivascular clustering.14 , S1 A clinical study by Koronyo et al also demonstrated an increased presence of amyloid-β in the retina of patients with AD dementia compared with controls, especially in the peripheral superior quadrant, often clustered along blood vessels.S1 These retinal amyloid-β plaques qualitatively resemble those found in the cerebrum of subjects with AD dementia and were only detected in minimal quantities in age-matched non-AD controls.14 , S1 Moreover, it is possible that accumulation of retinal amyloid-β plaques occurs earlier than in the brain and the amount increases with disease progression.S44 Similar to those in the brain, retinal amyloid-β deposition also showed to be associated with marked neurodegeneration. La Morgia et al demonstrated that there is amyloid-β deposition in and around degenerating melanopsin RGCs, suggesting amyloid-β is toxic to retinal neurons.14 Koronyo et al also reported that, when compared with matched controls, reduced cell counts in the RGC layer, inner nuclear layer and outer nuclear layer are observed in patients with AD dementia along with accumulation of amyloid-β.S1 In line with these findings, the neurotoxicity of amyloid-β to retinal neurons has also been shown in both cell-line studiesS107,S108 and animal model studies.S43,S109,S110 These findings from animal studies are therefore consistent with the observations of clinical studies reporting thinner RNFL and GC-IPL in patients with AD dementia discussed above. Apart from retinal amyloid-β deposition, animal studies also showed that there are tau aggregates in the retina of transgenic mice with a tau mutation.S111 These mice display abnormal neurotrophic factor signalling, increased susceptibility to excitotoxic damage, early axonopathy and functional deficits of RGCs.S111,S112
However, it is noteworthy that the evidence of AD pathology in the retina is not consistent across the literature, and presence of amyloid-β or tau in the retina still remains controversial.S113 For example, Schön et al reported that the postmortem retinas of patients with AD dementia only contain hyperphosphorylated tau but not amyloid-β or fibrillar tau aggregates.S45 Several studies did not find any AD-related pathology in AD retinas and could not replicate previous findings.S21,S114,S115 Haan et al found that despite amyloid-β/amyloid precursor protein being present in postmortem AD retinas, there are no amyloid-β/amyloid precursor protein-related differences, but rather tau-related changes, between AD and control retinas.S116 It is noted that adoption of different tissue processing methods and immunostaining protocols, and comorbidity of ocular diseases and AD may possibly explain some discrepancies. On the other hand, although amyloid is proclaimed as a toxic substance, it triggers the pathological process in the very initial state of the disease. For instance, hippocampal volume is characteristically reduced in AD with congruent tau pathology in the corresponding region, whereas it lacks amyloid pathology in hippocampal region.S117 Findings on the presence of amyloid-β or tau in the retina should be further replicated before we assume that AD pathology in the retina is present. Furthermore, studies on relationships among amyloid, tau and retinal changes in the pathological study of AD are warranted.
Future research
Studies to date suggest a range of retinal imaging technologies can be used to study different stages of AD. However, more research is clearly needed. For example, studies on relationships between retinal imaging measures and ‘standard’ biomarkers of AD pathophysiology, as well as direct comparisons between different retinal imaging measures to determine relative sensitivity/specificity of each measure for AD clinical diagnosis or biomarker status are warranted. Furthermore, some neuronal and vascular changes in the retina are similar between AD and ocular disease. Some of these researches are discussed below.
Framework of development and validation of retinal imaging as a source of biomarkers
Disease-modifying treatments for AD are most likely to be successful if initiated early in the disease process, ideally before irreversible neurodegeneration and functional decline set in.53 54 Biomarkers may aid in risk profiling to identify those at greatest risk, detection of pathology at the earliest possible stage, and by providing endpoints for trials that identify benefit earlier in the natural history of the disease, thus accelerating the development of new treatments. Therefore, discovering effective biomarkers of AD is a priority for development of new treatment.
A biomarker is defined as an objective substance, characteristic or other parameter of a biological process that enables the assessment of a disease risk or prognosis and provides guidance for diagnosis or monitoring of treatment.10 Different groups have proposed frameworks or roadmaps for biomarker development and validation for AD.9 10 55 56 For example, Frisoni et al proposed a five-phase framework to foster the clinical validation of biomarkers for an early diagnosis of AD, adapted from the approach for cancer biomarkers. These include preclinical exploratory studies, clinical assay development for AD pathology, retrospective studies using longitudinal data available in repositories, prospective diagnostic accuracy studies and disease burden reduction studies.10 A consistent framework to assess the validity of biomarkers for different clinical purposes is essentially important for implementation and clinical use in AD.
Currently, retinal imaging technologies cannot yet be considered a source of biomarker of AD as many areas of research remain conflicting and evidence-based guidelines on the use and interpretation of retinal imaging are currently lacking. Most published studies have focused on demonstrating measure difference compared with controls and associations (linear or logistic regression models) between a set of retinal imaging measures with AD dementia only. Moreover, studies on preclinical AD are largely lacking. Table 2 summarises the findings on retinal neuronal changes, retinal capillary changes, retinal arteriolar and venular changes, and choroidal vasculature changes. In addition, some of the reported associations may not account for potential confounding factors (eg, ocular diseases and systemic conditions) and clinical stages of AD. The current retinal imaging features (eg, RNFL loss) are also non-specific to AD and not designed to fully describe and characterise the spectrum of AD-related disorders. For example, there is a lack of consensus on how best to differentiate between retinal changes seen in glaucoma and AD dementia. Typically, in patients with glaucoma, the reduction in peripapillary RNFL occurs in inferior and superior sectorsS118 but the studies in AD dementia have also shown similar patterns of RNFL reduction.18 Many prior studies have also not evaluated retinal imaging for a specific clinical purpose such as screening, diagnosis, prognosis or monitoring of AD dementia. Appropriate statistical analysis of biomarker validation should be performed (eg, performing area under the receiver operating characteristic curve to evaluate discriminative performance). Finally, the definition of AD in the reports did not consistently include confirmation from current available biomarkers. Thus, there is inadequate evidence on the clinical usefulness of retinal imaging measures as a biomarker for AD.
The summary of current findings on retinal neuronal changes, retinal capillary changes, retinal arteriolar and venular changes, and choroidal vasculature changes
We suggest the following framework of research (online supplemental table 3). First, studies should be designed and conducted to validate biomarkers from retinal images with a specific clinical purpose (eg, screening or risk stratification). Second, diagnosis of AD should be defined in a consistent manner with the latest available criteria (eg, confirmation with current biomarkers). Third, standard statistical measures of accuracy of biomarkers should be reported. For example, if a study evaluates measures from retinal images as a potential screening tool, the sensitivity, specificity, false-positive and false-negative rates of retinal imaging should be reported. The degree of abnormality and the prevalence (ie, how frequent is the abnormality found in AD) should be described. Fourth, studies should be designed carefully to take into account many age-related ocular conditions. The effects of ocular factors (eg, axial length of the eyeball) on retinal imaging measures and the associations with common eye diseases (eg, glaucoma and AMD) should be determined and considered in the analysis and interpretation. Fifth, the reproducibility of the retinal imaging measures should be determined, particularly if retinal imaging is used for disease diagnosis and monitoring on multiple follow-up visits. Finally, the incremental benefit and cost-effectiveness of retinal imaging, as well as acceptability to patients in different settings, should be evaluated. These areas should be reported in the framework of retinal imaging studies for AD.
Other new retinal imaging technologies related to AD
Several new retinal imaging technologies are also being explored which might provide additional value in this field.
Retinal hyperspectral imaging obtains a series of hyperspectral reflectance images, combing both spectral and spatial information, by scanning the retina with a continuous range of wavelengths of light.S119 More et al showed that amyloid-β exerts a characteristic influence on the reflectance of light as assessed by retinal hyperspectral imaging and that the magnitude of this effect varies in proportion with the amount of amyloid-β in the retina of AD mouse.S120,S121 This finding was further validated in recent in vivo human clinical studies by showing optical density spectral profiles are different between AD and controls,S122 and cases who are amyloid-β positive and negative on PET can be discriminated from the reflectance of hyperspectral retinal images with a machine learning–based model for the classification.S123,S124 Hyperspectral imaging technology is also being investigated to identify brain cancerS125 as well as to estimate cerebral metabolism and haemodynamics from brain tissues.S126
Adaptive optics, improving the performance of optical systems by reducing the effects of optical aberrations, can be employed in scanning laser ophthalmoscopy to achieve very high resolution (~2 µm) in the human retina resulting in the direct visualisation of nerve fibre bundles and other minute retinal features.S127 Zhang et al found that individuals with MCI have a significantly higher number of hyperreflective granular membranes at the peripapillary area covered the RNFL as assessed by adaptive optics scanning laser ophthalmoscopy.S48 The authors speculated that the hyperreflective granular membranes are due to inner retinal gliosis which supports a previously established association between AD and glial cell activation in the brain and retina.S128,S129
Given that the retina is an easily accessible window and connected to the CNS, it is believed that further advance in retinal imaging as well as multimodal, composite biomarkers for AD will be continuously developed.
Artificial intelligence
Another major area of future research in the analysis of retinal images is AI. The current retinal imaging measures (eg, reduction in RNFL thickness) are not necessarily specific to AD and not designed to fully describe and characterise the spectrum of AD-related disorders. Recent developments of AI, particularly in DL, have potential to transform imaging technology in healthcare.S130,S131 DL is based on deep neural networks, involving many layers of linear (convolutional) and non-linear operations trained on previously unfeasible amounts of data.
In retinal imaging, AI and DL technology have been developed in several areas, the two most prominent ones being first, in the assessment of retinal photographs for detection and screening of DR,S132-S137 AMD,S138-S140 glaucoma,S141, S142 and retinopathy of prematurity,S143,S144 and second, the segmentation and assessment of OCT images for diagnosis and screening of major retinal diseases.S145-S148 These studies demonstrate the promise of DL for discovering discriminative latent information associated with AD as well as neurodegenerative disease and cerebrovascular disease from retinal images.S149,S150 For example, using DL, target-specific features are automatically learnt by DL algorithm in the feature extraction stage and numerous unconventional features that are neither noticed by human previously nor examined by appropriate clinical study will also be assessed. DL could be used to recognise specific pattern of retinal changes secondary to AD pathology (ie, ‘retinal fingerprint’ of AD) potentially.
How might AI-based retinal imaging be used potentially? Online supplemental figure 3 shows a proposed pathway of screening AD using retinal imaging. By providing a simple two-tier risk stratification output, this algorithm could assist physicians to identify asymptomatic individuals who are more likely to have AD in the community. The availability of retinal imaging in eye clinics for assessing ocular diseases allows opportunistic screening for AD on a large scale. Introducing retinal imaging in neurology clinics for subjects with memory issues would add a complementary risk profiling tool for assessing the risk of AD. Higher-risk patients could then benefit from subsequent more intensive and specific (but expensive) examinations (eg, PET imaging of CSP analysis for identification of underlying disease pathologies). This would potentially benefit the treatment workflow of AD if a disease-modifying therapy is successfully developed.
Clinical trials and outcome monitoring
While retinal imaging cannot fully replace current tests such as PET imaging or CSF analysis for detecting AD pathology (eg, amyloid-β and tau accumulation), retinal imaging offers several unique advantages over current biomarkers. First, retinal imaging offers lower cost methods to identify appropriate study cohorts (ie, cognitively normal individuals with AD-related retinal characteristics) for recruitment into clinical trials of new treatments for dementia (eg, anti-amyloid therapy to delay cognitive decline). Measurements from retinal imaging (eg, neuronal and vascular changes) may also be used to assess optimal or suboptimal therapeutic response to medical intervention. For example, the ENVIS-ion study, which aims to determine the effectiveness of low-dose aspirin in reducing the development of white matter lesion and silent brain infraction, is also validating retinal vascular changes as potential treatment outcomes.57 In addition, blood-based biomarkers, a less invasive and potentially cheaper approach, are being explored for aiding AD detection at early stage. 58 59,S151-S152 Combining both retinal imaging and blood-based biomarkers (ie, ‘multiple marker approach’) may increase the accuracy to identify appropriate study cohorts for recruitment into the clinical trials, compared with using only a single marker.
Conclusions
There is an increasing body of research using current and emerging retinal imaging technology to study AD. Newer retinal imaging technologies are increasingly available, are non-invasive, and comparatively low cost and easy to use for clinical and population studies. While current research shows promising evidence that many retinal imaging measures show associations with AD, longitudinal studies are lacking and larger replication studies are necessary. A framework for retinal imaging development and validation in AD should be developed and followed by future studies to allow consistent comparison of findings. Newer computational technology, such as AI hold promise to use retinal imaging as a ‘point of care; level test for screening, early risk assessment and stratification.
Ethics statements
Acknowledgments
We would like to acknowledge Dr Victor Chan from the Chinese University of Hong Kong, Hong Kong, China; Dr Saima Hilal from National University of Singapore, Singapore; Dr Narayanaswamy Venketasubramanian from the Raffles Hospital, Singapore; and Dr M. Kamran Ikram from Erasmus Medical Centre, The Netherlands.
References
Supplementary materials
Supplementary Data
This web only file has been produced by the BMJ Publishing Group from an electronic file supplied by the author(s) and has not been edited for content.
Footnotes
Contributors CYC, CPLHC and TYW conceptualised and designed the article. CYC drafted the article. CYC, VM, PJF, ET, CPLHC, TYW and CPLHC were responsible for revising it critically for important intellectual content. All authors approved this version to be published.
Funding CYC has received grant funding from the Health and Medical Research Fund, Hong Kong (Grant Number: 04153506) and Bright Focus Foundation (Reference Number: A2018093S). VM has received grant funding from SEEDS Foundation. PJF has received grant support for this work from The Richard Desmond Charitable Foundation via Fight for Sight, London, UK (Grant code 1965), The International Glaucoma Association, Ashford, UK and The Alcon Research Institute, Fort Worth, Texas, USA. CPLHC has received grant funding from the National Medical Research Council Singapore (NMRC/CG/NUHS/2010 and NMRC/CG/013/2013). ET has received grant funding from the EPSRC (M005976/1) and the NIHR Global Health Research Unit “INSPIRED” (16/136/102). TYW has received grant funding from the National Medical Research Council Singapore (NMRC/STaR/016/2013 and NMRC/OFLCG/001 c/2017) and Duke-NUS Medical School (DUKE-NUS/RSF/2014/0001).
Competing interests None declared.
Provenance and peer review Not commissioned; externally peer reviewed.
Supplemental material This content has been supplied by the author(s). It has not been vetted by BMJ Publishing Group Limited (BMJ) and may not have been peer-reviewed. Any opinions or recommendations discussed are solely those of the author(s) and are not endorsed by BMJ. BMJ disclaims all liability and responsibility arising from any reliance placed on the content. Where the content includes any translated material, BMJ does not warrant the accuracy and reliability of the translations (including but not limited to local regulations, clinical guidelines, terminology, drug names and drug dosages), and is not responsible for any error and/or omissions arising from translation and adaptation or otherwise.