Article Text

Statistics from Altmetric.com
Amyotrophic lateral sclerosis (ALS) is a neurodegenerative disorder characterised by the progressive loss of motor neurons in the brain, the brainstem and the spinal cord.1 This results in progressive muscle weakness and wasting. A repeat expansion in the C9orf72 gene is the most common genetic cause of ALS and frontotemporal dementia, at least in European populations.2 Biomarkers that capture various aspects of the disease are emerging and are becoming an important read-out in clinical studies. Neurofilaments (Nfs) both in cerebrospinal fluid (CSF) and blood have shown to reflect the extent of motor neuron degeneration and to predict survival in patients with ALS (pALS).3 Yet, Nfs do not capture the entire spectrum of the pathology in ALS. Indeed, inflammation is another prominent pathological hallmark in ALS.4 Inflammation, featured by glial cell activation and activation of other cells of the innate and adaptive immune system, is a key component of the non-cell autonomous neurodegeneration in ALS.5 The neuroinflammatory response may initially help to maintain brain homeostasis, but could eventually become a neurotoxic response.4 5 Multiple inflammatory markers have been studied in ALS. We selected three neuroinflammatory markers with a good performance at diagnostic and prognostic level in ALS: chitotriosidase (CHIT1), chitinase-3-like protein 1 (YKL‐40) and monocyte chemoattractant protein (MCP-1).6 CHIT1 is primarily expressed by cells of myeloid lineage and YKL‐40 is produced by reactive astrocytes and microglia.7 8 MCP-1 promotes migration of peripheral immune cells to sites of inflammation and activates microglia towards an activated neurotoxic state.9 The CSF levels of CHIT1, YKL‐40 and MCP-1 are elevated in pALS and can predict a shorter survival.6 The relation, however, between Nfs, including neurofilament light chain (NfL) and phosphorylated neurofilament heavy chain (pNfH), glial markers including CHIT1 and YKL-40, and MCP-1 in pALS in terms of predicting survival is largely unexplored. The primary objective of our study was to investigate the relative contribution of these markers to survival prediction. In addition, we studied their performance to discriminate disease controls and asymptomatic C9orf72 repeat expansion carriers (asymp-C9) from pALS, as well as the correlation between the different biomarkers.
pALS were recruited at two centres. The demographics of the Leuven cohort (LEU), including sporadic ALS (sALS), ALS caused by a C9orf72 repeat expansion (C9-ALS) as well as asymp-C9, are shown in online supplemental table 1. The demographics of the Bethesda cohort (BETH), including C9-ALS, FTD-C9 and asymp-C9, are provided in online supplemental table 2. The BETH was used to test the cut-offs determined in the LEU on an independent cohort of C9 carriers. Lastly, disease controls were recruited at Leuven (online supplemental table 3).
Supplemental material
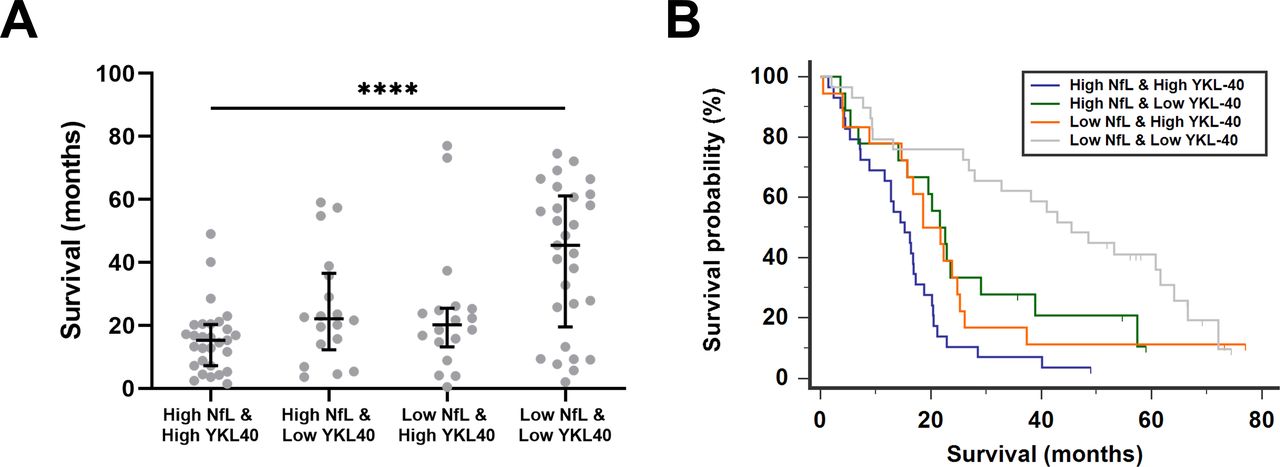
We first performed survival analyses. A univariate survival analysis confirmed that each marker predicted survival separately (online supplemental table 4). Nfs, glial markers and MCP-1 were next analysed in a multivariate model for survival in ALS. For this analysis, all five biomarkers of LEU-pALS were included in a Cox regression analysis and a stepwise backward method was applied. NfL and YKL-40 came out as the significantly independent predictors of survival in pALS (online supplemental table 5). Next, all LEU-pALS were classified into four groups based on the biomarker profile of NfL and YKL-40. For this purpose, LEU-pALS were dichotomised for each biomarker into two subcohorts with either low or high biomarker concentration based on the median of the given biomarker in the entire cohort (for NfL=7922 pg/mL, for YKL-40=329 ng/mL). Survival was significantly shorter in patients with both increased NfL and YKL-40 levels compared with patients with low NfL and YKL-40 levels (figure 1A). A Kaplan-Meier survival analysis including these four groups confirmed these findings (χ²=23.43, p<0.0001) (figure 1B). Similar results were found when pNfH was combined with YKL-40 (online supplemental figure 1). These data indicate that combinations of biomarkers reflecting several key pathological hallmarks may be used, based on their median values, to identify patient subgroups with different survival profiles.
Combination of NfL and YKL-40 levels to predict survival in patients with amyotrophic lateral sclerosis. Scatter plot of survival in patients with amyotrophic lateral sclerosis (ALS) based on the biomarker profile of neurofilament light (NfL) and chitinase‐3-like protein 1 (YKL‐40) levels in cerebrospinal fluid (CSF) (A). Patients with ALS were classified as high and low according to the median concentration of the specific biomarker. Kruskal-Wallis test with Dunn’s post hoc test, ****p<0.0001. Kaplan-Meier survival curves of patients with ALS classified according to the biomarker profile (B).
To further explore the relation of these biomarkers in terms of predicting survival, we incorporated these biomarkers in a model containing eight established prognostic factors (bulbar vs non-bulbar onset, age at onset, presence of definite ALS, diagnostic delay, forced vital capacity, progression rate, frontotemporal dementia (FTD) and presence of a C9orf72 repeat expansion).10 When included in this model, increased levels (ie, levels above the median of the given biomarker in the entire LEU-pALS) were independently associated with a shorter survival for each biomarker (online supplemental table 6).
Finally, we looked at the discriminatory performance of the Nfs, CHIT1, YKL-40 and MCP-1 and the degree of correlation between the different markers. All markers were elevated in all LEU-pALS, but not in LEU-asymp-C9 (online supplemental figure 2). Median levels in LEU- C9-ALS were similar in LEU-sALS. Nfs, CHIT1, YKL-40 and MCP-1 levels were not associated with the site of onset (bulbar vs spinal) or the initial motor neuron phenotype (lower motor neuron-predominant vs classic ALS). Of all biomarkers, we found that Nfs showed the highest sensitivity and specificity for discriminating ALS-C9-ALS from asymp-C9 (online supplemental table 7). Other approaches to calculate a cut-off to discriminate asymp-C9 from ALS-C9 were investigated and subsequently applied to the BETH (online supplemental table 8). We selected the 99% CI as cut-off for all five markers which yielded the highest sensitivity compared with the other tested methods. Cohen’s kappa, an estimate of classification agreement when applying the LEU derived cut-off on the BETH, showed that Nfs yielded the most performant, that is, substantial agreement, whereas for the neuroinflammatory markers the agreement was poor (CHIT) to moderate (YKL-40, MCP-1) (online supplemental table 9).
A correlation matrix for the different biomarkers was created for LEU-pALS (online supplemental figure 3). The strongest correlation was found between Nfs. Of the different neuroinflammatory markers, CHIT1 displayed the strongest correlation with Nfs. Across pALS, a weak correlation was found between the disease progression rate and the different markers, reaching significance only for CHIT1 (online supplemental figure 4). For 83 pALS, a second ALS Functional Rating Scale Revised (ALSFRS-R) score was obtained with a median time of 3.5 months after the first ALSFRS-R score. The slope of the ALSFRS-R score correlated significantly with Nfs levels in CSF, but not with the inflammatory markers (online supplemental figure 4).
In comparison with sALS, our study could not replicate the elevated Nfs levels in C9orf72 ALS, most likely due to the relatively small C9-ALS sample size. Other study limitations include the retrospective design of the study and the fact that the polymorphism in CHIT1 was not measured. In conclusion, although CHIT1 levels correlated better with Nfs, YKL-40 had the most pronounced added value to Nfs to predict survival of pALS. This highlights the importance of combining different biomarkers to predict survival in pALS. Further we showed that Nfs yielded better classification agreement than neuroinflammatory markers across independent cohorts in separating C9-ALS and asympt-C9. Multicentre studies are required to validate our findings and to better understand the role of the neuroinflammatory markers in ALS.
Ethics statements
Patient consent for publication
Ethics approval
This study involves human participants and was approved by The University Hospitals Leuven Institutional Review Board (S51125, S58248 and S60768). The Bethesda cohort was collected at NIH Clinical Center, Bethesda, Maryland (NCT01925196). Participants gave informed consent to participate in the study before taking part.
Acknowledgments
We are thankful to all participants and their relatives for their invaluable contributions to this research.
Supplementary materials
Supplementary Data
This web only file has been produced by the BMJ Publishing Group from an electronic file supplied by the author(s) and has not been edited for content.
Footnotes
Twitter @JokeDeV, @KoenP4
Contributors PM, MDS, KP, PvD contributed to concept and design. PM, MDS contributed to drafting of the manuscript and figures. PM, MDS, MKF, JDV, NL, ADH, BT, KP, PvD contributed to collecting CSV samples. PM, MDS, BT, KP, PvD contributed to analysis or interpretation of data. PM, MDS, MKF, JDV, NL, ADH, BT, KP, PvD contributed to critical revision of the manuscript for important intellectual content. PM and MDS are joint first authors. KP and PvD are joint last authors.
Funding PM has a research Fellowship of the European Academy of Neurology (no award/grant number). MDS has a PhD Fellowship of the Research Foundation—Flanders (11E6319N). JDV is funded by the Klinische onderzoeks-en opleidingsraad (KOOR) of the University Hospitals Leuven (no award/grant number). KP is a senior clinical investigator of the Flemish Fund for Scientific Research (18B2622N) (FWO, Fonds voor Wetenschappelijk Onderzoek Flanders, Belgium) and holds a Clinical Research fund of the University Hospitals Leuven (no award/grant number). PvD is a senior clinical investigator of the Flemish Fund for Scientific Research (FWO, Fonds voor Wetenschappelijk Onderzoek Flanders, Belgium) and is supported by the ALS Liga België and the KU Leuven funds ‘Een Hart voor ALS’, ‘Laeversfonds voor ALS Onderzoek’ and ‘the Valéry Perrier Race against ALS fund’ (no award/grant number). This work was supported in part by FWO-Vlaanderen (T003519N), the Intramural Research Programs of the NIH, National Institute on Aging (Z01-AG000949-02) and the National Institute of Neurological Disorders and Stroke.
Competing interests None declared.
Provenance and peer review Not commissioned; externally peer reviewed.
Supplemental material This content has been supplied by the author(s). It has not been vetted by BMJ Publishing Group Limited (BMJ) and may not have been peer-reviewed. Any opinions or recommendations discussed are solely those of the author(s) and are not endorsed by BMJ. BMJ disclaims all liability and responsibility arising from any reliance placed on the content. Where the content includes any translated material, BMJ does not warrant the accuracy and reliability of the translations (including but not limited to local regulations, clinical guidelines, terminology, drug names and drug dosages), and is not responsible for any error and/or omissions arising from translation and adaptation or otherwise.