Article Text

Abstract
Background The predictive value of serum neurofilament light chain (sNfL) on long-term prognosis in multiple sclerosis (MS) is still unclear.
Objective Investigate the relation between sNfL levels over a 2-year period in patients with relapsing-remitting MS, and clinical disability and grey matter (GM) atrophy after 10 years.
Methods 85 patients, originally enrolled in a multicentre, randomised trial of ω−3 fatty acids, participated in a 10-year follow-up visit. sNfL levels were measured by Simoa quarterly until month 12, and then at month 24. The appearance of new gadolinium-enhancing (Gd+) lesions was assessed monthly between baseline and month 9, and then at months 12 and 24. At the 10-year follow-up visit, brain atrophy measures were obtained using FreeSurfer.
Results Higher mean sNfL levels during early periods of active inflammation (Gd+ lesions present or recently present) predicted lower total (β=−0.399, p=0.040) and deep (β=−0.556, p=0.010) GM volume, lower mean cortical thickness (β=−0.581, p=0.010) and higher T2 lesion count (β=0.498, p=0.018). Of the clinical outcomes, higher inflammatory sNfL levels were associated with higher disability measured by the dominant hand Nine-Hole Peg Test (β=0.593, p=0.004). Mean sNfL levels during periods of remission (no Gd+ lesions present or recently present) did not predict GM atrophy or disability progression.
Conclusion Higher sNfL levels during periods of active inflammation predicted more GM atrophy and specific aspects of clinical disability 10 years later. The findings suggest that subsequent long-term GM atrophy is mainly due to neuroaxonal degradation within new lesions.
- MULTIPLE SCLEROSIS
- CLINICAL NEUROLOGY
- BIOCHEMISTRY
- MRI
Data availability statement
Data are available upon reasonable request.
This is an open access article distributed in accordance with the Creative Commons Attribution 4.0 Unported (CC BY 4.0) license, which permits others to copy, redistribute, remix, transform and build upon this work for any purpose, provided the original work is properly cited, a link to the licence is given, and indication of whether changes were made. See: https://creativecommons.org/licenses/by/4.0/.
Statistics from Altmetric.com
WHAT IS ALREADY KNOWN ON THIS TOPIC
There is increasing evidence to support the use of serum neurofilament light chain (sNfL), as a marker of acute inflammatory axonal damage, to monitor short-term disease activity, treatment response and disability progression in multiple sclerosis (MS). However, whether sNfL levels also predict disease progression and neurodegeneration over several years, and even decades, is less clear.
WHAT THIS STUDY ADDS
We found that higher sNfL levels measured during periods of active inflammation predicted lower total grey matter (GM) volume, deep GM volume and cortical thickness and higher T2 lesion count after 10 years in patients with relapsing-remitting MS (RRMS). Higher sNfL levels were also associated with higher disability measured by the dominant hand Nine-Hole Peg Test.
HOW THIS STUDY MIGHT AFFECT RESEARCH, PRACTICE AND/OR POLICY
As long-term atrophy progression in patients with RRMS seems to be driven by focal inflammatory damage, measuring sNfL levels during relapses may be a way to quantify the extent of ongoing axonal injury, possibly indicating the risk of future disease progression. This added information may support clinicians in subsequent monitoring and treatment decisions.
Introduction
The pathological mechanisms in multiple sclerosis (MS) are highly complex, affecting both white matter (WM) and grey matter (GM) structures throughout the central nervous system.1 Inflammatory and neurodegenerative processes both seem to play a role in disease progression and disability accumulation,2–4 but there is large variability between patients and disease phenotypes.4 This pathophysiological and clinical heterogeneity underlines the need for robust biomarkers predicting future clinical disability. At the same time, this heterogeneity poses a challenge in developing such markers, as they should reliably capture and differentiate the various ongoing disease processes.5
Neurofilaments are proposed candidate biomarkers, reflecting axonal injury.6 These proteins are major components of the axonal cytoskeleton and are released into the extracellular fluid when neuroaxonal damage occurs.6 The neurofilament protein consists of multiple, differently sized subunits, of which the neurofilament light chain (NfL) assay is the most widely researched.7 NfL levels can be determined in blood serum or plasma, and serum NfL (sNfL) levels strongly correlate with CSF NfL levels.8 The suggested dynamic equilibrium between the two body fluids makes NfL a candidate biomarker, because reliable measurements can be obtained by venepuncture, rather than the more invasive lumbar puncture.
Elevated sNfL levels have been shown to reflect acute axonal damage during active inflammation,9 and increasing evidence support the use of sNfL to monitor short-term disease activity, treatment response and disability progression.10 Whether sNfL levels also predict disease progression and neurodegeneration over several years, and even decades, is less clear.6 10–12 Associations between sNfL and long-term disability progression are not consistent,13 14 and although some studies have found higher sNfL levels to be associated with brain13 15 16 and GM atrophy,17–19 studies with extensive follow-up time are few, especially studies considering GM atrophy.17 19 Clarifying the properties of NfL as a predictor of long-term neurodegeneration is further complicated by the dynamic nature of MS pathophysiological processes: elevated NfL levels during periods with active inflammation mainly reflect the extent of ongoing acute axonal damage, rather than any simultaneous neurodegenerative processes.20 Furthermore, inflammatory activity and axonal damage persist several months after the appearance of a gadolinium-enhancing (Gd+) lesion, causing a prolonged elevation of the NfL level.9 If and how this variability affects the relation between NfL levels and long-term future disability and brain atrophy is not clear.12 17 As one patient with relapsing-remitting MS (RRMS) may experience periods of both remission and active inflammation, attempts to separate and explore the predictive value of sNfL levels during these periods may clarify pathophysiological disease mechanisms, and be of clinical relevance (eg, deciding optimal timepoints for sNfL measurements). By separately analysing sNfL levels obtained during, and outside of episodes of evident inflammatory activity (ie, Gd+ lesions) over a 2-year period, the present study aims to investigate how periods of acute disease activity compare to more silent periods in RRMS in predicting clinical disability and GM atrophy, measured after 10 years.
Materials and methods
Participants
The included patients originally participated in a multicentre trial of ω−3 fatty acids in MS (the OFAMS Study), which has previously been described in detail.21
In the trial, 92 patients with RRMS were followed over 24 months, for the first 6 months randomised to either ω−3 fatty acids monotherapy or placebo. Starting at 6 months, both treatment groups received additional treatment with subcutaneously administered interferon beta-1a, 44 µg, three times weekly for the remaining 18 months of the trial. Patients attended regular follow-up visits for biochemical, radiological and clinical examinations, including the Expanded Disability Status Scale (EDSS), timed 25-foot walk test (T25FW), the dominant and non-dominant hand Nine-Hole Peg Test (D9-HPT and ND9-HPT) and the Paced Auditory Serial Addition Test (PASAT). All available patients in the OFAMS Study were invited to a 10-year follow-up visit, of which 85 (92%) accepted.22 All biochemical, radiological and clinical examinations from the OFAMS Study were repeated at their local study site, with the addition of the oral Symbol Digit Modalities Test (SDMT). Between the OFAMS Study and the 10-year follow-up visit, the participants had received treatment and monitoring as advised by their treating neurologist as part of routine care.
Serum sampling and analysis
Serum samples collected during the OFAMS Study were stored at −80°C. As previously described,23 sNfL levels were measured in duplicates, from samples collected at baseline (BL) and at months 3, 6, 9, 12 and 24, using a Simoa assay and according to the manufacturer’s instruction (Quanterix, Billerica, USA).
MRI data and analysis
The OFAMS Study
During the trial, patients underwent MRI imaging at BL, monthly for the first 9 months, and thereafter at month 12 and 24. MRI was performed at each study site using a 1.5 Tesla (T) MRI scanner with the standard head coil. After intravenous injection of gadolinium-based contrast agent, the imaging protocol included a 2D sagittal fluid-attenuated inversion recovery (FLAIR) (resolution: 0.98×0.98×1 mm3, echo time (TE)/repetition time (TR)=100/6000–10000 ms, number of excitations (NEX) 2, slice thickness 4 mm), 2D axial T1-weighted images (resolution: 0.49×0.49×1 mm3, TE/TR=10–20/500-750 ms, NEX 2, slice thickness 4 mm) as well as sagittal 3D T1-weighted spoiled gradient echo (Fast Field Echo (FFE)/Fast Low Angle Shot (FLASH)) images (resolution: 0.98×0.98×1 mm3, TE/TR=4.6/20 ms, flip angle 25°, NEX 1, slice thickness 1 mm).
Blinded assessment of the T2 and Gd+ lesion count (LC) at BL, and the appearance of new Gd+ lesions was conducted by two experienced neuroradiologists.
The 10-year follow-up visit
Imaging was performed at the different study sites, on a 3T MRI scanner if available, alternatively using a 1.5 T MRI scanner, with a standard head coil. The following MRI sequences were acquired: a T2-weighted 3D sagittal FLAIR (resolution: 1×1×1 mm3, TE/TR/inversion time (TI)=386/5000/1.65–2.2 ms) and a postcontrast T1-weighted 3D sagittal magnetization prepared rapid gradient echo sequence (resolution: 1×1×1 mm3, TE/TR/TI=2.28/1800/900 ms, flip angle 8°).
Lesion segmentation and morphological reconstruction
A detailed description of these methods has recently been described24 and is available in online supplemental appendix 1. Briefly, on images obtained at the 10-year follow-up visit, lesion segmentation was done on FLAIR images using Lesion Segmentation Tool (V.2.0.15; http://applied-statistics.de/lst.html),25 and morphological reconstruction was performed with FreeSurfer (V.7.1.1; http://surfer.nmr.mgh.harvard.edu/) on T1-weighted images.
Supplemental material
Calculation of sNfL levels
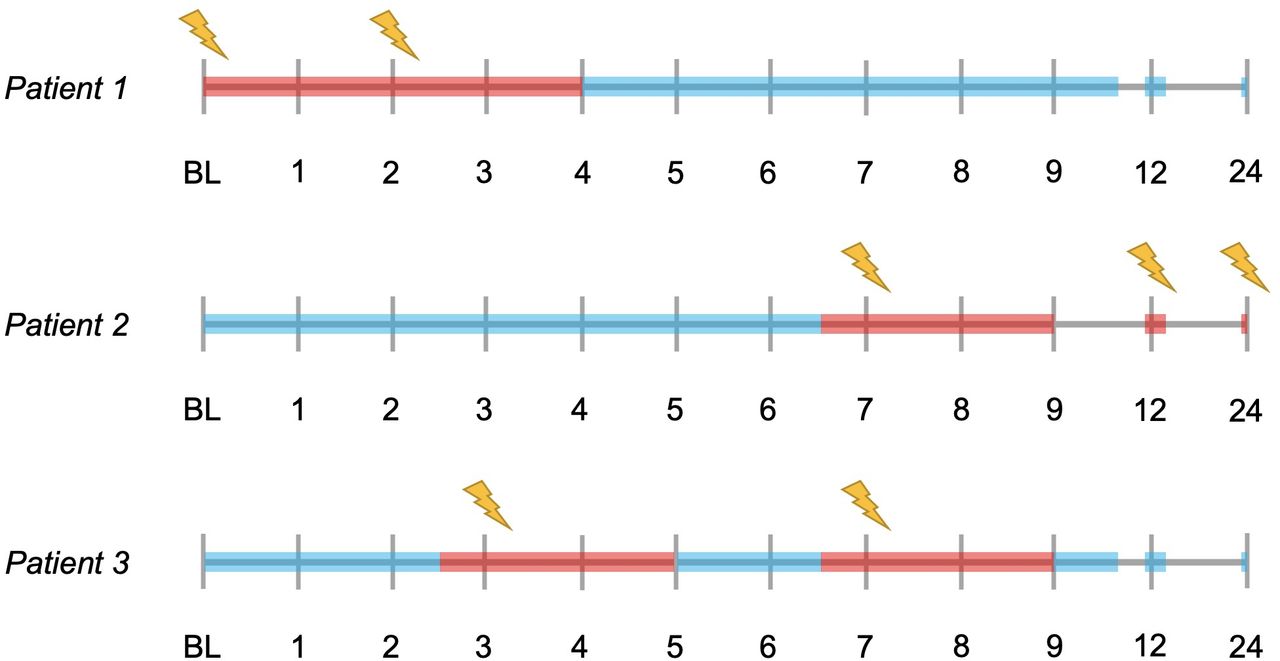
Mean sNfL levels were calculated, for each patient, for three different settings: ‘overall mean sNfL level’, from all samples collected between BL and month 24; ‘mean inflammatory sNfL level’, from samples collected within 2 months after the presence of a Gd+ lesion, or less than 2 weeks before the appearance of a Gd+ lesion (if collected more than 1 week after last MRI scan); and ‘mean non-inflammatory sNfL level’, from samples collected more than 2 months after the appearance of a Gd+ lesion and more than 2 weeks before the appearance of a new Gd+ lesion (if collected more than 1 week after last MRI scan). Examples of sNfL measurements defined as inflammatory and non-inflammatory are visualised in figure 1. In each patient, the mean inflammatory and non-inflammatory sNfL level was calculated separately for (1) at least two and (2) at least three measurements, when available. Measurements defined as inflammatory or non-inflammatory did not have to be collected at consecutive timepoints. The findings presented here were obtained using the mean of at least three measurements, highly comparable findings using the mean of at least two measurements are presented in the online supplemental tables 1 and 2.
Supplemental material

Illustrated examples of time periods where the collected serum neurofilament light chain (sNfL) levels are defined as ‘inflammatory’ or ‘non-inflammatory’. The timelines represent the MRI visits during the OFAMS Study; visits with a new gadolinium-enhancing lesion are marked with a lightning symbol. sNfL levels collected during periods marked in red are defined as inflammatory and levels collected during periods marked in blue are defined as non-inflammatory. With sNfL levels collected approximately at baseline, month 3, 6, 9, 12 and 24; patient 1 has two inflammatory (included in the analysis requiring at least two measurements, excluded from the analysis requiring at least three measurements) and four non-inflammatory sNfL levels (included in both analyses); patient 2 has three inflammatory (included in both analyses) and three non-inflammatory sNfL levels (included in both analyses); and patient 3 has two inflammatory (included in one analysis) and four non-inflammatory (included in both analyses) sNfL levels.
Statistical analysis
Statistical analyses were performed using R software (V.4.0.5). Thalamus volume and mean cortical thickness in the left and right hemisphere were averaged.
To correct for the different study sites and scanner variability, the relationship between overall mean sNfL level and clinical and MRI atrophy measures was investigated by a linear multilevel regression model, corrected for age, sex, disease modifying therapy (DMT) use, estimated total intracranial volume (eTIV) (eTIV only included in analyses regarding MRI volume measures), fraction of MRI scans with new Gd+ lesions (fGd+), BL T2 and Gd+ LC, with study site entered as a random effect.
Between the OFAMS Study and the 10-year follow-up visit, patients underwent therapeutic interventions that varied both between and within patients, in potency, duration and time. A nominal variable was created based on the category (similar to those proposed in a recent study26) of DMT(s) used during the follow-up: (1) only used platform compounds (interferon beta and glatiramer acetate preparations), (2) ever used oral therapies (teriflunomide, dimethyl fumarate, fingolimod) and (3) ever used high efficiency monoclonal antibody therapies, chemotherapies or haematopoietic stem cell therapy.
For the relation between mean inflammatory and non-inflammatory sNfL levels and clinical and MRI atrophy measures, linear regression models were used, as entering the study site as a random effect did not improve the model. The first model (model 1) included mean inflammatory sNfL level, fGd+, age, sex, DMT use, eTIV, BL T2 and Gd+ LC as independent variables; the second model (model 2) included non-inflammatory sNfL level, age, sex, DMT use, eTIV, BL T2 and Gd+ LC. Lastly, a modified version of model 1 was used in two exploratory analyses: the first with the mean cortical thickness in the precentral gyrus as the dependent variable, and the second including MRI atrophy measures obtained at month 24 (available in a subset of patients) as a covariate. All independent variables were first entered as covariates and removed by backward elimination if not significant to the model. In case of missing observations, patients were excluded from the respective analyses. Assumptions for linear regression were checked for each final model; if the assumptions were not satisfied, log-linear transformation was performed (eg, logT25FW). The outcome measure EDSS≥4 was investigated by logistic regression. Lastly, the Benjamini-Hochberg method27 was used to control the false discovery rate (FDR) for multiple hypothesis testing. FDR controlling was performed for the main predictors (overall sNfL, inflammatory sNfL, non-inflammatory sNfL and fGd+) separately, including analyses with both MRI and clinical outcome measures.
Results
Patient characteristics
Of the 85 patients who participated in the 10-year follow-up visit, 78 had serum samples available for sNfL measurement and were included in this study. The mean follow-up time from BL to the 10-year follow-up visit was 12.0 years (±0.6). Table 1 summarises clinical and MRI characteristics of the included patients.
Demographic, clinical and radiological characteristics
Overall mean sNfL level
Overall mean sNfL level did not predict any long-term MRI or clinical outcome measures, or change in clinical measures from month 24 to the 10-year follow-up (table 2).
The association of overall mean sNfL level with MRI atrophy and clinical measures at the 10-year follow-up, with a random intercept for study site, corrected for age, sex, DMT use, eTIV, BL T2LC, BL Gd+ LC and fGd+
Mean inflammatory sNfL level
The results of the linear regression model including inflammatory sNfL and fGd+ as predictor variables (model 1) are shown in table 3.
Model 1: The association of inflammatory sNfL level and fGd+ with MRI atrophy and clinical measures at the 10-year follow-up, corrected for age, sex, DMT use, eTIV, BL T2LC and Gd+ LC*
Higher mean inflammatory sNfL level predicted lower total GM (standardised β=−0.399, p=0.040) and deep GM (standardised β=−0.556, p=0.010) volume, lower mean cortical thickness (standardised β=−0.581, p=0.010) and higher logT2LC (standardised β=0.498, p=0.018) (figure 2). Of all the clinical outcomes, higher mean inflammatory sNfL level was associated with a higher score (higher disability) on the logD9-HPT (standardised β=0.593, p=0.004) and a lower increase (less disability accumulation) in the logND9-HPT score (standardised β=−0.498, p=0.024) between month 24 and the 10-year follow-up.

Scatterplots illustrating significant associations between mean inflammatory sNfL level (pg/mL) and (A) total GM volume (mm3), (B) mean cortical thickness (mm), (C) total deep GM volume (mm3) and (D) total T2 lesion count (N). The Y-axis is transformed to logarithmic scale to illustrate the absolute lesion count. Cth, cortical thickness; GM, grey matter; sNfL, serum neurofilament light chain.
Fraction of active MRI scans was not a significant predictor in any of the models (table 3).
Exploratory analyses
In a subset of patients, inflammatory sNfL levels were not associated with any MRI measurement obtained at the 10-year follow-up, after correcting for MRI atrophy measurements obtained at month 24 (online supplemental table 3).
Higher mean inflammatory sNfL levels and D9-HPT scores, but not ND9-HPT scores, were significantly associated with lower cortical thickness in the left and right precentral gyrus (online supplemental table 4).
Mean non-inflammatory sNfL level
The effect of mean non-inflammatory sNfL level on MRI and clinical measures at the 10-year follow-up is shown in table 4. The mean non-inflammatory sNfL level was not associated with any of the MRI measures. For the clinical measures, higher levels were solely associated with a higher SDMT score (better attention score) at the 10-year follow-up (standardised β=0.473, p=0.003).
Model 2: The association of mean non-inflammatory sNfL level with MRI atrophy and clinical measures at the 10-year follow-up, corrected for age, sex, DMT use, eTIV, BL T2LC and BL Gd+ LC*
Discussion
We found that higher mean sNfL level, measured over a 2-year period in patients with RRMS, was not associated with MRI or clinical measures after 10 years. However, when separately assessing mean sNfL levels measured during periods of active inflammation, higher levels associated significantly with lower total GM and deep GM volume, lower cortical thickness, higher T2 LC and higher disability measured by the D9-HPT. Lastly, sNfL levels during remission were not associated with long-term atrophy or disability progression. These findings suggest that sNfL levels during active inflammation may better predict atrophy and disability progression than overall mean sNfL and sNfL levels during remission.
Inflammatory sNfL levels were analysed in samples collected during periods with focal active inflammation, reflecting the extent of acute axonal damage.9 The association with GM atrophy measured after 10 years, implies that the delayed neurodegeneration in certain GM regions is at least partly secondary to focal inflammatory damage, most likely through anterograde or retrograde neuroaxonal degeneration along WM tracts.28 An alternative hypothesis could be that the association is based on pseudoatrophy following resolved inflammatory activity, but as pseudoatrophy is shown to mainly affect the WM,29 this seems less plausible. Elevated NfL levels predicting secondary neurodegeneration have been suggested in previous works,17 30 finding an association between higher sNfL levels and atrophy progression in deep GM over a 5-year17 and 6-year19 follow-up period. Our study supports this further, by assessing inflammatory sNfL levels separately and finding that the associated GM atrophy was located in deep GM and the cerebral cortex, areas known to be highly interconnected through various WM circuits,31 32 therefore susceptible to degradation.33 34 When correcting for MRI atrophy measures at month 24, associations with inflammatory sNfL levels were no longer significant. This may imply that the atrophy progression develops relatively early in the disease course. However, this exploratory analysis was conducted in only a subset of patients, and should in future works be repeated in larger cohorts.
We found that higher sNfL levels were associated with a higher score (higher disability) on the logD9-HPT. This result is partly in line with a previous study, showing that the patient group with prominent spinothalamic atrophy progression had higher sNfL levels and developed motor disability faster than the groups with atrophy progression in other regions.19 The difference between groups was most evident when assessing walking speed (T25FW) and finger dexterity (9-HPT).19 Hypothetically, the associated disability progression may result from acute disruption of crucial WM tracts (ie, the corticospinal tract) and secondary upstream neurodegeneration in connected GM areas (ie, the primary motor cortex).34 In our study, higher inflammatory sNfL levels were also associated with a lower change (less disability accumulation) in the logND9-HPT. While this finding does not coincide with the suggested hypothesis, the analysis may have been influenced by statistical power-issues and outliers. Furthermore, in an exploratory analysis (online supplemental table 4), lower cortical thickness in the precentral gyri was associated with both higher inflammatory sNfL levels and higher disability measured by the D9-HPT, but not by the ND9-HPT.
We found no associations between sNfL levels and EDSS. In previous research, the relation between sNfL and EDSS progression over 10 years or more is variable,13 14 16 suggested to be influenced by the difference in disease severity between cohorts.10 Our study of a limited number of patients, with relatively low overall disability progression (namely: up to EDSS 2.8), may be affected by the known low sensitivity to change in EDSS,35 especially for lower scores.
A higher fraction of MRI scans with new Gd+ lesions was not a significant predictor in any of the models. Compared with the results seen for inflammatory sNfL, this lack of significant associations may be due to the less sensitive fractional measure used, based on dichotomised values. Nevertheless, the discrepant results for the two predictors may also mean that future neurodegeneration and disability depend on the extent of axonal damage and location of an episode with a new Gd+ lesion(s), more than the frequency of such episodes.
Except for a positive relationship between non-inflammatory sNfL level and oral SDMT, none of the models for this predictor were significant. This may be influenced by statistical power issues and outliers, as the sample size was small (40 patients), with small overall variability in sNfL levels. As only patients with at least three samplings of non-inflammatory sNfL levels available were included, analyses may also be subject to selection bias, selecting patients with an overall less active disease course (none of the patients had at least three non-inflammatory and inflammatory measurements available). However, repeating the analyses including patients with a minimum of two non-inflammatory sNfL levels, and subsequently patients with periods of both remission and active disease (35 patients), yielded the same results. The results are also in line with a recent study finding no association between NfL level and disease progression in natalizumab-treated patients, after correcting for MRI activity.12 From these findings, the authors hypothesised that the sensitivity of NfL is too low to capture more subtle neuroaxonal damage not associated with active inflammation.
The findings in our study may have clinical relevance. Long-term outcomes were independently predicted by sNfL levels during inflammatory episodes, and not by the frequency of such episodes during the first 2 years. Hence, measuring sNfL levels during relapses may be a way to quantify the extent of ongoing axonal damage, possibly indicating the risk of permanent disability, either caused by direct axonal damage during active inflammation, or by the delayed secondary neurodegenerative process affecting GM in connected regions. This added information may support clinicians in subsequent monitoring and treatment decisions. Furthermore, the addition of sNfL to treatment response scoring tools36 37 could possibly increase their predictive value, and should be assessed in future studies.
Correcting for DMT use did not change the associations between sNfL levels and long-term outcomes. However, use of high efficiency therapies (indicating disease activity) over the follow-up was independently associated with disability accumulation measured by the 9-HPT (results not shown). As patients were treated similarly until the conclusion of the OFAMS Study (first treatment naïve, then treated with interferons), this suggests that potent treatment during the first years after diagnosis is important for long-term prognosis, especially in patients with high disease activity.
This study has limitations, the main challenges and suggestions for future research are summarised in table 5. There is a degree of uncertainty in defining sNfL levels as ‘inflammatory’ or ‘non-inflammatory’. Regarding different lesion types, we focused on their relation with Gd+ lesions, as these are strongly associated with active inflammation and NfL release,10 and can be temporally identified with great certainty. However, at BL, month 12 and 24, there was no MRI scan available from the previous months to decide on recent inflammatory activity, and spinal lesions were not accounted for. After a Gd+ lesion, increased sNfL levels may persist for up to 90 days,9 and a previous study on this patient cohort found elevated sNfL levels up to 1 month before and 2 months after the appearance of Gd+ lesions,23 indicating that the windows for defining a sNfL measurement as inflammatory or non-inflammatory in the current study may be too narrow and too wide, respectively. Non-inflammatory measurements are at highest risk of misclassification, ideally collected with a wider interval between new lesions, to ensure the levels are not influenced by inflammatory damage. These considerations underline the need to clarify the relationship between the temporal dynamics of NfL levels and the evolution of lesions. With the available data in this cohort, our definitions were set to maximise the contrast between inflammatory and non-inflammatory periods, while still maintaining an acceptable group size. Despite these uncertainties, the associations with long-term outcomes found in this study were clearly different between the two measurements, substantiating the sensitivity of the set definitions. Moreover, the patterns of significant associations were similar when analysing mean inflammatory and non-inflammatory sNfL levels calculated from only two or more measurements, also including patients (35 patients) with both inflammatory and non-inflammatory sNfL levels during the 2-year follow-up.
Current research challenges and suggestions for future research
GM volumes were measured cross-sectionally from data collected at the 10-year follow-up visit and month 24, limiting our ability to conclude on longitudinal atrophy progression. When correcting for atrophy measures obtained at month 24, the associations with GM atrophy after 10 years were no longer significant. This analysis may have been underpowered due to the small sample size, so further investigations in larger patient populations, with regular and more frequent follow-up visits, may clarify the temporal relation between inflammatory WM damage, sNfL levels and GM atrophy. Additionally, future studies should consider the effect of lesion volume and lesion volume change, preferably over longer time periods. In this study, we corrected for Gd+ and T2 LC at BL, as we deemed BL volume measures too unreliable to include, due to the quality of the MRI data (eg, partial brain coverage, large slice thickness, 2D images).
Lastly, atrophy measurements were obtained from postcontrast images, which is not the standard approach for FreeSurfer. However, recent work has shown excellent consistency between values obtained from precontrast and postcontrast images.24
Conclusion
Higher sNfL levels during early periods of active inflammation, but probably not during remission, in patients with RRMS predicted GM atrophy and specific aspects of clinical disability 10 years later. The findings suggest that subsequent long-term GM atrophy is mainly due to neuroaxonal degradation induced by acute inflammation.
Data availability statement
Data are available upon reasonable request.
Ethics statements
Patient consent for publication
Ethics approval
This study involves human participants and was approved by Regional Committee for Medical and Health Research Ethics in Western Norway Regional Health Authority (OFAMS Study: clinical trials.gov, Identifier: NCT00360906). Participants gave informed consent to participate in the study before taking part.
Acknowledgments
The authors thank the OFAMS Study group and the patients who participated in the study.
References
Supplementary materials
Supplementary Data
This web only file has been produced by the BMJ Publishing Group from an electronic file supplied by the author(s) and has not been edited for content.
Footnotes
Contributors Conception or design of the work: IAL, CET and HV. Data acquisition: IAL, KW, IB, SSK, SW, TH, RM, AB, RE, SG, HFH, GK, YSS, NØ, KNV, CAV, ØT, KMM and HV. Analysis and interpretation of data: IAL, SK, FB, CET, LB, ØTT, KMM and HV. Drafting the work: IAL and HV. Revising the work for valuable intellectual content and final approval of the version: IAL, SK, KW, IB, SSK, SW, TH, RM, AB, RE, SG, HFH, GK, YSS, NØ, KNV, CAV, FB, CET, LB, ØT, K-MM and HV. Authors responsible for the overall content as guarantors: IAL and HV.
Funding This study received no specific funding. The OFAMS baseline study has been funded by Pronova Biocare; Amersham Health, Norway; Merck Serono, Norway; the Western Norway Regional Health Authority; and Norwegian Multiple Sclerosis Society (no award/grant number). The OFAMS follow-up study has received unrestricted research grants from Novartis and The Independent order of Odd Fellows; has been funded by the Western Norway Regional Health Authority (grant number 912020); and has been financial supported by Neuro-SysMed (Center of excellence for clinical treatment research) hosted by Haukeland University Hospital and funded by grants from the Research Council of Norway (grant number 288164). The MS Center Amsterdam is funded through a program grant of the Dutch MS Research Foundation (grant no. MS 18-358f). IB has been supported by the Dutch MS Research Foundation (no award/grant number). FB is supported by the National Institute for Health Research (NIHR) biomedical research centre at University College London Hospitals NHS Foundation Trust (UCLH) (no award/grant number). ØT and K-MM are funded by Neuro-SysMed at Haukeland University Hospital and University of Bergen by grant from the Research Council of Norway (grant number 288164).
Competing interests The authors of this manuscript declare no relationships with any companies, whose products or services may be related to the subject matter of the article. AB, SG, GK, YSS, KNV and CAV declares no disclosures relevant to the manuscript. IAL has received research grants from the Meltzer Research Fund, Gerda Meyer Nyquist Guldbrandson & Gert Meyer Nyquists Legat and the Independent Order of Odd Fellows. KW has received unrestricted research grants from Novartis and Biogen, research grant from the Independent Order of Odd Fellows and speaker honoraria from Biogen. IB has received research support from Merck KGaA, Novartis, and Teva. SW has received speaker honoraria from and served on scientific advisory boards for Biogen, Janssen-Cilag, Sanofi and Novartis. SSK received unrestricted research grants from Novartis, Biogen. TH has received speaker honoraria, research support/grants and participated in clinical trials for Biogen, Merck, Sanofi, Bristol Myers Squibb, Roche and Novartis, is member of the scientific board of the Norwegian MS society, and has received financial support from the Research Council of Norway (grant #250864). RM has served on scientific advisory boards for Novartis Norway and Merck and received travel funding and/or speaker honoraria from Biogen, Novartis and Sanofi Genzyme. AE has received speaker honoraria from Biogen, Merck, Sanofi and Novartis. RE has received speaker honoraria from Novartis. HFH has received speaker honoraria from Biogen, Sanofi-Aventis, Merck, Novartis, and Roche. NØ has received speaker honoraria from Biogen, participated in clinical trials for Biogen and Sanofi-Aventis, and has served on a scientific advisory board for Novartis. FB has received compensation for steering/safety committee, activities and consulting services from Roche, Biogen, Merck, Combinostics, Janssen and IXICO. He is co-founder and shareholder of Queen Square Analytics. CET has a collaboration contract with ADx Neurosciences, Quanterix and Eli Lilly, performed contract research or received grants from AC-Immune, Axon Neurosciences, Biogen, Brainstorm Therapeutics, Celgene, EIP Pharma, Eisai, PeopleBio, Roche, Toyama, Vivoryon. She serves on editorial boards of Medidact Neurologie/Springer, Alzheimer Research and Therapy, Neurology: Neuroimmunology & Neuroinflammation, and is editor of a Neuromethods book Springer. LB has received unrestricted research grants to his institution and/or scientific advisory board or speaker honoraria from Almirall, Biogen, Genzyme, Merck, Novartis, Roche and Teva; and has participated in clinical trials organized by Biogen, Merck, Novartis, Roche, and Genzyme. ØT has received research grants and speaker honoraria from Biogen, Roche, Novartis, Merck and Sanofi. KMM has received unrestricted research grants to his institution; scientific advisory board, or speaker honoraria from Almirall, Biogen, Genzyme, Merck, Novartis, Roche, and Teva; and has participated in clinical trials organized by Biogen, Merck, Novartis, and Roche. HV has received research grants from Pfizer, Merck Serono, Novartis and Teva; speaker honoraria from Novartis; and consulting fees from Merck Serono; all funds were paid directly to his institution.
Provenance and peer review Not commissioned; externally peer reviewed.
Supplemental material This content has been supplied by the author(s). It has not been vetted by BMJ Publishing Group Limited (BMJ) and may not have been peer-reviewed. Any opinions or recommendations discussed are solely those of the author(s) and are not endorsed by BMJ. BMJ disclaims all liability and responsibility arising from any reliance placed on the content. Where the content includes any translated material, BMJ does not warrant the accuracy and reliability of the translations (including but not limited to local regulations, clinical guidelines, terminology, drug names and drug dosages), and is not responsible for any error and/or omissions arising from translation and adaptation or otherwise.