Article Text

Abstract
Background SARS-CoV-2 mRNA vaccination of healthy individuals is highly immunogenic and protective against severe COVID-19. However, there are limited data on how disease-modifying therapies (DMTs) alter SARS-CoV-2 mRNA vaccine immunogenicity in patients with autoimmune diseases.
Methods As part of a prospective cohort study, we investigated the induction, stability and boosting of vaccine-specific antibodies, B cells and T cells in patients with multiple sclerosis (MS) on different DMTs after homologous primary, secondary and booster SARS-CoV-2 mRNA vaccinations. Of 126 patients with MS analysed, 105 received either anti-CD20-based B cell depletion (aCD20-BCD), fingolimod, interferon-β, dimethyl fumarate, glatiramer acetate, teriflunomide or natalizumab, and 21 were untreated MS patients for comparison.
Results In contrast to all other MS patients, and even after booster, most aCD20-BCD- and fingolimod-treated patients showed no to markedly reduced anti-S1 IgG, serum neutralising activity and a lack of receptor binding domain-specific and S2-specific B cells. Patients receiving fingolimod additionally lacked spike-reactive CD4+ T cell responses. The duration of fingolimod treatment, rather than peripheral blood B and T cell counts prior to vaccination, determined whether a humoral immune response was elicited.
Conclusions The lack of immunogenicity under long-term fingolimod treatment demonstrates that functional immune responses require not only immune cells themselves, but also access of these cells to the site of inoculation and their unimpeded movement. The absence of humoral and T cell responses suggests that fingolimod-treated patients with MS are at risk for severe SARS-CoV-2 infections despite booster vaccinations, which is highly relevant for clinical decision-making and adapted protective measures, particularly considering additional recently approved sphingosine-1-phosphate receptor antagonists for MS treatment.
- multiple sclerosis
- immunology
- clinical neurology
- infectious diseases
Data availability statement
Data are available on reasonable request. The data that support the findings of this study are available from the corresponding author on reasonable request.
This is an open access article distributed in accordance with the Creative Commons Attribution 4.0 Unported (CC BY 4.0) license, which permits others to copy, redistribute, remix, transform and build upon this work for any purpose, provided the original work is properly cited, a link to the licence is given, and indication of whether changes were made. See: https://creativecommons.org/licenses/by/4.0/.
Statistics from Altmetric.com
WHAT IS ALREADY KNOWN ON THIS TOPIC
Most studies have focused on humoral and cellular responses to COVID-19 vaccination in aCD20-BCD (Apostolidis et al, 2021; Habek et al, 2022; Madelon et al, 2022; Bajwa et al, 2022; Brill et al, 2022) while those investigating a broader range of disease-modifying treatments have relied on small sample sizes (Tortorella et al, 2021; Sabatino et al, 2022) without baseline data, humoral outcomes only (Tallantyre et al, 2021; Dreyer-Alster et al, 2022; Levit et al, 2022; Guerrieri et al, 2022; Satyanarayan et al, 2022; König et al, 2022; Mariottini et al, 2022) or short-term follow-ups (Yuzefpolskiy et al, 2022; Iannetta et al, 2022; Zabalza et al, 2022; Kister et al, 2022). Particularly for sphingosine-1-phosphate receptor antagonist treatment, we found no studies reporting in-depth analyses of vaccine-induced B and T cells and neutralising capacity including booster vaccinations and providing insight into factors that may influence immunogenicity in these patients and thus providing clinical guidance.
WHAT THIS STUDY ADDS
To our knowledge, this is the only study investigating multifaceted humoral and cellular immune responses to COVID-19 vaccination schedules in patients with multiple sclerosis (MS) with a broad spectrum of different disease-modifying therapies (DMTs), starting prior to primary vaccination (baseline data) until after the booster vaccinations allowing us to identify factors possibly correlated with unsuccessful humoral and cellular vaccination outcomes. Not only did we focus on receptor binding domain (RBD)-specific humoral and T cell responses, but the methodology used allowed us to determine, in the absence of a de novo response, whether reactivation of a pre-existing protective memory had occurred by dissecting RBD/S1-specific and S2-specific humoral and T cell responses.
HOW THIS STUDY MIGHT AFFECT RESEARCH, PRACTICE AND/OR POLICY
We found a significant reduction of the humoral immune response for aCD20-BCD and fingolimod therapy but only for fingolimod a significant reduction or even absence of vaccine-specific T cell reactivity that persists after booster vaccinations. Unlike all other DMTs, including aCD20-BCD, patients treated with fingolimod cannot rely on T cell protection in the absence of a humoral response, and this depends on the treatment duration. These results suggest that MS patients treated with fingolimod require extended health screenings and adapted protective measures beyond currently available vaccinations as SARS-CoV-2 and the potentially serious consequences of infection will persist and may affect a vulnerable patient population.
Introduction
COVID-19 is caused by SARS-CoV-2 and presents with a wide variety of symptoms ranging from asymptomatic to severe and even fatal disease courses. In addition to age and lifestyle-related diseases, other major risk factors for severe COVID-19 disease courses include immunosuppression due to chronic diseases or immunosuppressive therapies.1 2 For patients with the autoimmune disease multiple sclerosis (MS), studies have produced mixed results regarding patient susceptibility and severity of COVID-19 mainly due to differences between the treatment.3–6 In particular, aCD20-BCD therapies with rituximab and ocrelizumab and the sphingosine-1-phosphate (S1P) receptor functional antagonist fingolimod increased the risk of infection, hospitalisation and fatality.6–9 Fortunately, vaccines against SARS-CoV-2 became available within a year after the new virus strain emerged and two mRNA vaccines, BNT162b2 (Pfizer-BioNTech) and mRNA-1273 (Moderna), demonstrated strong immunogenicity, efficacy and safety in their corresponding clinical trials receiving approval at the end of 2020.10 11 Due to their increased risk for severe COVID-19, patients with MS were prioritised for vaccination,12 however, it was expected that their highly immunomodulatory MS treatments compromise the immunogenicity of the vaccine and alter protection.13 14 Initial results demonstrated that patients with MS treated with aCD20-BCD showed lower to absent SARS-CoV-2 spike glycoprotein-specific antibody and B cell responses. Functional T cell responses were maintained but with partial selective defects in antigen-specific follicular helper T cells.15–17 Impaired humoral responses were also noted for patients on fingolimod treatment and besides, their T cell responses were decreased.18 19 Despite these selected reports of reduced immunogenicity, detailed reports examining the entire spectrum of humoral and cellular immune responses from before primary vaccination until after the booster vaccinations are still lacking.
In this study, we aimed to assess humoral and cellular immune responses to primary, secondary and booster SARS-CoV-2 vaccinations in patients with MS treated with aCD20-BCD, fingolimod, interferon-β (IFNβ), glatiramer acetate (GA), dimethyl fumarate (DMF), teriflunomide (TFN) or the α4-integrin monoclonal antibody natalizumab (NTZ) compared with those without any immunomodulatory treatment. Due to the high prevalence of MS and the tendency to start immunomodulatory treatment early, investigation on vaccine immunogenicity and longevity of induced immunity in this patient group becomes increasingly relevant for clinical practice and vaccine development. Currently available SARS-CoV-2 mRNA vaccines rely on the highly immunogenic SARS-CoV-2 surface spike glycoprotein, which elicits robust T cell and neutralising antibody responses.20 21 The spike glycoprotein consists of two subunits, S1 and S2, of which the less conserved S1 subunit mediates virus-receptor contact via the receptor binding domain (RBD) and is the target of the de novo immune response, which is also the correlate for eliciting a protective immune response. The S2 subunit mediates membrane fusion and is more conserved with respect to endemic coronaviruses.22–24 Here, we dissected the immune responses to both subunits individually as cross-reactive reactivation of pre-existing immune memory against the S2 subunit could occur even in the absence of a de novo response, which may be impaired in patients on disease-modifying therapies (DMTs).
Methods
Participants
Participants were recruited at the MS outpatient clinic of the Charité - Universitätsmedizin Berlin between January and October 2021. Inclusion criteria were: (1) MS diagnosis according to the McDonald criteria of 2017, (2) stable disease for at least 3 months (no acute relapse therapy, no clinical progression or new symptoms suggestive of relapse, no disease activity on brain MRI), (3) continuous immunomodulatory treatment or no treatment for at least 3 months, (4) immunomodulatory monotherapy (if treated) and (5) no medical contraindications against SARS-CoV-2 vaccination. Patients of the aCD20-BCD cohort received either rituximab or ocrelizumab (dosage per administration: 1000 mg rituximab or 600 mg ocrelizumab) in 6 month intervals (except for two patients whose next treatment intervals were delayed due to low lymphocyte counts). Out of 136 patients included, 3 with signs of previous SARS-CoV-2 infection (previous SARS-CoV-2 infection verified by PCR or positive anti-S1 IgG levels at baseline) and seven vaccinated with a vector-based SARS-CoV-2 vaccine were excluded from analyses resulting in a total of 126 participants (figure 1A). Blood samples, nasopharyngeal swabs and a medical history were provided at up to seven time points: before primary vaccination (BL) and 1 month (before secondary vaccination), 3 months and 6 months after primary vaccination as well as before first booster vaccination (pre boost) and 1 month after each booster (1 month post first boost; 1 month post second boost, figure 1B). Fifteen patients were included prior to follow-ups and 23 patients prior to booster vaccinations. Only untreated patients and aCD20-BCD- or fingolimod-treated patients were investigated pre and post booster vaccinations. All participants received a homologous prime-boost mRNA COVID-19 vaccination schedule and booster vaccinations with the same mRNA vaccine (BNT162b2 (BioNTech/Pfizer) or mRNA-1273 (Moderna)). No overt result differences between mRNA vaccines were observed (only three patients received the mRNA-1273 vaccine). The following patients were excluded from further analyses due to drop-out, SARS-CoV-2 infection, no booster or booster with a heterologous vaccine: untreated (n=4, before booster), aCD20-BCD (n=1, before 6 months; n=4, before booster), fingolimod (n=2, before booster), IFNβ (n=2, before 6 months), NTZ (n=2, before 6 months). Information on missing data is shown in the respective figures.

Study design and participant flow chart. (A) Timeline depicting study visits including clinical assessments and sample collection in relation to vaccinations. Time intervals reported as mean±range across all treatment groups as no significant differences between groups were detected. (B) Participant chart showing available data for screening, data collection and analyses steps. aCD20-BCD, anti-CD20 B cell depletion; BL, baseline; DMF, dimethyl fumarate; GA, glatiramer acetate; IFNβ, interferon-β; m, month/s; MS, multiple sclerosis; TFN, teriflunomide; NTZ, natalizumab.
SARS-CoV-2 RT-qPCR
RT-qPCR analysis of nasopharyngeal swabs was performed as previously described.25
Blood sampling, serum preparation and peripheral blood mononuclear cell isolation
Whole blood was collected in lithium heparin tubes for peripheral blood mononuclear cell (PBMC) isolation and in SSTII advance (all Vacutainer, BD) tubes for serology. SSTII advance tubes were centrifuged at 1000xg for 10 min and serum supernatant aliquots were frozen at −80°C until further use. PBMCs were isolated by gradient density centrifugation using Bicoll (Bio&SELL) and Leucosep tubes (Greiner) according to the manufacturer’s instructions and immediately used for T cell stimulations and flow cytometry assays.
Anti-SARS-CoV-2 S1 ELISA
Anti-SARS-CoV-2 S1 IgG testing was performed using a commercially available ELISA kit (Euroimmun).
SARS-CoV-2 pseudovirus neutralisation assay
Serum neutralisation was measured using a lentivirus-based pseudovirus neutralisation assay as described before26 and in online supplemental methods.
Supplemental material
SARS-CoV-2 spike epitope-specific peptide microarray
Serum IgG reactivity profiling was performed by JPT Peptide Technologies with a peptide microarray (JPT Peptide Technologies) containing 562 peptides derived from a peptide scan (15mers with 11 aa overlap) through spike glycoprotein (Swiss-Prot ID: P0DTC2) of the Wuhan type SARS-CoV-2. For a detailed method description see online supplemental methods.
Ex vivo T cell stimulations
Freshly isolated PBMC were cultivated at 5x10⁶ PBMC in RPMI 1640 medium (Gibco) supplemented with 10% heat inactivated AB serum (Pan Biotech), 100 U/mL penicillin (Biochrom), 0.1 mg/mL streptomycin (Biochrom). Stimulations with peptide pools covering the SARS-CoV-2 spike S1 subunit (S-I) and the spike S2 subunit (S-II) were conducted as described before20 22 and in online supplemental methods.
Protein labeling for RBD- and S2-specific B cells
Recombinant SARS-CoV-2 spike-S2 (Miltenyi) was covalently labelled with Pacific Blue (Antibody Labelling Kit, Invitrogen) and AlexaFluor488 (Antibody Labelling Kit, Invitrogen), respectively, and recombinant SARS-CoV-2 spike-RBD (Miltenyi) was labelled with AlexaFluor647 (Antibody Labelling Kit, Invitrogen) following the manufacturer’s instructions. For labelling of SARS-CoV-2 spike-RBD with PE-Vio615, biotinylated SARS-CoV-2 spike-RBD (Miltenyi) was incubated for 15 min at room temperature with Streptavidin-PE-Vio615 (Miltenyi) at 4:1 molar ratio each time before staining.
B cell and T cell flow cytometry
For RBD- and S2-specific B cell analysis: Surface staining was performed for 20 min in the presence of 1 mg/mL beriglobin (CSL Behring) with the following fluorochrome-conjugated antibodies titrated to their optimal concentrations: CD20-Viogreen (LT20, Miltenyi), CD14 BV570 (M5E2, Biolegend), CD38 BV605 (HB7, Biolegend), CD27 PE (O323, Biolegend), IgD PerCP-Cy5.5 (IA6-2, Biolegend), CD19 PE-Cy7 (SJ25C1, Biolegend) and CD3 APC-Cy7 (UCHT1, Biolegend) and the labelled proteins (S2 PacBlue (0.25 µg), S2 AlexaFluor488 (0.25 µg), RBD Biotin/Streptavidin PE-Vio615 (0.15 µg) and RBD AlexaFluor647 (0.15 µg)).20 22 Zombie Yellow fixable viability staining (Biolegend) was added during the last 5 min of incubation. After staining, the cells were washed once in PBS/BSA, centrifuged and resuspend in PBS/BSA/2 mM EDTA. For analyses of S-I- and S-II-specific T cells and peripheral blood B and T cell subsets, antibody staining was performed as described before20 22 and in online supplemental methods. All samples were measured on a MACSQuant Analyzer 16 (Miltenyi). Instrument performance was monitored using Rainbow Calibration Particles (BD).
Data collection and statistical analysis
Study data were collected and managed using REDCap electronic data capture tools hosted at the Charité. Flow cytometry data were analysed using FlowJo V.10 (BD). Prism V.9 (GraphPad) was used for the following data plotting and statistical analyses: Fisher’s exact test for seroconversion rate comparison; Kruskal-Wallis test followed by Dunn’s multiple comparisons test for group comparisons; Spearman correlation for correlation testing. Correlation analyses were performed in R (R Core Team (2021). R: A language and environment for statistical computing. R Foundation for Statistical Computing, Vienna, Austria. URL https://www.R-project.org/.). Spearman correlations between potential predictive variables and several outcomes were determined and the matrix of correlation coefficients were plotted using the corrplot package (Taiyun Wei and Viliam Simko (2021). R package ‘corrplot’: Visualisation of a Correlation Matrix (V.0.92), available from https://github.com/taiyun/corrplot. Correlation coefficients were reported as r. Only correlations with at least five measured value pairs were shown in the plots. No adjustment of p values for multiple testing was done to avoid an inflation of type II errors. Selected single correlations were plotted using the default plot-function in R, including results for Pearson and Spearman correlations. CD4+ T cell activation was plotted as stimulation index (StimIndex), that is, ratio of % of CD40L+4-1BB+ CD4+ T cells in stimulated samples and % of CD40L+4-1BB+ CD4+ T cells in unstimulated controls. Stimulation indices of 1.5 were assumed to be positive with uncertainty, and stimulation indices of 3.0 and above were assumed to be a definitely positive indicator of an antigen-specific T cell response.
Results
To determine the individual effects of DMTs commonly used to treat patients with MS on humoral and cellular immune responses to mRNA SARS-CoV-2 vaccinations, we analysed 105 DMT-treated patients with MS and compared them to 21 untreated patients with MS (see table 1 for details of DMTs and clinical characteristics). Clinical histories and samples were taken prior to and 1 month, 3 months and 6 months post primary vaccination as well as before the first booster vaccination (pre boost) and 1 month after each booster (1 month post first boost; 1 month post second boost; see the Methods section for further details). The significance levels reported result from comparisons between the respective treatment group and the untreated patient cohort.
Clinical cohort characteristics
Impaired seroconversion after mRNA vaccination in aCD20-BCD-treated and fingolimod-treated patients
Compared with untreated patients with MS, patients with MS receiving aCD20-BCD therapies or fingolimod showed significantly lower or no anti-S1 IgG levels at 1 month and 3 months post primary vaccination (figure 2A). Ten of 11 (91%) untreated patients with MS seroconverted after primary vaccination, the 11th patient after secondary vaccination. In patients receiving DMTs, except for aCD20-BCD and fingolimod, seroconversion was not significantly different to untreated patients with conversion rates ranging from 67% to 100% after the primary vaccination, depending on the treatment group, and a 100% seroconversion rate after the secondary vaccination. In contrast to untreated patients with MS, patients with MS on aCD20-BCD therapies and fingolimod demonstrated significantly reduced seroconversion rates. In detail, 2 of 22 (9%) aCD20-BCD-treated patients seroconverted at 1 month (p=7×10⁻⁶) and 5 of 24 (21%) at 3 months (p=7×10⁻⁵); 0 of 17 (0%) fingolimod-treated patients seroconverted at 1 month (p=8×10⁻⁷) and 7 of 21 (33%) at 3 months (p=4×10⁻⁴) post primary vaccination. Of note, anti-S1 IgG levels of seroconverted fingolimod-treated patients remained on a lower level compared with all other patients. Next, we used SARS-CoV-2 whole spike peptide arrays to determine whether antibodies to spike epitopes other than those in the spike glycoprotein S1 subunit were induced in patients with MS treated with aCD20-BCD or fingolimod. Compared with untreated patients with MS, these patients showed binding to a significantly lower number of different S2 subunit peptides (p=0.002; figure 2B). Specifically, this number was significantly decreased in S1-non-seroconverted aCD20-BCD-treated patients compared with seroconverted patients of this treatment group. No such difference was observed in fingolimod-treated patients. Both aCD20-BCD and fingolimod-treated patients who did not have positive anti-S1 IgG levels (with the exception of one fingolimod patient) did not show increased antibody binding to S2 spike peptide fragments either (figure 2C).
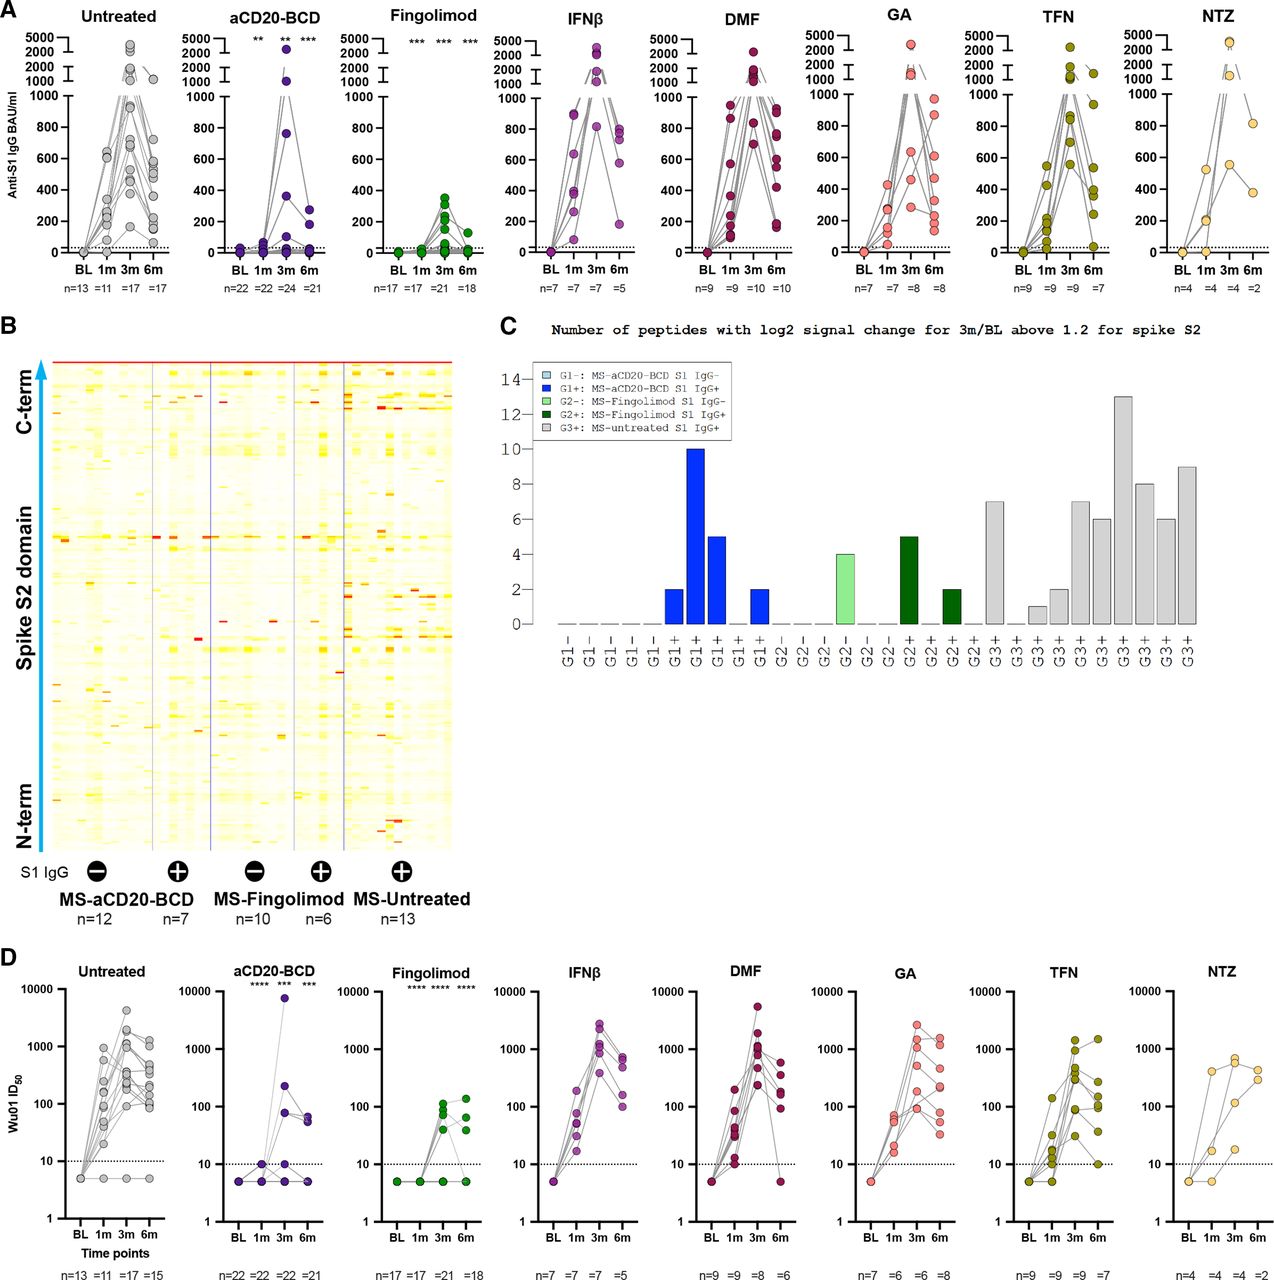
Decreased humoral responses after SARS-CoV-2 mRNA vaccination in aCD20-BCD-treated and fingolimod-treated patients. (A, D) Anti-S1 IgG response (A) and Wu01 spike neutralising capacity (D) at BL and 1month, 3 months and 6 months post primary vaccination per treatment group. Positivity thresholds: >31 binding antibody units (BAU)/mL for anti-S1 IgG. >10 ID50 for Wu01 spike neutralisation. Serum ID50 values less than the lowest serum dilution tested (1:10) were assigned a value of 5 for plotting the graph and for statistical analysis. Each dot represents the determined value for a patient. The number of patients per time point for each respective group is provided below each plot. Kruskal-Wallis test followed by Dunn’s multiple comparisons test were performed to test treatment groups in comparison to untreated patients at the respective time points. Significance levels indicate differences between treatment groups and the untreated cohort and are reported as: **p≤0.01, ***p≤0.001, ****p≤0.0001. Non-significant results were not reported. (B) Peptide array results from SARS-CoV-2 S2 subunit peptides from sera from subcohorts of the indicated MS treatment groups, respectively, with (+) or without (−) anti-S1 IgG antibodies. (C) Number of peptides with log2-fold signal change for 3 m/BL >1.2 for all S2 peptides depicted according to subcohorts of the indicated treatment group with (+) or without (−) anti-S1 IgG antibodies. BL, baseline; DMF, dimethyl fumarate; GA, glatiramer acetate; IFNβ, interferon-β; m, month/s; MS, multiple sclerosis; TFN, teriflunomide; NTZ, natalizumab.
To further investigate humoral features of the mRNA vaccine-induced immune response, we examined serum spike neutralisation capacities using a pseudovirus neutralisation assay of the Wu01 spike protein, which is the vaccine strain (figure 2D). Overall, anti-S1 IgG levels correlated positively with the serum ability to neutralise Wu01 spike at 3 months (figure 2A,D; online supplemental figure 1). The untreated MS cohort showed the highest serum spike neutralising capacity with a geometric mean serum ID50 titre of 382 at 3 months post primary vaccination. IFNβ, DMF, GA, TFN and NTZ treatment did not affect development of serum neutralising activity at 3 months. Treatment with aCD20-BCD therapies and fingolimod reduced the geometric mean serum neutralising titres at 3 months by 35-fold and 48-fold, respectively, compared with untreated patients with MS. In stark contrast to all other groups and consistent with anti-S1 IgG production, none of the aCD20-BCD-treated or fingolimod-treated patients showed neutralising serum capacity already after the first vaccination (figure 2D). Notably, while 7 of 21 (33%) fingolimod-treated patients mounted positive anti-S1 IgG levels after secondary vaccination (at 3 m), only 4 of 22 (18 %) showed any detectable neutralising activity with an ID50 >10 at this 3 months time point. No such discrepancy was found for aCD20-BCD.
Impaired B cell responses after SARS-CoV-2 mRNA vaccination in aCD20-BCD-treated and fingolimod-treated patients with MS
To define the magnitude of the RBD-specific and S2-specific B cell response in our MS patient cohorts post vaccination, we used direct staining of B cells with fluorescently labelled antigens and flow cytometry. Consistent with the serological response, only a fraction of patients on aCD20-BCD therapies and fingolimod exhibited circulating RBD- (aCD20-BCD 7%, fingolimod 50%) and S2-specific (aCD20-BCD 14%, fingolimod 50%) B cells after the secondary vaccination (at 3 months) and only in low numbers (figure 3A,B). For the other treatment groups, no significant difference in RBD-specific and S2-specific B cell responses was observed compared with untreated patients with MS, all of whom had detectable circulating spike-specific B cells. B cell compartmentalisation was similar in untreated patients and patients on DMTs except, again, for aCD20-BCD therapies and fingolimod. Most antigen-specific B cells were memory B cells regardless of S2- or RBD-specificity but the memory compartment was larger for S2-specific B cells (figure 3C).27–30 For aCD20-BCD-treated patients with MS, none of the few RBD-specific B cells (detectable in only two patients) were memory B cells. For fingolimod-treated patients, we observed a shift towards a naïve B cell phenotype of both RBD-specific and S2-specific B cells (detectable in only eight patients) compared with the other patients with MS.

Decreased and naïve B cell-shifted RBD-specific and S2-specific B cell responses in aCD20-BCD-treated and fingolimod-treated patients with MS. (A, B) Absolute numbers of RBD-specific (A) and S2-specific (B) CD19+ B cells at 3 months post primary vaccination for each treatment group. Mean and SD are indicated. Each dot represents the determined value for a patient. The number of patients for each respective group is provided below each plot. Kruskal-Wallis test followed by Dunn’s multiple comparisons test were performed to test treatment groups in comparison to untreated patients. Significance levels indicate differences between treatment groups and the untreated cohort and are reported as: **p≤0.01, ****p≤0.0001. Non-significant results were not reported. (C) Frequencies of CD19+CD20low/-CD27++CD38++ plasma blasts (PB), CD19+CD20+CD27- IgD+ naïve B cells (nBC), CD19+CD20+CD27+ IgD- memory B cells (mBC), CD19+CD20+CD27+ IgD+ MBC (dp MBC) and CD19+CD20+CD27- IgD- B cells (dn MBC) in RBD-specific and S2-specific CD19+ B cells per treatment group. B cell gating is shown in online supplemental figure 4. RBD, receptor binding domain. DMF, dimethyl fumarate; GA, glatiramer acetate; IFNβ, interferon-β; m, month/s; MS, multiple sclerosis; TFN, teriflunomide; NTZ, natalizumab.
Lack of vaccine-induced spike-reactive CD4+ T cell responses in fingolimod-treated patients with MS
Robust T cell responses are associated with improved survival in COVID-19 patients with haematological malignancies including patients receiving BCD therapies.31 32 Given the poor humoral responses in patients with MS treated with aCD20-BCD or fingolimod, we next examined CD4+ T cell S-I and S-II peptide pool reactivity following primary and secondary SARS-CoV-2 mRNA vaccination (figure 4A,B). All patients with MS without treatment and on DMTs except fingolimod demonstrated a strong increase in S-I- and S-II-reactive CD4+ T cells after primary vaccination. In contrast, fingolimod-treated patients showed significantly reduced or no S-I- and S-II-reactive T cell responses. Only 1 of 17 (6%) fingolimod-treated patients had a weak CD4+ T cell response to the S-I peptide pool after the primary vaccination and 3 of 17 (18%) to S-II. The secondary vaccination triggered low responses in 3 of 21 (14%) fingolimod-treated patients to S-I and S-II. As fingolimod treatment affects the composition of circulating T cell subsets,33 34 we assumed an impact on the detected vaccination responses. Therefore, we next examined the effect of fingolimod on the T cell populations of our cohorts. As expected, fingolimod-treated patients showed significantly fewer circulating CD3+ T cells and a CD4/CD8 subset shift in favour of CD8+ T cells (figure 4C,D). In addition, we observed significantly more signalling lymphocyte activation molecule family member seven (SLAMF7) positive cytotoxic CD4+ and CD8+ T cells35 in these patients (figure 4E) and very few circulating CD4+ helper T cells. The distribution of circulating T cell subsets before vaccination remained largely unchanged post vaccination in all groups although the absolute number of CD3+ T cells varied (figure 4C,D). Overall, spike-reactive T cell responses were severely impaired in patients with MS treated with fingolimod, which is in stark contrast to untreated patients and patients on other DMTs including aCD20-BCD.
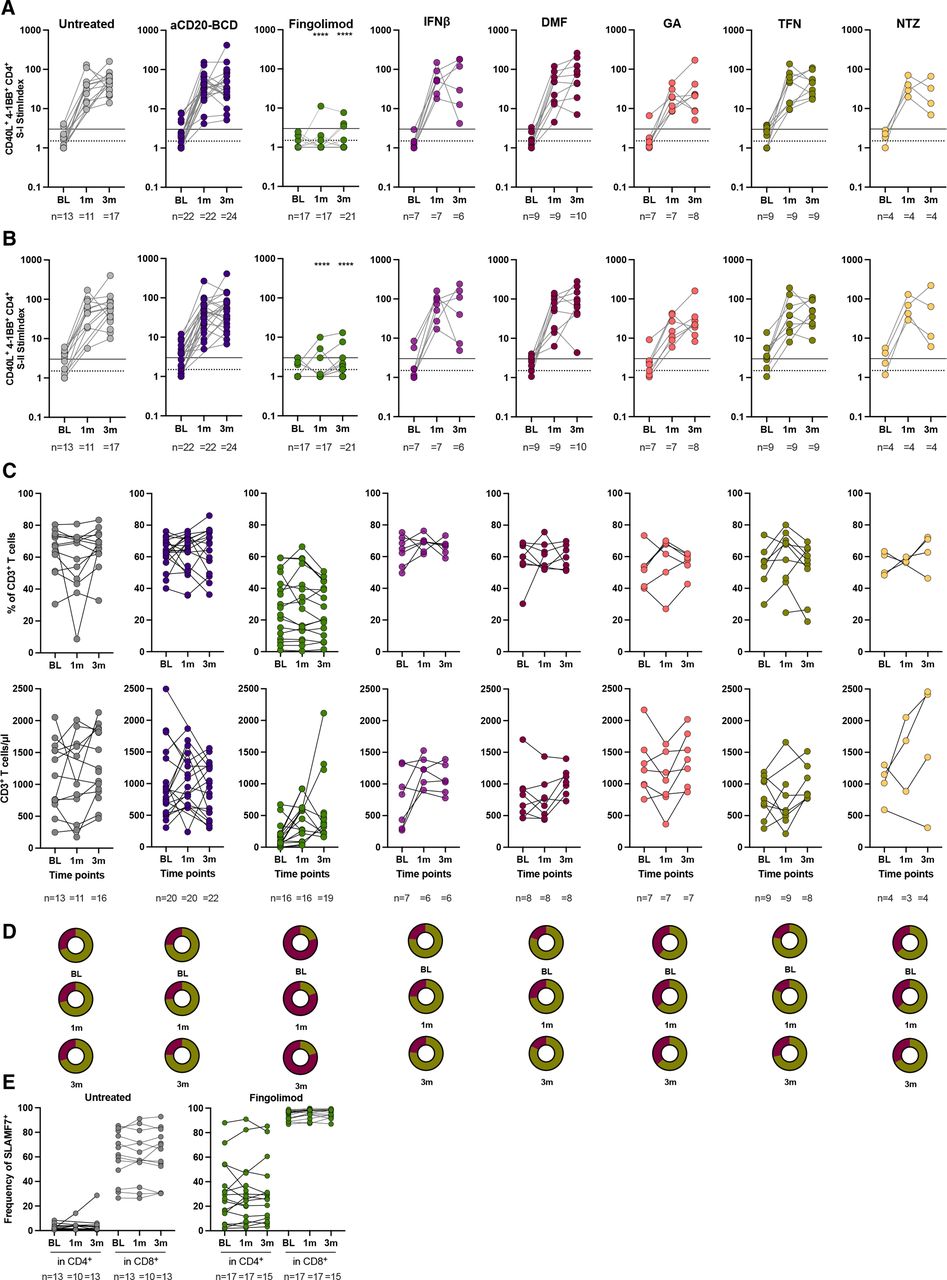
Impaired S-I- and S-II-reactive CD4+ T cell responses in fingolimod-treated patients with MS. (A, B) S-I-specific (A) and S-II-specific (B) CD4+ T cell reactivity at BL, 1 month and 3 months post first vaccination per treatment group. Lines indicate stimulation indices (StimIndex) of 1.5 (positive with uncertainty; dotted line) and 3.0 (definitely positive; solid line). T cell gating is shown in online supplemental figure 5. Each dot represents the determined value for a patient. The numbers of patients per time point for each respective group is provided below each plot. Kruskal-Wallis test followed by Dunn’s multiple comparisons test performed to test treatment groups in comparison to untreated patients at the respective time points. Significance levels indicate differences between treatment groups and the untreated cohort and are reported as: ****p≤0.0001. Non-significant results were not reported. (C) Frequencies and absolute CD3+ T cell number at BL, 1 month and 3 months after primary vaccination per treatment group. (D) Frequencies of CD4+ (violet) and CD8+ (green) cells in CD3+ T cells at BL, 1 month and 3 months post first vaccination per treatment group. (E) Frequencies of SLAMF7+ cells in CD4+ or CD8+ T cells, respectively, at BL, 1 month and 3 months for patients treated with fingolimod compared with untreated patients. SLAMF7+, signalling lymphocyte activation molecule family member 7 positive. BL, baseline; DMF, dimethyl fumarate; GA, glatiramer acetate; IFNβ, interferon-β; m, month/s; MS, multiple sclerosis; TFN, teriflunomide; NTZ, natalizumab.
Humoral and cellular immune response coordination in fingolimod-treated patients with MS
Next, we performed correlation analyses to gain insight into which factors influencing the individual immunological health status may be associated with the partial or complete absence of vaccine-induced immune responses in aCD20-BCD- and fingolimod-treated patients with MS. These analyses revealed negative correlation trends between antibody induction and disease duration, and positive correlation trends between antibody induction and the amounts of B cells and T cells before vaccination (figure 5A–C). As shown previously, we found that anti-S1 IgG levels post vaccination in patients receiving aCD20-BCD therapies showed a significant positive correlation with the frequency and absolute number of B cells before vaccination (figure 5B, online supplemental figure 2, online supplemental table 1). In fingolimod-treated patients, B and T cell counts at baseline showed a significant positive correlation with the presence of S2-specific B cells at 1 month post primary vaccination but, importantly, not with anti-S1 IgG induction or neutralising capacity. Instead, we found a strong negative correlation between treatment duration and (neutralising) antibody induction in these patients (figure 5C,D) with a cut-off for IgG antibody induction at 29 months.

SARS-CoV-2 mRNA vaccination outcome to immune constitution correlation. (A–C) Multiple correlation analyses for untreated patients with MS (A), MS-aCD20-BCD patients (B), and MS-fingolimod (C). The y-axis represents vaccination outcome variables, the x-axis potential correlation variables. The colour of the result depicts the magnitude and direction of the respective correlation as indicated in the key on the right side. Spearman correlations with a p value below 0.05 were considered significant and indicated by white asterisks. Correlations with less than five measured value pairs were excluded due to low robustness and indicated by ‘NA’. (D) Simple linear correlation for anti-S1-IgG at 3 months and disease duration (Dis_Dur; MS-untreated), days since last treatment administration (Last_Treat; MS-aCD20-BCD), disease duration and overall treatment duration (Treat_Dur; MS-fingolimod; from upper left clock-wise). MS, multiple sclerosis.
Humoral and cellular immune responses in risk treatment groups after booster vaccinations
Considering the significantly reduced humoral response in aCD20-BCD-treated patients and the lack of both humoral and cellular responses in fingolimod-treated individuals, we further investigated the effect of SARS-CoV-2 mRNA booster vaccinations in these two treatment groups and again compared with the untreated cohort. Expectedly, untreated patients with MS showed an increase in anti-S1 IgG, neutralising capacity, RBD- and S2-specific B cells and spike-specific T cells after the first booster (figure 6A–D). However, in aCD20-BCD- and fingolimod-treated patients, the humoral response remained significantly reduced (figure 6A,B). The seroconversion rate (of those not previously seroconverted) was 19% (5/26) for aCD20-BCD and 36% (9/25) for fingolimod patients. Overall, only 35% (11/31) of aCD20-BCD- and 45% (13/29) of fingolimod-treated patients showed positive anti-S1 IgG levels after the third mRNA vaccination (figure 6A). In patients who had not previously been found to have neutralising serum capacity, booster vaccination induced neutralising capacity in only 29% (8/28) of patients in the aCD20-BCD cohort and in 32% (8/25) of the fingolimod group (overall 35% (11/31) aCD20-BCD; 41% (12/29) fingolimod; figure 6B). Similar to the first two vaccinations, a discrepancy between anti-S1 IgG and neutralising activity was evident in fingolimod patients. Consistently, circulating RBD-specific and S2-specific B cells were not detectable in the majority of patients of these two treatment groups or remained on a very low level (detectable in 3/27 (RBD, S2) in aCD20-BCD and 13/28 (RBD, S2) in fingolimod; figure 6C). All untreated and aCD20-BCD-treated patients showed a persistent T cell response to S-I- and S-II after first booster vaccination. By contrast, fingolimod-treated patients exhibited a significantly lower spike-specific T cell response: only 26% (7/27) of fingolimod-treated patients had detectable S-I-reactive CD4+ T cells after the third vaccination (pre boost 1/26) and 9/27 had detectable S-II-reactive CD4+ T cell responses (pre boost 3/26; figure 6D). Importantly, two aCD20-BCD and eight fingolimod patients received a fourth COVID-19 vaccination with none of the aCD20-BCD group and two fingolimod patients previously positive for anti-S1 IgG. This second booster vaccination did not induce seroconversion in any of the previously negative patients in these two treatment groups. Interestingly, there was no longer a correlation between B cell counts pre boost and anti-S1 IgG post boost for the aCD20-BCD-treated cohort (online supplemental figure 3a; online supplemental table 1). This is in contrast to the primary SARS-CoV-2 mRNA vaccination regimen, in which we and others found a correlation between induced antibody titers and cell counts.15 36 In fingolimod patients, treatment duration continued to correlate with the lack of a humoral response to booster vaccination (online supplemental figure 3b).

Humoral and cellular responses to booster vaccinations in risk treatment groups. (A, B) Anti-S1 IgG response (A) and Wu01 spike neutralising capacity (B). (C) Absolute numbers of RBD-specific and S2-specific CD19+ B cells. (D) S-I-specific and S-II-specific CD4+ T cell reactivity. Lines indicate stimulation indices (StimIndex) of 1.5 (positive with uncertainty; dotted line) and 3.0 (definitely positive; solid line). For T cell gating see online supplemental figure 5. All data are shown for pre booster and 1 month after each booster (1 month post first boost; 1 month post second boost) for untreated, aCD20-BCD-treated and fingolimod-treated patients. Each dot represents the determined value for a patient. The number of patients per time point for each respective group is provided below each plot. Kruskal-Wallis test followed by Dunn’s multiple comparisons test were performed to test treatment groups in comparison to untreated patients at the respective time points. Significance levels indicate differences between the respective treatment group and the untreated cohort and are reported as: ****p≤0.0001. Non-significant results were not reported.
Discussion
We here provide a detailed analysis of primary, secondary and booster immune responses to SARS-CoV-2 mRNA vaccination in patients with MS treated with the S1P receptor functional antagonist fingolimod or aCD20-BCD therapies compared with other standard immunomodulatory treatment regimens and untreated patients with MS. SARS-CoV-2 vaccines mitigate the risk of infection and symptom severity of COVID-19 by inducing specific T cell and B cell memory37 38 but how B and T cells individually act to do so is so far unclear. The higher incidence of severe COVID-19 disease as well as the increased risk of infection despite vaccination in aCD20-BCD-treated patients with MS suggests that a lack of specific antibodies and B cells can severely impair COVID-19 immunity.6 9 39 40 Interestingly, antibody responses to SARS-CoV-2 appear to be relatively short-lived even in healthy individuals without known immunodeficiency, thus shifting the focus to B and T cellular immune memory to provide long-term protection from severe disease. T cell responses to SARS-CoV-2 vaccination have been shown to be stable and to play a central role in protection, enhancement of the antibody response and viral clearance.20 41 Consistently, reduced T cell responses against SARS-CoV-2 have also been associated with severe disease.42 In patients undergoing aCD20-BCD therapy, who consequently lack B cells and are unable to mount specific humoral immune responses, T cell responses are promising indicators of protective immune responses by providing B cell-independent protection from severe COVID-19.
Our findings, in synopsis with existing literature on vaccination against other diseases, demonstrate that untreated patients with MS and patients on DMT, except for aCD20-BCD therapies and fingolimod, mounted humoral immune responses to primary and secondary SARS-CoV-2 vaccination on a comparable level to that of normal healthy donors.15 20 43–48 Moreover, our results from patients on aCD20-BCD therapy receiving infusions of 600 mg ocrelizumab or 1000 mg rituximab in 6-month intervals corroborate previous reports showing that anti-S1 IgG levels after primary vaccination correlate with the absolute peripheral B cell counts and also, but to a lesser extent, with the duration since the last aCD20-BCD infusion before vaccination, and finally that aCD20-BCD has no effect on the principal ability to elicit SARS-CoV-2 spike-specific T-cell responses.15 49 50 In addition, we demonstrate that more than half of aCD20-BCD-treated patients remained without humoral response after booster vaccination, this time without significant correlation to peripheral B cell counts prior to booster, which is in line with findings from König et al.51 However, aCD20-BCD-treated patients investigated here showed very low B cell counts (2.1 B cells/µL on average excluding one outlier of 378 cells/µL who mounted a regular humoral response), which could bias correlation calculations due to some uncertainty in these small numbers. Another possible explanation for the lack of the association of B cell numbers and humoral response to booster vaccination could be aCD20-BCD reinfusions administered too soon after vaccination.
In contrast to all other treatment groups, the majority of fingolimod-treated patients with MS developed neither humoral nor CD4+ T cellular immune responses to SARS-CoV-2 vaccinations. Only some of the fingolimod-treated patients with a humoral response also showed neutralising serum capacity, possibly due to a lack of antibody maturation as a consequence of the absence of a spike-specific CD4+ T cell response and/or lack of B:T cell interaction within the secondary lymphoid organs (SLO). In line with low or no humoral responses, fingolimod-treated patients demonstrated absent or drastically reduced numbers of circulating RBD-specific and S2-specific B cells and if present biased in their composition with a higher proportion of naïve B cells. Despite an increase of anti-S1 IgG positive individuals in the fingolimod cohort by factor 1.36 after the first booster vaccination, most of these patients still lacked both humoral and cellular responses. Notably, more individuals showed a humoral response to booster vaccination than a measurable response at the cellular level. In regard to the clinical impact of vaccinations in this treatment group, this is consistent with a large study that reports an increased risk of SARS-CoV-2 infection despite vaccination in patients treated with S1P antagonists.40 However, data on COVID-19 severity in this medication group (before vaccination) are ambiguous.7 52 Fingolimod is a compound molecule which sequesters lymphocytes in SLO and inflammatory tissues and thus hinders lymphocyte recirculation into the periphery. It also facilitates an increased T cell responsiveness to ligands of the CCR7 receptor.53 T cells utilise CCR7 to home and migrate within the T cell zone and B cells express that receptor to position at the T:B border. To successfully mount a functional immune response, T and B cells must migrate from niche to niche and zone to zone in a rapid and highly regulated manner,54 a process that is abolished by fingolimod. Earlier studies also demonstrate effects of fingolimod on the mobility of dendritic cells,55 which taken all together may explain the lack of immune response in these patients and underscores the importance of immune cell migration in the coordinated nature of functional immune responses. Interestingly, observations in mice showed that fingolimod leads to sequestration of T cells in SLO but not that fingolimod completely abrogates specific immune responses.56 However, in these experiments mice were treated with fingolimod only over a short period of time, which may explain this discrepancy to our findings in humans.
While in aCD20-BCD-treated patients, efficacy of the primary vaccination regimen correlated with the time elapsed since last treatment administration and thus with the absolute number of B cells at the time of vaccination, in fingolimod-treated patients, vaccine-induced humoral responses were negatively correlated with overall treatment duration, which was also true for the third vaccination. A possible explanation for this could be that the antagonistic effect of fingolimod on lymphocytic S1P receptors is cumulative over time requiring a certain number of months to affect all peripheral lymphocytes. There may be a critical lower limit of (tissue-resident) peripheral lymphocytes to mount adaptive immune responses and this limit may have been approached at approximately 29 months. Fingolimod treatment suspension is often not feasible as reduced immunomodulation increases the risk of severe MS rebounds. Thus, there are currently very few options to improve the preconditions for successful vaccination outcomes in these patients, which may pose a high health risk to them.
Limitations to this study are the small samples sizes for some of the treatment groups and lacking data on lymphocyte subpopulations and homing receptors for further mechanistic insights into decreased or absent immune responses in aCD20-BCD-treated or fingolimod-treated patients. Future studies should further focus on the clinical impact (ie, risk of infection and disease severity) of lacking vaccination responses.
In summary, in striking contrast to all other DMTs, the majority of patients treated with fingolimod appear to be unable to mount specific B and T cell responses to SARS-CoV-2 vaccinations. Booster vaccinations particularly increase the proportion of fingolimod-treated patients showing a humoral immune response. It, however, remains unclear why some fingolimod-treated patients mounted (low) humoral and cellular immune responses after the second and/or third vaccination while most others did not. Accordingly, fingolimod-treated patients may require frequent immune monitoring and further protective measures such as patient education, which is becoming increasingly important in clinical practice as three new S1P receptor antagonists (siponimod, ozanimod, ponesimod) have recently been approved for use in different types of MS and thus in a growing number of patients.
Data availability statement
Data are available on reasonable request. The data that support the findings of this study are available from the corresponding author on reasonable request.
Ethics statements
Patient consent for publication
Ethics approval
This study involves human participants and was approved by the ethics committee of the Charité - Universitätsmedizin Berlin (reference number: EA/152/20). Participants gave informed consent to participate in the study before taking part.
Acknowledgments
We thank the CCC Study Group E. Baysal, T. Panne, F. Legler, M. Girod, B. Bohnen, T. Nguyen, J. Schmitz, R. Klemencic, L. Hintze, N. Avinc, P. Resch, A. Maraj, A. Farghaly, P. Schulz, N. Matuschewski, K. Gutwenger, I. Katsianas and C. Dedieu for their contributions to donor recruitment, sample processing and measurement. Furthermore, we thank A. Hetey for support with maintaining the REDCap database and N. Brindle for critical reading of the manuscript.
References
Supplementary materials
Supplementary Data
This web only file has been produced by the BMJ Publishing Group from an electronic file supplied by the author(s) and has not been edited for content.
Footnotes
JB, FF and KV contributed equally.
FP, JB-S, AT and CG-T contributed equally.
Correction notice This article has been corrected since it was first published. The open access licence has been updated to CC BY.
Contributors Conceptualisation: LM-A, FP, JB-S, AT and CG-T. Data Analysis: LM-A, JB, FF, KV, KJ, MM, AM, AB, PH, UR and CG-T. Funding acquisition: AT. Resources: LM-A, LL, LH, MD, BK, CB, AN, KdlR, CR, BS, LES and FK. Writing: LM-A, FP, JB-S, AT, CG-T. LM-A and CG-T have verified the manuscript’s data. CG-T acts a guarantor.
Funding This work was supported by the Federal Ministery of Health through a resolution of the German Bundestag (CCC 2.0 (V-2020.12/1503_68403 / 2021-2022) and CCP (ZMI1-2521KDG103)). Parts of the work were funded by the Deutsche Forschungsgemeinschaft (DFG, German Research Foundation) as part of the clinical research unit (CRU339): Food allergy and tolerance (FOOD@) – 428091001 (JB); 428094573 (FF).
Competing interests PH and UR are employed by JPT Peptide Technologies.
Provenance and peer review Not commissioned; externally peer reviewed.
Supplemental material This content has been supplied by the author(s). It has not been vetted by BMJ Publishing Group Limited (BMJ) and may not have been peer-reviewed. Any opinions or recommendations discussed are solely those of the author(s) and are not endorsed by BMJ. BMJ disclaims all liability and responsibility arising from any reliance placed on the content. Where the content includes any translated material, BMJ does not warrant the accuracy and reliability of the translations (including but not limited to local regulations, clinical guidelines, terminology, drug names and drug dosages), and is not responsible for any error and/or omissions arising from translation and adaptation or otherwise.