Article Text

Abstract
Background Whole brain volume (WBV) estimates in patients with multiple sclerosis (MS) correlate more robustly with clinical disability than traditional, lesion-based metrics. Numerous algorithms to measure WBV have been developed over the past two decades. We compare Structural Image Evaluation using Normalisation of Atrophy-Cross-sectional (SIENAX) to NeuroQuant and MSmetrix, for assessment of cross-sectional WBV in patients with MS.
Methods MRIs from 61 patients with relapsing-remitting MS and 2 patients with clinically isolated syndrome were analysed. WBV measurements were calculated using SIENAX, NeuroQuant and MSmetrix. Statistical agreement between the methods was evaluated using linear regression and Bland-Altman plots. Precision and accuracy of WBV measurement was calculated for (1) NeuroQuant versus SIENAX and (2) MSmetrix versus SIENAX.
Results Precision (Pearson's r) of WBV estimation for NeuroQuant and MSmetrix versus SIENAX was 0.983 and 0.992, respectively. Accuracy (Cb) was 0.871 and 0.994, respectively. NeuroQuant and MSmetrix showed a 5.5% and 1.0% volume difference compared with SIENAX, respectively, that was consistent across low and high values.
Conclusions In the analysed population, NeuroQuant and MSmetrix both quantified cross-sectional WBV with comparable statistical agreement to SIENAX, a well-validated cross-sectional tool that has been used extensively in MS clinical studies.
- MULTIPLE SCLEROSIS
- IMAGE ANALYSIS
- MRI
- NEURORADIOLOGY
This is an Open Access article distributed in accordance with the Creative Commons Attribution Non Commercial (CC BY-NC 4.0) license, which permits others to distribute, remix, adapt, build upon this work non-commercially, and license their derivative works on different terms, provided the original work is properly cited and the use is non-commercial. See: http://creativecommons.org/licenses/by-nc/4.0/
Statistics from Altmetric.com
Introduction
Brain volume loss (BVL) in patients with relapsing-remitting multiple sclerosis (RRMS) has been shown to occur at a faster rate (0.5–1.35% per year) compared with the BVL in age-matched healthy individuals (0.1–0.3% per year).1 ,2 The average patient with MS receiving first-generation disease-modifying treatment (DMT) or no DMT loses approximately 0.7% BV per year.2 BVL correlates with, and is emerging as a key predictor of, worsening future disability and cognitive impairment in patients with MS.1 ,3
Numerous manual, semiautomatic and fully automated algorithms to measure whole brain volume (WBV) from MRIs have been developed over the past two decades.4 Structural image evaluation, using normalisation, of atrophy—cross-sectional (SIENAX) is a freely available software tool (part of the FMRIB Software Library (FSL); http://www.fmrib.ox.ac.uk) that is widely used by expert MRI reading centres to measure cross-sectional WBV in MS clinical studies.4 SIENAX uses a segmentation-based algorithm to measure cross-sectional WBV from a single MRI, which is then normalised to a standard space to yield a normalised WBV.4
In routine clinical practice, disease monitoring is gradually evolving to include BVL, which has been validated as a predictor of treatment response in patients with MS,1 ,5 in addition to clinical and traditional, lesion-based MRI outcomes.
SIENAX is widely used in cross-sectional MS studies,4 but application in routine clinical practice is limited by the requirement for trained personnel and specialised reading centres to perform accurate measurements.6
Recent advances in computational methods have made it desirable to aim for algorithms that are fast, fully automated (minimal observer dependency), accurate, reproducible and applicable in both the clinical trial setting and routine clinical practice.7
NeuroQuant (CorTechs Labs) is a fully automated software, approved by the FDA and CE-marked (http://www.wholebrainatrophy.com) for measuring cross-sectional brain volumes. Originally designed for quantification of Alzheimer disease neuroimaging data sets,8 NeuroQuant software takes a high-resolution three-dimensional (3D) T1-weighted sagittal, non-contrast-enhanced MRI and automatically produces segmentation-based measurements of cortical and subcortical volumes. Briefly, the algorithm corrects for gradient non-linearity and field inhomogeneity, deletes non-brain tissue using an active contour model, and segments anatomic structures by non-linearly registering the volumes to an inbuilt probabilistic atlas and applying an iteratively derived neuroanatomic label to each voxel. NeuroQuant compares the volumes to a normative database adjusted for age, gender and intracranial volume.9 Using NeuroQuant MRI volumetrics, Neilsen et al, reported that brain atrophy correlates with physical disability in patients with MS treated with DMTs in routine clinical settings.10
MSmetrix (IcoMetrix) is a fully automated, CE-marked (http://www.icometrix.com) proprietary method that performs unsupervised tissue and lesion segmentation using 3D T1-weighted and fluid-attenuated inversion recovery (FLAIR) MRIs.7 Briefly, the FLAIR image is rigidly co-registered to the T1-weighted image; and probabilistic anatomical priors for grey matter (GM), white matter (WM) and cerebrospinal fluid (CSF), defined in Montreal Neurological Institute (MNI) space, are transferred to the T1-weighted image space using an affine registration followed by a non-rigid registration. An iterative algorithm based on probabilistic tissue priors is then used to segment the T1-weighted image into GM, WM and CSF, while maintaining spatial consistency, until convergence. Further, an iterative process that generates a map based on deviation of each voxel intensity from the combined tissue classes (outlier belief map) is used to segment WM lesions, which are then filled in on the bias-corrected T1-weighted image with their neighbourhood WM intensities. Jain et al7 showed that MSmetrix accurately performed automatic segmentation and volumetry of brain lesions on two distinct MS data sets from two clinical centres. MSmetrix reportedly also uses a separate, registration-based method that incorporates a Jacobian integration technique to facilitate longitudinal brain volumetric analyses.10
Various algorithms have been compared for accuracy, precision and reproducibility, and their performance on different MRI sequences has been assessed in other publications.11–13 In this analysis, we compared SIENAX to two fully automated software methods, NeuroQuant and MSmetrix, for use in the assessment of cross-sectional WBV in the patients with MS.
Methods
Patients
We analysed scans from 61 patients with RRMS and 2 patients with clinically isolated syndrome fulfilling McDonald 2010 criteria for MS. Patients able to have MRI were consecutively recruited from a single MS clinic in Sydney, Australia. All patients provided informed consent.
MRIs
MRIs of patients were recorded using the GE Discovery MR750 3.0 T scanner with the following specifications: sagittal 3D-T1 inversion-recovery fast spoiled-gradient echo, repetition time (TR)=7.2 ms, echo time (TE)=2.8 ms, inversion time (TI)=450 ms, resolution=0.9 mm isotropic, flip angle=12, acquisition matrix=256×256, field of view (FOV)=230 mm2 and average=1. Where relevant, scans were acquired at least 31 days after corticosteroid administration.
WBV determination
WBV measurements were calculated from MRIs using three different software programs, SIENAX, as described by Smith et al,14 NeuroQuant, as described in http://www.cortechslabs.com/neuroquant/ and MSmetrix as described by Jain et al.7 Thalamic volume was measured using FIRST, a model-based tool described by Patenaude et al.15
SIENAX pipeline modifications
Non-brain tissue was deleted from images by an expert neuroimaging analyst (CW) using the Brain Extraction Tool from the FMRIB Software Library (FSL) and manual cleaning prior to SIENAX analysis. To prevent bias due to WM lesions in segmentation-based WBV measurement, lesion in-painting was performed prior to SIENAX analysis. Briefly, the T2 MS lesion mask was delineated prior to lesion in-painting by an expert neuroimaging analyst (CW) with a semiautomatic region of interest tool (Jim, Xinapse System).
Thereafter, the lesion area on structural imaging was replaced with neighbouring normal-appearing WM using the lesion filling tool from FSL. No modifications were made to the automated NeuroQuant or MSmetrix pipelines.
Statistical evaluation of precision and accuracy
Statistical agreement between the methods was evaluated using linear regression and Bland-Altman plots as described by Bland and Altman.16 However, because SIENAX was considered as the standard, the original Bland and Altman methods were slightly modified and SIENAX was reported on x-axes instead of the means of SIENAX and the (other) method to be compared.17
Statistical precision (r), assessed by means of the Pearson's coefficient; and accuracy (Cb), the difference between the new method and the reference of WBV measurements, were calculated for NeuroQuant versus SIENAX and MSmetrix versus SIENAX. p Values <0.05 were considered statistically significant. Analyses were performed with Stata (StataCorp. 2009. Stata Statistical Software: Release 11. College Station, Texas, USA: StataCorp LP.)
Results
Baseline disease characteristics and MS treatment history
The baseline characteristics are presented in table 1.
Baseline characteristics
In the 12 months prior to study enrolment, 20/63 patients were not receiving any DMT. Of the remaining 43/63 patients, 19/63 patients were treated with interferon β-1a (Avonex, 17 and Rebif, 2), 7/63 with interferon β-1b (Betaferon), 7/63 with glatiramer acetate (Copaxone), 5/63 with fingolimod (Gilenya), 4/63 with natalizumab (Tysabri) and 1 patient was receiving an unspecified DMT.
Comparison of NeuroQuant and SIENAX
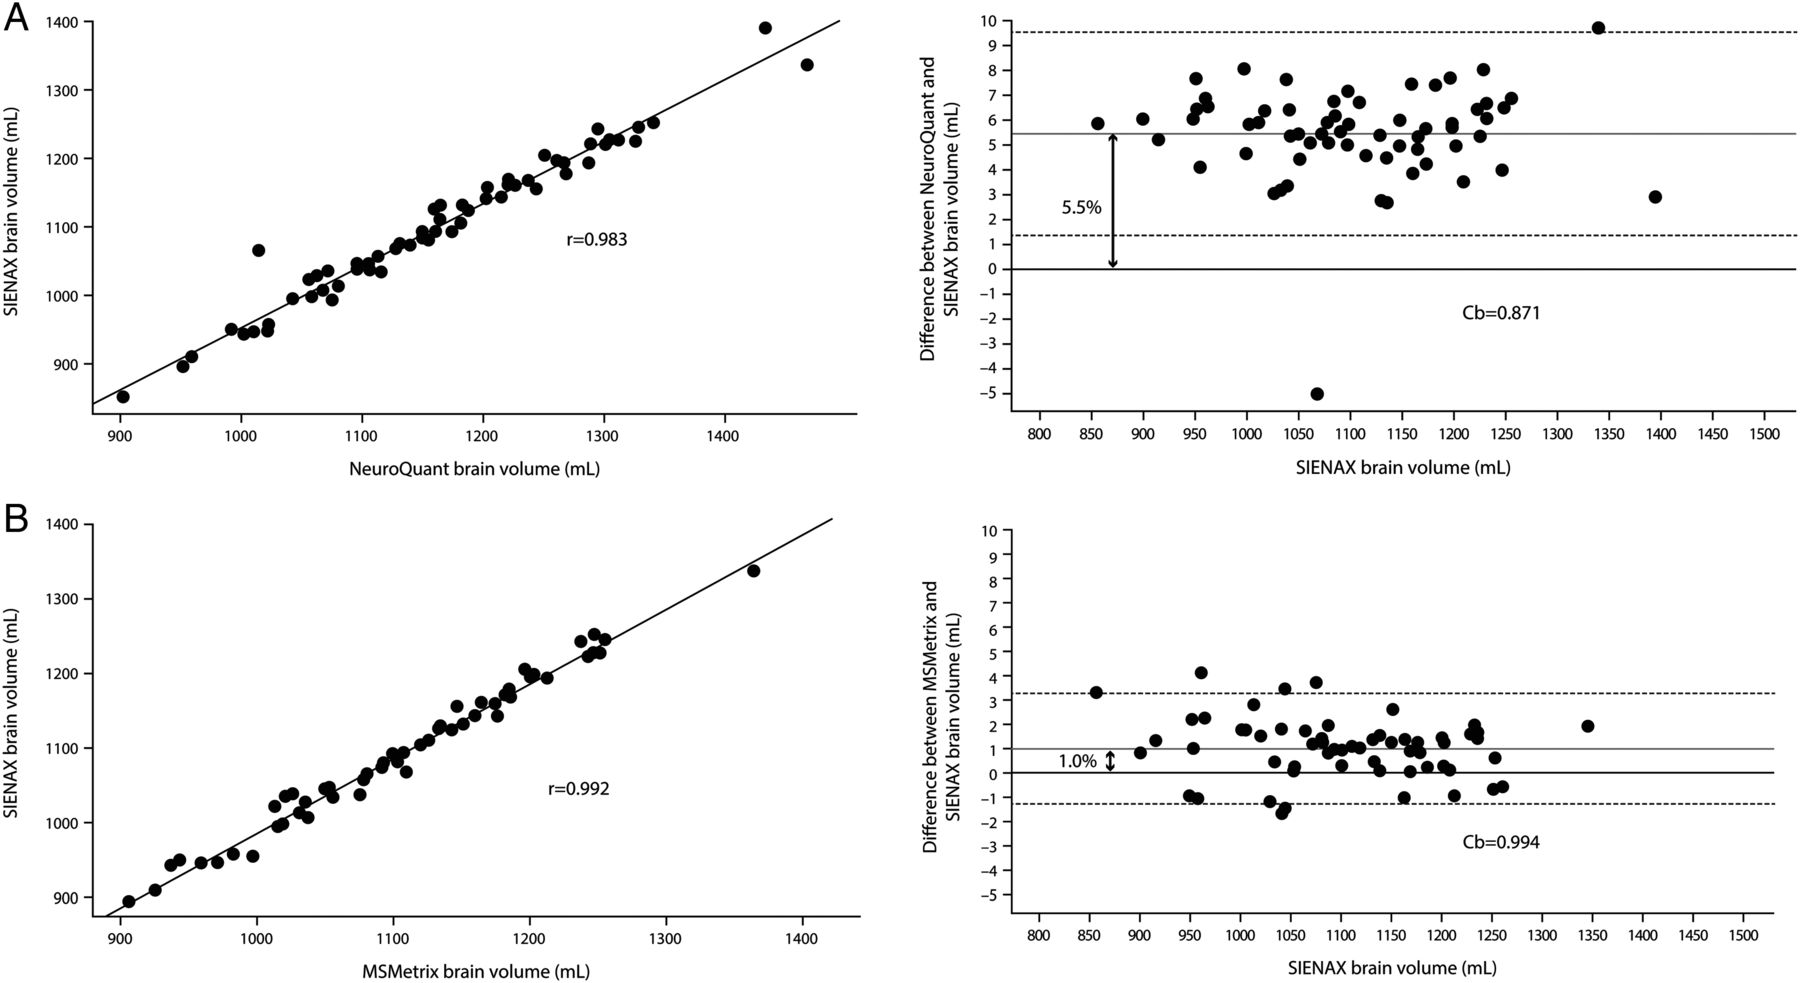
WBV was estimated in NeuroQuant by adding the automatically reported values for brainstem, forebrain parenchyma, cerebellar GM and cerebellar WM volumes, as no specific WBV metric was generated by the software at the time of analysis. The statistical precision of WBV estimation for NeuroQuant versus SIENAX was 0.983 (p<0.001) (figure 1A) and the statistical accuracy was 0.871 (figure 1A). NeuroQuant showed a 5.5% volume ‘overestimation’ compared with SIENAX (figure 1A) that held across high and low volumes. Visual inspection of the NeuroQuant analysis for the single outlier shown in figure 1A revealed incomplete segmentation of a significant region of frontal GM. The statistical precision and accuracy of thalamic volume estimation for NeuroQuant versus FIRST were 0.786 (p<0.001) and 0.915, respectively. NeuroQuant showed a 6.3% volume ‘overestimation’ compared with FIRST for thalamic volume measurement. SIENAX and NeuroQuant-derived WBV both correlated inversely with T2 lesion volume (r=−0.43, p<0.001 and r=−0.41, p<0.001, respectively) and T2 lesion number (r=−0.38, p<0.005 and r=−0.35, p<0.01, respectively).

Whole brain volume measurement: comparison of precision and accuracy among three methods. (A) Comparison of NeuroQuant and structural image evaluation, using normalisation, of atrophy – cross-sectional (SIENAX). NeuroQuant showed a 5.5% volume ‘overestimation’ compared with SIENAX. (B) Comparison of MSmetrix and SIENAX. MSmetrix showed a 1% volume ‘overestimation’ compared with SIENAX.
Comparison of MSmetrix and SIENAX
Three participants failed automated analysis and were excluded. Of the remaining participants, the statistical precision and accuracy of WBV estimation for MSmetrix versus SIENAX were 0.992 (p<0.001) and 0.994, respectively (figure 1B). MSmetrix showed a 1.0% volume ‘overestimation’ compared with SIENAX (figure 1B) that held across high and low volumes. The available iteration of MSmetrix software does not estimate thalamic volume. MSmetrix-derived WBV correlated inversely with T2 lesion volume (r=−0.37, p<0.005) and T2 lesion number (r=−0.32, p<0.05).
Discussion
Patients with MS with a lower-than-expected WBV are at a higher risk of future disability worsening.1 Additionally, patients with MS and a larger ‘brain reserve’ can better endure MS disease burden without noticeable cognitive decline.18 Recent work has shown that a personalised WBV threshold value, based on normalised WBV, age, sex, Expanded Disability Status Scale (EDSS), disease duration and T2 lesion volume, can be used to predict risk of future disability worsening and cognitive performance on Paced Auditory Serial Addition Test (PASAT).19 The results of these studies also suggest that DMTs, which have a proven effect on slowing BVL in RRMS, may be beneficial for delaying disability worsening and improving cognition, especially in patients with low WBV threshold values.20
The principal technical requisites for incorporating measures of brain volume in routine clinical practice include speed, accuracy, reproducibility and ‘user-friendliness’ of the relevant method. NeuroQuant and MSmetrix have the potential to address some of these challenges,7–9 but it is important that these tools are validated against SIENAX, the de facto gold standard for cross-sectional measurement of brain volume employed in modern MS clinical studies. Our findings show that NeuroQuant and MSmetrix both quantified cross-sectional WBV with comparable statistical agreement to SIENAX. We used MRI sequences that are employed in routine clinical practice in our centre; notably, the use of 3D-T1 sequence parameters that differ from those recommended by NeuroQuant (http://www.cortechslabs.com/wp-content/uploads/2015/06/NeuroQuant-Scanner-Parameters.pdf) did not appear to adversely affect segmentation results at the group level. MSmetrix does not recommend specific acquisition sequence parameters. Occasional scans failed, or provided inaccurate automated analysis using the methods tested in our study; improved algorithms in subsequent iterations of both software packages are expected to minimise the rate of automated analysis failure. While the development of these precise, easily deployable cross-sectional methods represents a first step toward the integration of brain volumetrics into routine clinical practice, emerging automated registration-based tools that permit rapid longitudinal assessment of WBV change may better predict longer term disease trajectory and guide therapeutic decision-making in individual patients with early MS.
Independent of the software used for quantification of WBV, several factors may interfere with the evaluation of WBV change, particularly outside of clinical trials. Image quality is critical to the reliability of MRI quantification analysis, especially for potential clinical applications. BVL in patients with MS is also observed during the first 6 months to 1 year of DMT (principally due to resolution of oedema and inflammation) and stabilises from the second year of treatment. This complicates the efficacy interpretation of DMTs.1 Also, technical factors, such as imaging variability between sites and across MRI machines, tissue contrast ratio, signal to noise ratio, artefacts and resolution; and biological factors, including hydration state1 and diurnal variation in WBV,21 can influence the accuracy of WBV measurements. Patient comorbidities, such as smoking, also affect WBV.22
Future advances in postprocessing imaging technology that ‘correct’ for biological, technical and treatment-related factors will facilitate the transition of this biomarker from clinical trials to routine clinical practice. The utility of the fully automated cross-sectional measures described here, referenced to appropriate healthy control databases, should be further explored as a prognostic tool in MS.
Acknowledgments
The authors would like to thank patients from whom MRIs were taken for analysis. The authors would like to thank Avinash Thakur and Rishard Salie (Novartis, Medical communications), respectively, for writing assistance, editorial review assistance and in co-ordinating author reviews. All authors edited the manuscript for intellectual content, provided guidance during manuscript development and approved the final version submitted for publication.
References
Footnotes
Contributors All authors made substantial contributions to the design of the work and interpretation of data. All authors significantly contributed to drafting the work and providing comments during draft development. MHB, DGS and DT conceived the study. CW and SNH developed the imaging protocols and performed MRI analysis; HNB collected all clinical data; GB performed statistical testing; and all authors made significant contributions to data analysis and interpretation.
Funding Funded by Novartis Pharma AG, Basel, Switzerland.
Competing interests MHB has received institutional support from Novartis, Biogen and Genzyme. GB, DT and DGS are employees of Novartis Pharma AG.
Ethics approval University of Sydney HREC.
Provenance and peer review Not commissioned; externally peer reviewed.