Article Text

Abstract
Huntington’s disease (HD) is a hereditary disorder that typically manifests in adulthood with a combination of motor, cognitive and psychiatric problems. The pathology is caused by a mutation in the huntingtin gene which results in the production of an abnormal protein, mutant huntingtin (mHtt). This protein is ubiquitously expressed and known to confer toxicity to multiple cell types. We have recently reported that HD brains are also characterised by vascular abnormalities, which include changes in blood vessel density/diameter as well as increased blood–brain barrier (BBB) leakage.
Objectives Seeking to elucidate the origin of these vascular and BBB abnormalities, we studied platelets that are known to play a role in maintaining the integrity of the vasculature and thrombotic pathways linked to this, given they surprisingly contain the highest concentration of mHtt of all blood cells.
Methods We assessed the functional status of platelets by performing ELISA, western blot and RNA sequencing in a cohort of 71 patients and 68 age- and sex-matched healthy control subjects. We further performed haemostasis and platelet depletion tests in the R6/2 HD mouse model.
Results Our findings indicate that the platelets in HD are dysfunctional with respect to the release of angiogenic factors and functions including thrombosis, angiogenesis and vascular haemostasis.
Conclusion Taken together, our results provide a better understanding for the impact of mHtt on platelet function.
This is an open access article distributed in accordance with the Creative Commons Attribution Non Commercial (CC BY-NC 4.0) license, which permits others to distribute, remix, adapt, build upon this work non-commercially, and license their derivative works on different terms, provided the original work is properly cited, appropriate credit is given, any changes made indicated, and the use is non-commercial. See: http://creativecommons.org/licenses/by-nc/4.0/
Statistics from Altmetric.com
Introduction
Huntington’s disease (HD) is an autosomal dominant neurodegenerative disorder that is defined by a cytosine, adenine, guanine (CAG) repeat expansion in exon 1 of the huntingtin gene leading to the production of mutant huntingtin (mHtt). Over time, this protein accumulates in neurons causing dysfunction and death, which leads to a progressive disorder of movement and cognition along with psychiatric problems. Although the disease has long been considered a disorder of the brain, abnormalities outside the central nervous system are commonly observed in HD.1
Blood cells have been extensively studied in the disease, especially in the era before the gene was identified in 1993. The collected data suggests that (1) red blood cells (RBC) have subtle membrane alterations which lead to metabolic dysfunctions; (2) white blood cells are characterised by mitochondrial dysfunction, increased apoptosis and autophagic features as well as transcriptional dysregulation; (3) there are alterations in the release of immunomodulatory cytokines associated with monocytes and macrophages; and (4) there are inconsistent reports of abnormal protein aggregation and mitochondrial/metabolic disruption in platelets (see review of Sassone et al 2). More recent studies have shown that mHtt is found within immune cells such as polymorphonuclear (PMN) leucocytes and peripheral blood mononuclear cells (PBMC), at levels that correlate with disease progression.3 However, the presence and function of mHtt in RBC or platelets in HD has not been established.
We, and others, have reported that there are changes in cerebrovascular vessel density in patients with HD as well as in transgenic mouse models of the disease4 5 which is further accompanied by measurable blood vessel leakage. More recent reports have established that there is transcriptional dysregulation of tight junction proteins, leading to increased permeability of blood vessels, which precedes the manifestation of pathological hallmarks of the R6/2 mouse model of the disease.6
The main functions attributed to platelets could explain some of the anomalies related to vascular permeability, inflammation, thrombosis and angiogenesis in HD.7 8 For example, the activation of platelets after exposure to stress causes the fusion of their granules to the membrane, which provokes the release of a number of bioactive molecules involved in hemostasis, immunity and tissue repair.9 Although platelets maintain vascular integrity in normal as well as in inflammatory conditions,10 11 their role in the permeability of the vasculature may differ depending on the vascular bed involved and the nature of the inflammation. Hence, in murine models of inflammatory arthritis, it has been demonstrated that platelets increase inflammation by facilitating vascular permeability.12 Platelets are also the main physiological transporters of proangiogenic and antiangiogenic factors.13 Proangiogenic factors are implicated in early and advanced stages of angiogenesis, for example, in the stabilisation of newly formed vessels14 and antiangiogenic factors can inhibit megakaryocytopoiesis in experimental models.15 16 The well-documented role of platelets in angiogenesis has recently been highlighted in cancer where tumour-corrupted platelets seemingly secrete more angiogenic factors.17
Given all this, we sought to investigate whether the pathological protein mHtt can alter the normal function of platelets and interfere with their role in the control of vascular permeability, angiogenesis, inflammation and haemostasis (figure 1).
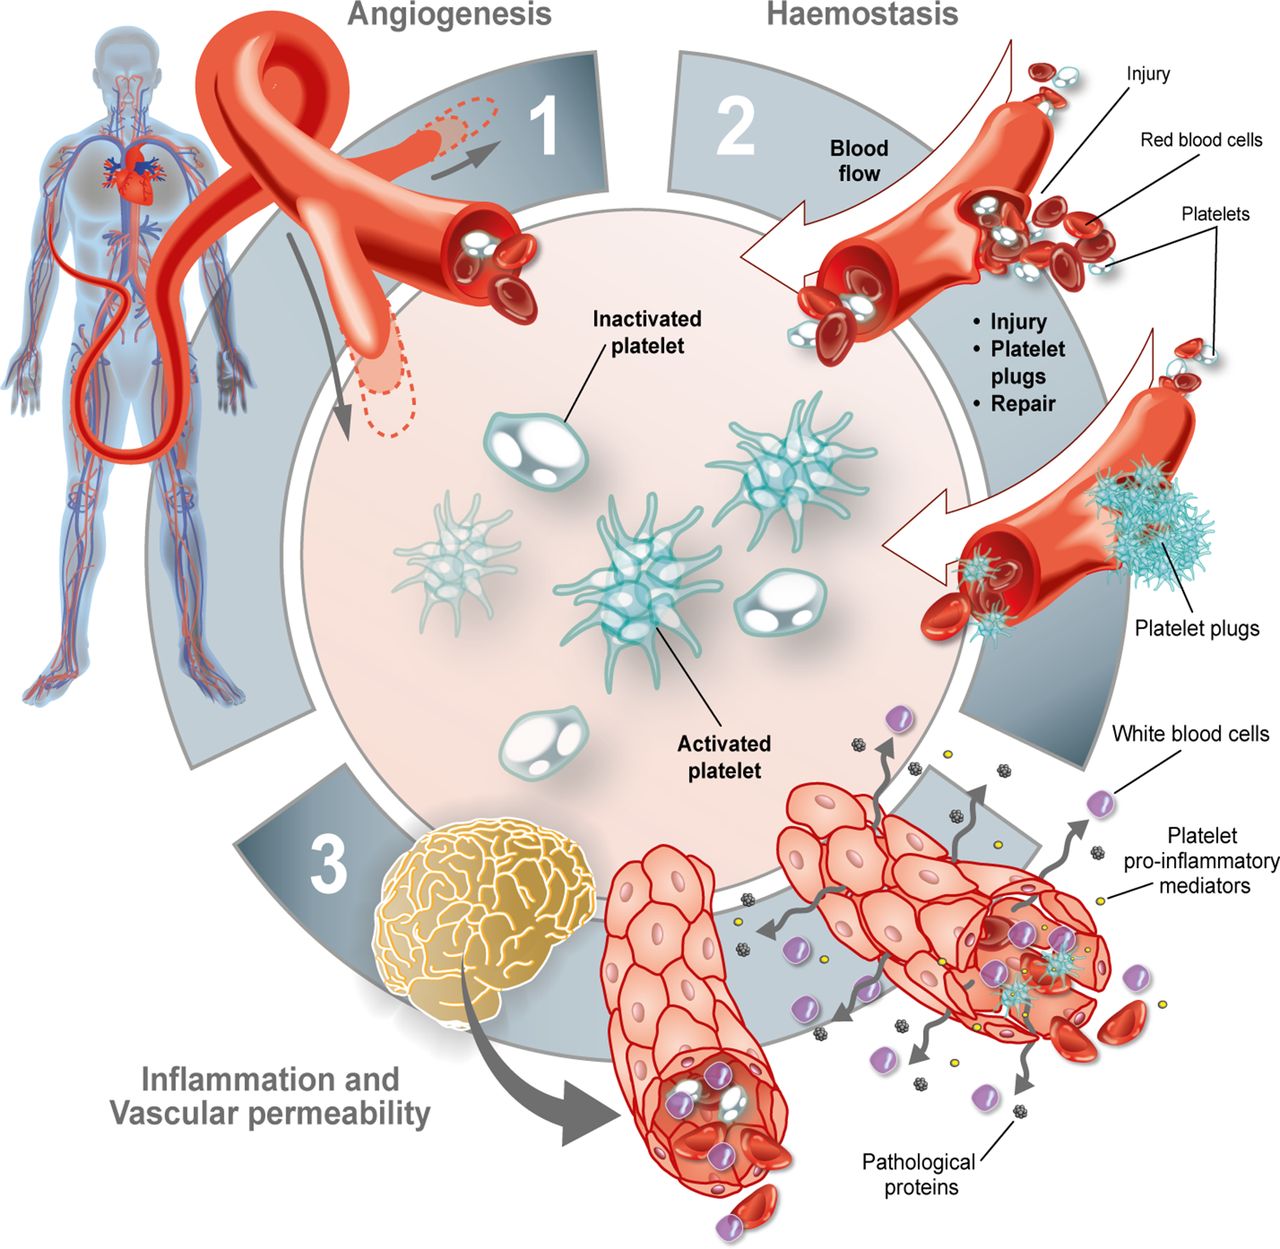
Roles of platelets. Platelets are primarily involved in (1) angiogenesis, (2) haemostasis and (3) inflammation—all of which can contribute to vascular permeability.
Materials and methods
Ethic statement and participant recruitment
All work with human subjects was approved by local review boards and in accordance with the Declaration of Helsinki. Informed written consent was obtained from all participants.
Cohorts were recruited in Cambridge (UK), Quebec and Montreal (Canada). Blood samples were collected from patients with HD at all stages of disease (n=71) along with age- and sex-matched healthy control subjects (n=68) for a total of 139 participants (table 1). HD sample distribution contained premanifest (n=15), stage one (n=17), stage two (n=15), stage three (n=13), stage four (n=10) and stage five (n=1); patients and the mean size of the longer CAG repeat length was 41±3.7. Their clinical evaluation included the Unified Huntington Disease Rating Scale (UHDRS) and Total functional capacity (TFC) and calculated values for burden of disease scores (BDS). All clinical evaluations were conducted within six months of blood sampling. Participants were further asked to fill out a questionnaire related to health issues and medication and a full blood count was performed in all patients on the day of blood sampling. Comorbidities were determined from medical information reported by the participant or caregiver (see table 1).
Participant clinical information
Preparation of blood cells and platelet-free plasma (PFP)
Red blood cells (RBC)
RBC were prepared as previously described.18 For protein isolation, RBC were thawed at room temperature. Hundred and fifty µL of RBC was washed with 50 µL of hypertonic 9% NaCl solution for 10 min. We added 1300 µL of 2.5% NaCl solution and centrifuged at 1200×g for one min. Pellets were then washed once with 1400 µL of 2.5% NaCl solution and three times with 1400 µL of 0.85% NaCl solution. Every time, washed RBC was pelleted at 1200×g for one min. The final RBC pellet was resuspended in 100 µL of lysis buffer (Thermo Scientific, Pierce IP Lysis Buffer: 87788) with protease and phosphatase inhibitors (Thermo Scientific, Halt Protease and Phosphatase Inhibitor Cocktail 100X: 78440) and stored at −80°C.
Peripheral blood mononuclear cells
Blood was collected in heparin-coated tubes (BD Vacutainer: 367880) and centrifuged for 10 min at 282×g at room temperature. Cell pellets were washed in phosphate buffered saline (PBS) with 2% fetal bovine serum prior to peripheral blood mononuclear cell (PBMC) isolation according to the SepMate protocol (StemCell: 15460). PBMC proteins were dissolved in 200 µL of lysis buffer with protease and phosphatase inhibitors and stored at −80°C.
Platelets
Citrate-coated tubes (BD Vacutainer 369714) were centrifuged for 10 min at 282×g at room temperature. The platelet-rich plasma and the activated-platelet supernatants were collected as previously described.19 All samples were stored at −80°C.
Platelet-free plasma (PFP)
Citrate-coated tube (BD Vacutainer: 369714) supernatants were centrifuged twice for 15 min at 2500×g at room temperature. PFP was harvested and stored at −80°C within two hours of sampling according to previously published guidelines.20
Protein quantification by western blot
Twenty µg of platelets, 40 µg of RBC and 20 µg PBMC proteins or 106 activated and resting platelet proteins were mixed with 1× dithiothreitol (DTT), 5× sample buffer and sufficient water to make up a final volume of 30 µL. Samples were migrated on a 3%–8% tris-acetate gel for one hour and 45 min at 100 V and then transferred onto a 0.45 µm polyvinylidene difluoride membrane (GE Healthcare Life Science: 10600023) overnight at 20 V followed by a boost to 100 V for 20 min. All membranes were washed in PBS-Tween 0.1% and blocked by preincubation in a solution of 5% skimmed milk, 0.5% bovine serum albumin (BioShop Canada: ALB001) for one hour. Membranes were subsequently incubated overnight at 4°C with primary antibodies. Platelet, RBC and PBMC membranes were incubated with mouse anti-total huntingtin (Htt) (1:1000, Millipore Sigma: mab2166), mouse anti-polyQ (1:1000, Millipore Sigma: mab1574) and glyceraldehyde 3-phosphate dehydrogenase (GAPDH) (1:5000, abm: G041). Membranes were washed with PBS-Tween 0.1% and incubated with the corresponding secondary antibody conjugated with horseradish peroxidase: goat antimouse (1:25000, Jackson ImmunoResearch: 115-035-166) for one hour at room temperature. Membranes were visualised by myECL imager (Thermo Fisher Scientific, Waltham, Massachusetts, USA) after a two min incubation in chemiluminescence reagents (Immobilon Luminata Forte, EMD Millipore: WBLUF0500). Semiquantitative analyses of the western blots were performed using ImageJ software (NIH, Bethesda, Maryland, USA) in which membranes were analysed and band intensities were expressed as a ratio of protein of interest against GAPDH (housekeeping gene).
RNA sequencing
For analyses relating to RNA sequencing (RNA-seq), we controlled the purity of our platelet samples by depleting them in RBC and leucocytes, using magnetic microspheres. Briefly, we collected whole blood in ACD clinical tubes and obtained plasma-rich in platelets (PRP) by centrifuging samples for 10 min at 280 g to remove RBC and then two min at 400 g to remove leucocytes. We then added 10 µL of prostaglandin E1 (PGE1) buffer/mL of PRP (one mg of PGE1, Cayman Chemical: 13010.1) suspended in 940 µL dimethyl sulfoxide three mM (Sigma-Aldrich: 472301) and adding 90 µL PIPES-saline-glucose (PSG) (five mM PIPES, Sigma-Aldrich: P-3768; 145 mM NaCl; four mM KCl; 50 mM Na2HPO4; one mM MgCl2-6H2O; and 5.5 mM glucose) to 10 µL aliquot (300 µM) and centrifuging for five min at 1300 g. Pellet was resuspended in warm PSG containing fresh aliquot of PGE1 (10 µL/mL PSG) and we added 15 µL of MACS CD235a (glycophorin A) MicroBeads (Miltenyi Biotec MACS Beads: 130-050-501) or MACS CD45 MicroBeads (Miltenyi Biotec MACS Beads: 130-045-801) for 20 min at room temperature with intermittent mixing. We then performed the magnetic separation according to the manufacturer’s instructions. The final pellet was resuspended in one mL of TRIZOL (TRI Reagent, Sigma-Aldrich: T9424-100mL). Finally, we quantified the remaining contaminants in 50 µL aliquot of the platelet pellet by immunofluorescence. An anti-CD41-PE antibody (1/30, BD Pharmingen: 561850) was used to identify platelets; a CD235a-FITC antibody (1/30, BD Pharmingen: 559943) was used to identify RBC and 4′,6-diamidino-2-phenylindole (1/50, Molecular Probes: D3571) to differentiate leucocytes. Quantifications confirmed that the samples were devoid of leucocytes and that RBC were present in less than 2% (data not shown).
RNA-seq libraries were prepared with Illumina TruSeq Stranded mRNA prep kit with poly-A selection (Illumina: 20020595), and 50 base single-end reads sequenced on an Illumina HiSeq. Reads were aligned to human genome build hg38/GRCh38 using NovoAlign (Novocraft Technologies). Reads were assigned to transcripts and differential expression and significance testing with the USeq21 and DESeq222 analysis packages. Resulting data was standardised, hierarchically clustered and visualised as a heatmap by using the statistical framework R.23 The robustness of the nodes was evaluated by computing approximately unbiased (AU) p values using the R package pvclust (10 000 bootstraps, average method and correlation-based dissimilarity matrix).24
Reverse transcription followed by quantitative polymerase chain reaction analysis (RT-qPCR)
All confirmatory PCR analysis was carried out under RNase-free conditions. Platelet samples, from patients not used for RNA sequencing, in TriReagent were used to extract total RNA using the phenol/chloroform technique, as previously described.25 DNAse treatment was performed using 1× DNAse (Sigma-Aldrich: 4716728001) for 30 min at 37°C. RNA was reverse transcribed to cDNA by incubation with one µL of 10 mM deoxyribonucleotide triphosphates with 0.3 µL of random primer (1.6 µg/µL, Sigma-Aldrich: 11034731001) for five min at 65°C. After incubation, samples were placed on ice and four µL of moloney murine leukemia virus (MMLV) buffer 4×, two µL of 100 mM DTT and 200 U of MMLV reverse transcriptase (Thermofisher: 28025013) were added and incubated for 60 min at 37°C and then for 10 min at 70°C. RT-PCR using Master Mix SybrGreener (Thermofisher: 11762100) was performed in the Corbett Rotor Gene. The PCR reaction consisted of 10 µL Master Mix SybrGreener, one µL of primers (online supplementary figure 1A), six µL of demineralised water and 60 ng of previously prepared cDNA. Samples were amplified according to the following programme: initial denaturation for 10 min at 95°C, followed by 40 cycles of 15 s at 95°C and 60 s at optimal annealing temperature (between 55°C and 61°C; online supplementary figure 1A). Subsequently, a dissociation curve (melting curve) analysis was applied with one cycle at 95°C for 15 s, 60°C for one min and 0.5°C ramp rate to 95°C to confirm specific amplification. PCR efficiency (E) and coefficients of determination (R2) for each primer are also shown in the online supplementary figure 1A and were determined using five serial two fold dilution points where Ct(s) were plotted versus the logarithm of dilution.26 Minus RT controls, which were included for each run, were uniformly negative. Analysis of relative gene expression data was done using the 2−ΔΔC t method as previously described27 and GNAS gene was used as the reference gene (online supplementary figure 1B).
Supplemental material
ELISA for angiogenic factors, chemokine platelet factor 4 (PF4) and serotonin
The concentrations of angiogenic factors were measured in platelet and activated-platelet supernatants using the Q-Plex Human Angiogenesis (9-Plex) Kit (Quansys Biosciences: 150249HU). Q-Plex analyses were performed by chemioluminescence with a myECL imager (Thermo Fisher Scientific). After several exposures (15 s, 30 s, 1 min, 2 min, 5 min), concentration was measured with the optimal time exposure (2 min) using Quansys Biosciences analysis software. The concentrations of PF4 and serotonin were determined in activated-platelet supernatants using the Human PF4 ELISA kit (Abcam: ab189573) and the serotonin ELISA kit (Enzo: ADI900-175), respectively. Absorbance values were measured at 450 nm using a multidetection microplate reader (Synergy HT; BioTek; Winooski, Vermont, USA). All ELISA tests were performed according to the manufacturer’s instructions.
Animal studies
The following HD mice models were used: zQ175 and R6/2 mice both purchased from The Jackson Laboratory (Bar Harbor, Maine, USA). Tissues from ear biopsies were genotyped in-house. Animal handling, testing and other procedures were carried out in accordance with the UK Animals (Scientific Procedures) Act of 1986 and with the appropriate Home Office Personal and Project Licenses or in accordance with the Canadian Guide for the Care and Use of Laboratory Animals, which were approved by the Institutional Policy of the Centre de recherche du CHU de Quebec (Quebec, Quebec, Canada). For all experiments, nine-month-old zQ175 mice and R6/2 mice aged four–13 weeks were used.
Electron microscopy
Freshly washed platelets from nine-month-old zQ175 mice were pelleted at 1300×g for five min and prepared as previously described28 using the mouse anti-mHtt (1:500, Millipore Sigma: mab5374). Control conditions in which the primary antibody was omitted were further performed. The regions of interest were cut and glued onto a resin block. Ultrathin sections of ~70 nm were obtained with a Leica UC7 ultramicrotome and collected on mesh grids. Imaging was performed with a FEI Tecnai Spirit G2 transmission electron microscope at 80 kV.
Homeostatic test using tail bleed
R6/2 and wild type (WT) mice were anaesthetised with isoflurane (between six and 15 animals per group; exact number provided in appropriate figure legend). Five mm of the distal tail was amputated and immersed in 0.9% isotonic saline at 37°C. The time to cessation of bleeding was recorded as the bleeding time. With haemoglobin (Hb), absorbance of each sample was measured spectrophotometrically using a microplate reader at 450 nm (Synergy HT; BioTek). Hb absorbance was directly related to blood volume loss by using a standard curve with a 50 µL blood mandibular sample.
Hematoxylin and Eosin (H&E) staining
R6/2 and WT mice were perfused with paraformaldehyde (PFA) 4% (n=4 per group). Tails were collected and put in PFA 4% for two days at 4°C and transferred to a decalcifying solution (20% EDTA solution, pH 7.4) for 10 days at 4°C. Medium was then changed to preservation solution (20% sucrose). Five mm of the distal tail was cut into 10 µm-thick sections using a cryostat. H&E staining was subsequently performed as previously described29 to assess tail vasculature.
Platelet depletion
Thrombocytopenia was induced at nine weeks of age in R6/2 and WT mice via intravenous administration of the platelet-depleting antibody R301 (polyclonal antimouse GPIbα rat IgG, Emfret Analytics) (WT, n=5; R6/2, n=10). Additionally, nine-week-old R6/2 and WT mice were injected with a non-immune rat polyclonal IgG C301 (Emfret Analytics) as an experimental control (WT, n=5; R6/2, n=10). Two administrations were performed three days apart with four µg/g bodyweight for the first injection and two µg/g bodyweight for the second injection. Six days following the initiation of the protocol, mice were sacrificed and blood collected to evaluate thrombocytopenia. A single repetition of the protocol was performed.
Behavioural measures using open field
Locomotor activity was evaluated using an open field system (San Diego Instruments) consisting of 10 Plexiglas chambers (40×40 cm) over a one-hour session. Horizontal voluntary fine and ambulatory movements, distance travelled, time spent in each delimited space and the number of entries into each of these areas was detected using a photobeam activity system.
BBB leakage
Mice were injected with Evans Blue (2%, four µL/g) by injection into the caudal vein 30 min before perfusion. Cerebellum was weighed and then homogenised in 0.75 mL of PBS and 0.25 mL of 100% trichloroacetic acid solution (to precipitate macromolecular compounds such as the nucleoprotein) using an electronic homogeniser (Sonic Dismembrator Model 100; Thermo Fisher Scientific). Samples were cooled overnight at four degree and centrifuged for 30 min at 1000×g at 4°C. Quantities of Evans Blue in the supernatants of each sample was subsequently measured at 620 nm using a 96-well plate reader in 100 µL of sample. All obtained values were within the range of detection established by the standard curve. The dye concentration was calculated as the ratio of absorbance relative to the amount of tissue.
Quantification of several proteins involved in BBB leakage was further performed using western blot analysis. Mouse striatum and cerebellum samples were processed according to previously published protocols.4 Western blot analysis was conducted using the same method as described for the human samples, and proteins were detected using rabbit claudin-5 (1:1000, Millipore-Sigma: ABT45) or rabbit occludin (1:1000, LifeSpan BioSciences Inc: LS-0108451).
Statistical analysis
For table 1, comparisons between groups were determined using unpaired t-tests when data followed normal distribution (Shapiro-Wilk test) and or Mann-Whitney in cases of non-normality. Two-way analysis of variance (ANOVA) followed by Tukey’s multiple comparisons test (**p<0.01, ****p<0.0001) was performed for analyses presented in figure 2A. In figure 2B, data followed normal distribution and was analysed using a one-way ANOVA. In figures 2C–4, comparisons between groups were performed using a Kruskal-Wallis test followed by Dunn’s multiple comparison test (*p<0.05; **p<0.01; ***p<0.001). For analyses pertaining to figures 3 and 4, the ratio activated/inactivated platelets was expressed and compared with a theoretical median setting of one using the Wilcoxon signed-rank test. In figure 5A, comparison between groups was performed using a two-way ANOVA followed by Sidak multiple comparison test. For figure 5B, comparisons between groups were determined using unpaired t-tests when data followed normal distribution (Shapiro-Wilk test) and or Mann-Whitney in cases of non-normality. For figure 6, comparisons between groups were performed using a Kruskal-Wallis test followed by Dunn’s multiple comparison test (*p<0.05; **p<0.01; ***p<0.001). All statistical analyses were performed using Prism V.6.0 (GraphPad Software, LaJolla, California, USA) or JMP V.13 (JMP Software, SAS Institute, Cary, North Carolina, USA). Power analysis using G*Power V.3.0 software was performed for all data sets included in this manuscript.

(A) Representative western blot analyses of Htt (mab2166) and anti-polyQ (mab1574) in blood cells. mHtt protein is enriched in platelets compared with blood leucocytes and RBC in patients with HD. PBMC and RBC (hCTRL, n=6; pre-HD, n=6; stage 1–2, n=6; stage 3–4, n=6). (B) Numbers of platelets in hCTRL, pre-HD and patients with HD showed no statistical difference between groups (hCTRL, n=54; pre-HD, n=10; HD, n=50). RNA sequencing of platelets from patients with HD and healthy control group was performed and (C) annotation clustering and heatmap analysis of correlations between disease state and the abundance of the variable RNA (hCTRL, n=5; pre-HD, n=2; HD, n=2). Cold and hot colours represent low and high correlation levels, respectively. Seven RNAs significantly varied between healthy control group and patients with HD and these differences were confirmed by reverse transcription PCR (hCTRL, n=13; pre-HD, n=5; stage 1–2, n=5; stage 3–4, n=2;) (D). Statistical analyses: (A) two-way analysis of variance (ANOVA) followed by Tukey’s multiple comparisons test (**p<0.01, ****p<0.0001); (B) one-way ANOVA, (C.) Kruskal-Wallis with Dunn’s multiple comparison test (*p<0.05, SLC25A43, power statistic=0.71; SLC25A39, power statistic=0.97; SLC25A39, power statistic=0.80; HBG1, power statistic=0.72; HBG2, power statistic=0.95; HBA1, power statistic=0.42; HBA2, power statistic=0.31). HBA1/2, haemoglobin subunit alpha 1/2; HBG1/2, haemoglobin subunit gamma 1/2; hCTRL, healthy control group; Htt, Huntingtin; HD, Huntington’s disease; PBMC, peripheral blood mononuclear cell (lymphocytes and monocytes); pre-HD, premanifest; RBC, red blood cells; RNA, ribonucleic acid:SLC25A43-39-37, solute carrier family 25 member 43-39-37.

(A) Representative western blot analyses of polyQ (mab1574) and total Htt (mab2166) that were quantified in the pellet of resting platelets (B) as well as platelets activated with 5 µg/mL collagen (C) or 0.5 U/mL thrombin (D) (hCTRL, n=8; pre-HD, n=8; stage 1–2, n=7; stage 3–4, n=7). (E) Representative transmission electron microscopy images of mHtt aggregates using EM48 antibody (1:500, Millipore Sigma: mab5374) as detected in platelets of zQ175 mice. (F) Photomicrograph of the control condition in which platelets from zQ175 mice underwent identical staining but with the omission of the primary antibody. Scale bar= 250 nm. Statistical analyses: Kruskal-Wallis with Dunn’s multiple comparison (*p<0.05, ***p<0.0001) and Wilcoxon signed rank test with theoretical median set at 1 (#p<0.05). hCTRL, healthy control group; HD, Huntington’s disease; Htt, Huntingtin; mHtt, mutant Htt; OCS, open-canalicular system; pre-HD, pre-manifest; α, alpha granule.
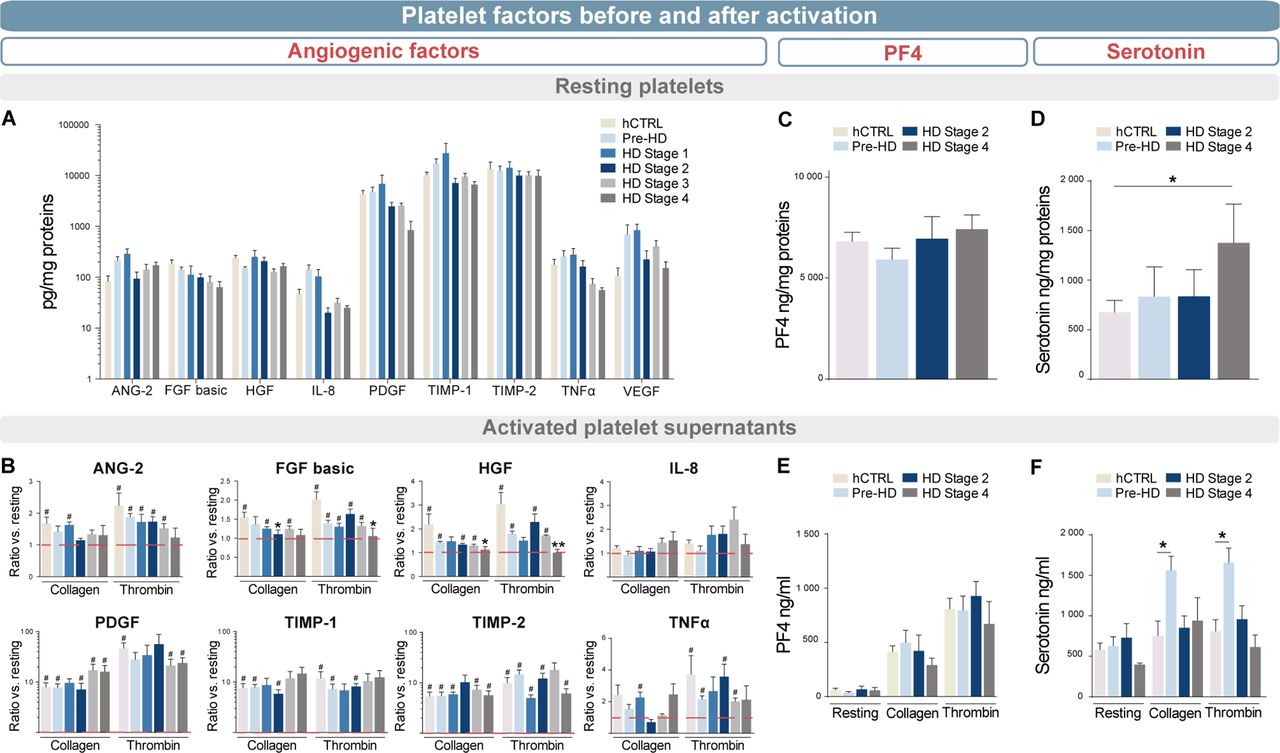
ELISA quantified mediators of angiogenesis in (A) purified platelets and (B) media after activation of 108 platelet/mL with collagen or thrombin compared to the resting state. Platelets and media from different HD stage patients were compared with pre-HD and hCTRL (stage 1, n=5; stage 2, n=5; stage 3, n=5; stage 4, n=4; pre-HD, n=5; hCTRL, n=6). The release of both (C) serotonin and (D) PF4 was quantified by ELISA in the activated-platelet media from different HD stage patients, pre-HD and hCTRL (stage 2, n=4; stage 4, n=4; pre-HD, n=8; hCTRL, n=9). Statistical analyses: Kruskal-Wallis with Dunn’s multiple comparison test (*p<0.05, **p<0.01) and Wilcoxon signed rank test with theoretical median set at 1 (#p<0.05). ANG-2, angiopoietin-2; FGF basic, basic fibroblast growth factor; hCTRL, healthy control group; HD, Huntington’s disease; HGF, hepatocyte growth factor; IL-8, interleukin 8; PDGFR, platelet-derived growth factor; TIMP-1, metalloproteinase inhibitor 1; TIMP-2, metalloproteinase inhibitor 2; TNFα, tumour necrosis factor; pre-HD, pre-manifest.
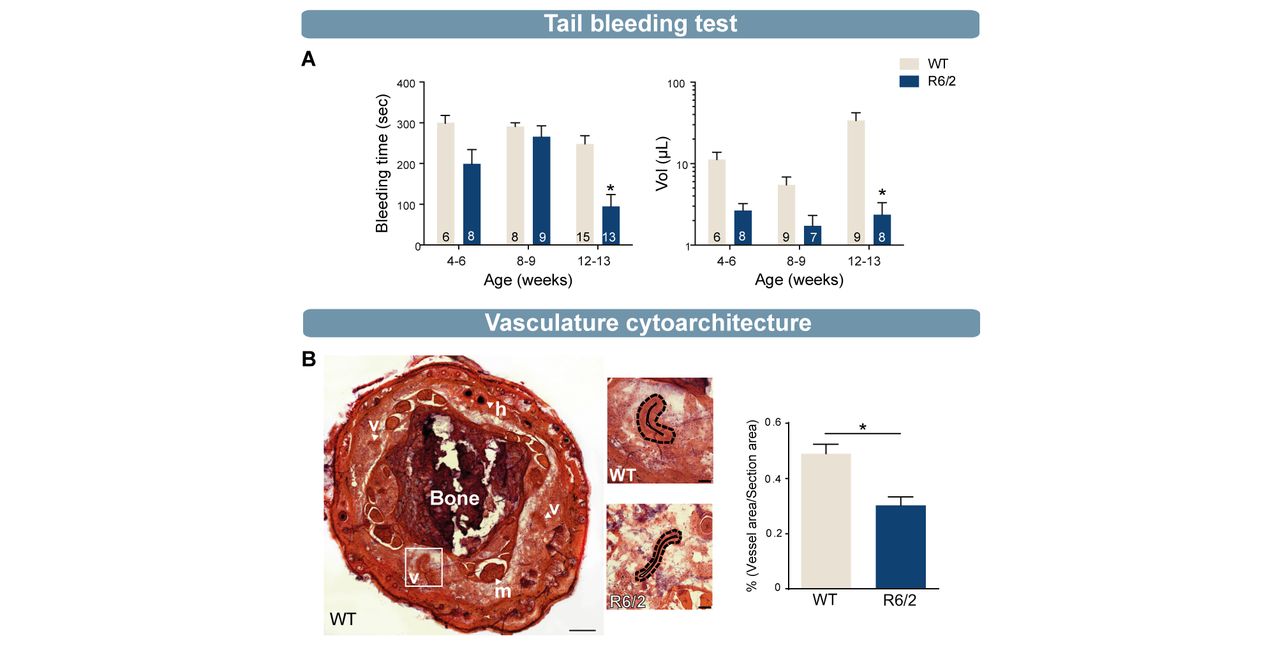
(A) Tail bleeding test revealed a significant decrease in bleeding time and blood volume in old (12/13 weeks) R6/2 mice compared with WT mice (bleeding time: 4–6 weeks, WT=6, R6/2=8; 8–9 weeks, WT=8, R6/2=9; 12–13 weeks, WT=15, R6/2=13; lost blood volume: 4–6 weeks, WT=6, R6/2=8; 8–9 weeks, WT=9, R6/2=7; 12–13 weeks, WT=9, R6/2=8). (B) H&E staining and quantification of blood vessels in 12-week-old R6/2 mice showed a significant decrease of vessel density compared with 12-week-old WT mice (R6/2, n=4; WT, n=4). Statistical analysis: two-way analysis of variance followed by Sidak multiple comparison test (A) and Mann-Whitney test (*p<0.05) (B). B, bone; h, hair; H&E, hematoxylin eosin; m, muscle; v, vessel, WT, wild type.

(A) Timeline of platelet depletion protocol with antiplatelet antibody (R-300) or non-immune antibodies (C-301) administered to 9-week-old WT or R6/2 mice. (B) Illustration of depletion protocol. (C) Number of platelets in undepleted (+) or depleted (−) WT and R6/2 mice (+WT, n=5; −WT, n=5; +R6/2, n=10; −R6/2, n=10). Platelet depletion was successful given that no platelets were found in depleted mice. (D) Open field test results indicated that there was no significant difference between depleted or undepleted mice. (E) Permeability of BBB using EB injection before sacrifice of mice demonstrated a significant increase of permeability in the cerebellum of undepleted R6/2 mice compared with WT and depleted R6/2 mice. No difference was observed in the cortex (data not shown). (F) Western blot analysis showed a decrease of claudin-5, a tight junction protein involved on BBB homeostasis, in undepleted R6/2 striatum that was normalised by platelet depletion. Statistical analyses: Kruskal-Wallis test followed by Dunn’s multiple comparison test (*p<0.05, **p<0.01). BBB, blood–brain barrier; EB, Evans blue; Plts, platelets, WT, wild type.
Results
Our first measure of interest was to determine mHtt levels in blood cells. Western blotting analysis revealed a higher ratio of mHtt/Htt specifically in platelets when compared with RBC and PBMC, a finding that was seen at all stages of disease (*p<0.05, **p<0.01, ****p<0.0001, power statistic=0.88, figure 2A). However, platelet counts generated by full blood work did not reveal any differences in the number of cells between groups (p=0.1485, power statistic=0.87, figure 2B). Indeed, healthy control subjects, premanifest, stages 1, 2, 3 and 4 all had platelet counts within a normal range (around 236×109 cells/L). We subsequently undertook a transcriptomic study to identify potential RNAs that may have been affected by the presence of mHtt. Next-generation RNA-seq of platelet RNA from disease and healthy control subjects detected over 17 000 RNAs, of which only seven were significantly differentially expressed in isolated platelets from patients with HD as compared with matched healthy control subjects (figure 2C, adjusted p<0.1 and fragments per kilobase of transcript per million mapped reads >3). These included three from the family of mitochondrial transporters (SLC25) including SLC25A37, SLC25A39 and SLC25A43 and four RNAs generally considered of erythrocytic origin, that is, gamma globin subunits 1 and 2 (HBG1, HBG2) and haemoglobin alpha subunits one and two (HBA1 and HBA2). Because of small sample size (two premanifest, two stages 3–4 and five healthy control subjects), we next validated our results using RT-qPCR (five premanifest, five stages 1–2, two stages 3–4 and 13 healthy control subjects, figure 2D) to examine the expression of these mRNAs from the family of SCL25A, as well as expression for HBG2 which was significantly enriched in platelets from patients with HD as compared with healthy control group (figure 2D, *p<0.05, power statistic ≥0.80 except for HBA1, HBA2).
We set out to investigate the impact of elevated mHtt levels on the functionality of platelets. We first evaluated concentration levels of total Htt and mHtt by western blot on activated or non-activated (eg, resting) platelets (figure 3A). Results indicated a stage-dependent increase of mHtt, with a higher ratio of mHtt/Htt in patients of stages 3–4 (***p<0.001, power statistic=0.99). Levels of total Htt were similar in resting platelets between patients with HD and healthy control subjects (figure 3B, *p<0.05, ***p<0.001, total Htt, power statistic=0.71). In comparison, levels of total Htt decreased in healthy control subjects, but not in patients with HD, when platelets were activated with thrombin or collagen (figure 3C–D, #,*p<0.05, power statistic ≥0.80). Analyses performed by electron microscopy in the zQ175 transgenic mouse model of HD uncovered that mHtt is primarily located within cellular membranes, alpha granules and open-canalicular systems within platelets (figure 3E; see figure 3F for control condition).
Platelets are also known to play a key role in angiogenesis. They express, and can release, a number of specific angiogenic factors and as such, we evaluated the expression of angiopoietin-2, fibroblast growth factors basic (FGF basic), hepatocyte growth factor (HGF), interleukin-8, platelet-derived growth factor, tissue inhibitor of metalloproteinases 1 (TIMP-1), TIMP-2, tumour necrosis factor alpha and vascular endothelial growth factor using an ELISA kit. mHtt load did not interfere with the concentration of angiogenic factor in resting platelets derived from patients with HD (figure 4A, power statistic ≥0.80). However, HD platelets released less FGF basic and HGF proteins when they were activated as compared with the healthy control group (figure 4B, # , *p<0.05, power statistic ≥0.75). We then evaluated whether mHtt load could preferentially impact alpha granule content release (measured by analysing the chemokine PF4 (CXCL4)) and/or whether it could impact on dense granule (measured by serotonin concentrations). We dosed PF4 and serotonin in non-activated platelets (figure 4C–D) as well as contents excreted in the supernatant of activated platelets (figure 4E–F). In contrast to PF4, serotonin was found in significantly greater quantities in platelets of patients with advanced HD (figure 4D, *p<0.05, power statistic=0.80). When platelets were activated in late-stage patients, they did not release more serotonin than healthy control individuals. Premanifest patients showed the highest rate of release of serotonin (figure 4F, *p<0.05, power statistic=0.99).
Platelets are central effector cells in haemostasis and thrombosis. R6/2 mice, were employed to better understand how platelets influence haemostasis in HD. Mice underwent a tail ablation of 5 mm following which blood flow, both time and volume of blood retrieved were measured. At four and eight weeks of age, which corresponds to a premanifest phase of the disease clinically, tail bleeding times and blood volume did not score differently in HD mice compared with WT mice. However, at 12 weeks of age, when R6/2 mice exhibited a full-blown HD behavioural phenotype, blood volumes and bleeding time were significantly decreased in comparison to WT mice (figure 5A, *p<0.05, power statistic ≥0.80). To understand whether decreased tail bleeding in R6/2 mice is related to accelerated thrombosis formation within the vasculature, we examined the cytoarchitecture of tail blood vessels from the tail in WT and R6/2 mice at 12 weeks of age. Using standard H&E staining, we observed that the vascular network occupied a significantly smaller area in HD mice than WT (figure 5B, *p<0.05, power statistic=0.97) and hypothesised that thrombosis failure in R6/2 mice may therefore relate to an abnormality in the vasculature.
We subsequently performed a depletion protocol in R6/2 mice to evaluate whether total platelet loss could improve phenotypic features of HD. To do this, we used the R300 antibody that we delivered i.p. twice, 3 days apart in 9-week-old R6/2 and WT mice compared with R6/2 and controls that were injected with non-immune antibodies (C-301) (figure 6A–B). Analysis of blood samples confirmed the absence of platelets in R300 treated animals (figure 6C, *p<0.05, **p<0.01, power statistic=1). Using the open-field behavioural test, we identified a significant difference between controls and R6/2 mice in the number of rearing episodes, increased anxiety and decreased of distance travelled (figure 6D, *p<0.05, **p<0.01, power statistic ≥0.75). However, platelet depletion did not improve motor skills nor cognition in R6/2 mice, at least with the behavioural measures performed here over this short period of depletion.
Finally, we evaluated the impact of mHtt-expressing platelets on BBB permeability. Evans blue was injected one hour before mice were sacrificed and was quantified by spectrophotometry in homogenate fraction of both the cerebellum and cortex. Measures obtained showed a decrease in Evans blue concentration in depleted R6/2 mice compared with undepleted R6/2 mice at the level of the cerebellum (figure 6E, *p<0.05, power statistic=0.99). Western blot analysis further revealed a significant increase in claudin-5 in the striatum of depleted R6/2 mice compared with undepleted R6/2 mice (figure 6F, **p<0.01, power statistic ≥0.91). These findings suggest that platelets may underlie, at least in part, some of the BBB abnormalities found in HD.
Discussion
We conducted an exhaustive analysis of platelets in a cohort of 71 well-phenotyped patients with HD, at all disease stages, and 68 age- and sex-matched healthy control subjects following on from our initial observation that, of all blood cells, platelets showed the highest concentrations of mHtt using western blot analyses which represent semiquantitative methods. We speculated that this significant pathological protein load would impair platelet functions, which we therefore investigated using both human samples and animal models.
Despite the absence of studies looking at the impact of mHtt within platelets, some earlier reports have highlighted the fact that these cells are characterised by a number of anomalies in HD. For example, platelets show (1) an increase in A2 receptors that correlates with CAG repeat lengths,30 (2) variable concentrations of dopamine and serotonin,31 32 (3) a decrease in epinephrine,32 (4) an increase in N-methyl-D-aspartate ligands such as aspartate and glycine33 as well as (5) abnormal mitochondrial activity.31 34 Our study provides the first comparative findings of Htt/mHtt concentrations in platelets with respect to other blood cells. Despite its ubiquitous expression in all cells of the body, mHtt expression is highest in platelets, a phenomenon that also increases as the disease progresses. This suggests that, as the disease evolves, mHtt expression may increase in megakaryocytes, the platelet progenitor in the bone marrow. To our knowledge, only one other recent study has reported on mHtt expression in blood cells, demonstrating that mHtt levels in monocytes and T cells correlated with HD progression in patients, as expressed by disease burden scores and caudate atrophy rates.3
In line with our findings, thrombocytopenia has not been observed in neurodegenerative disorders, including HD, with the possible exception of Parkinson’s disease (PD) and multiple sclerosis (MS).8 In patients with MS, prevalence of idiopathic thrombocytopenic purpura was found to be approximately 25-fold higher than in the general population. Moreover, drugs such as levodopa or clozapine induce agranulocytosis and thrombocytopenia in patients with PD. None of the patients comprised in our cohort have reported taking this medicine. Indeed, a study preformed in the 1980s reported that platelet counts, bleeding time, prothrombin time, activated thromboplastin time and clot retraction were similar in patients with HD and healthy individuals.35
Our RNA-seq data in platelets suggest limited overall effects of HD on megakaryocyte transcription. Although global differences were not observed, RNA-seq analysis uncovered seven RNAs that are differently expressed in patients with HD compared with the matched healthy control group. Three of these RNAs are associated to the SLC25A family, which encodes for proteins that are involved in the mitochondrial respiratory chain and in particular, iron metabolism.36 These findings corroborate those of a recent study demonstrating anomalies within the mitochondrial respiratory chain of platelets.37 Of interest, mHtt aggregates are associated with elevated neuronal iron levels38 and mitochondrial activity is abnormal in HD neurons.34
At least four of the differentially expressed RNAs are of erythrocytic lineage: HBG subunits 1/2 and HBA subunits 1/2, despite us undertaking an RBC depletion step from our platelet preparations using magnetic microspheres which seemed effective given the absence of other prevalent RBC RNAs, such as glycophorin A, in our platelet RNA analyses. It should be noted, however, that we failed to validate the majority of these transcripts with RT-qPCR. Nevertheless, one additional study has confirmed the presence of erythrocytic RNAs in platelets and in megakaryocytes. The stimulation of megakaryoblasts (MEG-01 cells) with thrombopoietin, a glycoprotein hormone which regulates the production of platelets, triggers the genesis of platelets that are characterised by an increase expression of HBG1/HBG2, HBA1/HBA2 and ϵ globin (HBE1).39 RBC and megakaryocytes are derived from a common precursor, the megakaryocyte-erythroid progenitor. RBC and megakaryocyte development and maturation are both governed by the activity of transcription factors which include erythroid transcription factor one (GATA-1) or two (GATA-2) and nuclear factor erythroid 2 transcription factor (NF-E2).40 The balance between their expression regulates the expression of the haemoglobin gene in erythroid cells. The ablation of the NF-E2 gene induces profound thrombocytopenia in mice, resulting in slowed megakaryocyte differentiation as well as a decrease in the number of RBC.41 Finally, mature RBC are devoid of genetic information and HBG1/HBG2 are fetal proteins that are present in less than 1% of haemoglobin contained within adult RBC.42 In sum, although we cannot completely discard the contribution of minute contamination by RBC RNAs, there remains the possibility that these RNA molecules may indeed originate from platelets and may be modulated in HD. Finally, mRNA coding for Htt was detected in platelets (online supplementary figure 1C) consistent with our demonstration for the presence of Htt in platelets, suggesting that Htt mRNA and protein were produced in the mother megakaryocyte.
There are no existing reports on the role of Htt in platelets. However, Htt plays a critical role in vesicular transport and in the release of neurotrophic factors in the central nervous system.43 Our electron microscopy observations that mHtt is associated with plasma membranes, alpha granules and open-canalicular systems implies that the abnormal protein is capable of modulating platelet activation, and thereby the release of various factors contained within it. In healthy control subjects, the opposite occurs with activated platelets showing lower concentrations of Htt. In addition, the angiogenic factors FGF basic and HGF were not secreted when we activated platelets from late-stage disease individuals. These two factors have already been reported to induce the formation of new blood vessels by acting directly on cells of the vascular epithelium.44 45 While PF4, a chemokine stored in alpha granules, is capable of contributing to blood coagulation, wound repair and inflammation, it does not seem to vary in the disease, in contrast to serotonin. Serotonin is stored in dense granules and can interact with several receptors to facilitate (1) aggregation of platelets, (2) vascular permeability and (3) inflammation.7 46 While platelet serotonin contents are significantly augmented in late-stage disease patients, serotonin secretion is not increased in activated platelets of HD versus healthy control subjects. However, platelets of premanifest patients show significant degranulation of dense granules. Interestingly, one publication from the 1980s demonstrated that low levels of serotonin can be released from platelets in HD and that the aggregation process of platelets is seemingly impaired.35 Two publications followed up on this and one showed that platelet serotonin levels did not vary in HD,31 while the other demonstrated that platelets were more responsive and therefore aggregated more easily.47 Some antidepressants, such as selective serotonin reuptake inhibitors (SSRI), are responsible for the uptake of serotonin into platelets. Studies performed on human platelets have shown that SSRIs do produce a drastic decrease of 80%–90% in platelet serotonin content.7 However, patients taking this type of medication (eg, citalopram) were excluded from our study. Some of the recruited patients were, however, treated with olanzapine, a serotonin-dopamine receptor antagonist used in the treatment of schizophrenia and other psychotic disorders, but this drug does not have a significant effect on platelet serotonin concentration.48
In light of these contradictory findings, we further performed tail bleeding tests in HD mice to evaluate whether thrombosis was indeed affected. Results showed that manifest R6/2 mice bleed less and for shorter periods of time, suggesting that platelets are hyperfunctional and may more readily promote thrombosis, in agreement with the findings described above.47 However, assessment of the cytoarchitecture of blood vessels in the tail of R6/2 mice of the same age (late-stage disease) further revealed important modifications in the vascular network in comparison to WT mice which supports our previous findings of such abnormalities within cerebral tissue.4 Therefore, two of the main roles of platelets, which relate to thrombosis and vascular networks, seem to be impacted. Whether such phenotype is recapitulated in all vascular beds (other than the tail veins), however, remains to be established.
The platelet depletion protocol allowed us to investigate the role of platelets as well as the integrity of the BBB. Despite the absence of measurable behavioural changes in R6/2 mice that have undergone a depletion protocol, some modifications were observed at the level of the BBB. First, injections of Evans blue showed reversed permeability of the BBB at the level of the cerebellum, and second, levels of certain proteins involved in the maintenance of the BBB, such as claudin-5, were restored to normal following the depletion protocol in R6/2 mice. We have recently shown postmortem evidence of BBB disruption in the brains from patients with HD as well as in manifest R6/2 mice by, in part, a decrease in claudin-5 and occludin expression.4 Moreover, mRNA expressions of zonula occludens-1, claudin-5 and occludin have been reported to be significantly downregulated in R6/2 mice prior to the development of measurable behavioural impairments, providing evidence that impairments in tight junctions may precipitate and drive pathology.6 Platelets maintain vascular integrity in normal and certain pathological conditions, such as the arthritic model and lung inflammation.10 However, our data suggest that in HD, platelets can also promote BBB permeability, as previously described in murine models of inflammatory arthritis.12
Apart from a few reports from the 1980s, this is the first detailed study on the potential role of platelets in HD. Although the direct clinical relevant contribution of platelets to the disease remains to be demonstrated, our findings provide a better understanding for the impact of mHtt on platelet function and associated pathological features of HD, which in turn may provide new pathogenic insights.
References
Footnotes
EB and FC are joint senior authors.
Contributors HLD, JLP and IS-A participated in the design of the experiments and blood drive, data analysis, interpretation and preparations of figures. HLD also helped write the manuscript. IS-A took part in experiments. SLM helped with patient recruitment in Cambridge and participated in the preparation of blood collections in Cambridge. JWR performed RNA-sequencing analysis and helped with interpretations of Figure 2C. NC helped with the RT-qPCR analyses, generated in Figure 2D. MÈT was involved in electron microscopy analysis of Figure 3E. ATV helped with the RNA-sequencing analyses, generated in Figure 2C. PVG helped with all anatomical description provided in Figure 5B. SC recruited patients – Montreal. ASW and MTR were involved in RNA-sequencing analysis and help with interpretations of Figure 2C. RAB recruited patients, participated in data interpretation and revised the manuscript. EB and FC initiated the study and were involved in the experimental design. EB revised the manuscript. FC supervised the project and wrote the manuscript.
Funding This study was funded by Fonds de Recherche en Sante du Québec, Santé Merck Sharp and DohmeFondation du CHU de Québec CIHR-Huntington Society of Canada, National Institute for Health Research award of a Biomedical Research Center to the University of Cambridge and Addenbrooke’s Hospital, National Heart, Lung, and Blood Institute and National Institute on Aging (HL112311, HL126547 and AG048022) Centre Thématique de Recherche en Neurosciences du CHU de Québec National Institute for Health Research.
Competing interests None declared.
Patient consent Not required.
Ethics approval CHU de Québec, #A13-02-1096; CHUM, #14.228; Cambridge Central Regional Ethics Committee, REC #03/303 and #08/H0306/26 and Cambridge University Hospitals Foundation Trust Research and Development department, R&D #A085170 and #A091246.
Provenance and peer review Not commissioned; externally peer reviewed.