Article Text

Abstract
Background There are few validated fluid biomarkers in frontotemporal dementia (FTD). Glial fibrillary acidic protein (GFAP) is a measure of astrogliosis, a known pathological process of FTD, but has yet to be explored as potential biomarker.
Methods Plasma GFAP and neurofilament light chain (NfL) concentration were measured in 469 individuals enrolled in the Genetic FTD Initiative: 114 C9orf72 expansion carriers (74 presymptomatic, 40 symptomatic), 119 GRN mutation carriers (88 presymptomatic, 31 symptomatic), 53 MAPT mutation carriers (34 presymptomatic, 19 symptomatic) and 183 non-carrier controls. Biomarker measures were compared between groups using linear regression models adjusted for age and sex with family membership included as random effect. Participants underwent standardised clinical assessments including the Mini-Mental State Examination (MMSE), Frontotemporal Lobar Degeneration-Clinical Dementia Rating scale and MRI. Spearman’s correlation coefficient was used to investigate the relationship of plasma GFAP to clinical and imaging measures.
Results Plasma GFAP concentration was significantly increased in symptomatic GRN mutation carriers (adjusted mean difference from controls 192.3 pg/mL, 95% CI 126.5 to 445.6), but not in those with C9orf72 expansions (9.0, –61.3 to 54.6), MAPT mutations (12.7, –33.3 to 90.4) or the presymptomatic groups. GFAP concentration was significantly positively correlated with age in both controls and the majority of the disease groups, as well as with NfL concentration. In the presymptomatic period, higher GFAP concentrations were correlated with a lower cognitive score (MMSE) and lower brain volume, while in the symptomatic period, higher concentrations were associated with faster rates of atrophy in the temporal lobe.
Conclusions Raised GFAP concentrations appear to be unique to GRN-related FTD, with levels potentially increasing just prior to symptom onset, suggesting that GFAP may be an important marker of proximity to onset, and helpful for forthcoming therapeutic prevention trials.
Statistics from Altmetric.com
Introduction
Frontotemporal dementia (FTD) is a progressive neurodegenerative condition with around a third of cases caused by an autosomal dominant gene mutation in progranulin (GRN), chromosome 9 open reading frame 72 (C9orf72) or microtubule-associated protein tau (MAPT).1 As clinical trials in genetic FTD are fast approaching, robust biomarkers that allow accurate measurement of disease onset and progression are becoming increasingly important. In particular, many trials will focus on the presymptomatic stage of disease where neuropathological alterations are already present2 and yet few biomarkers have been shown to be abnormal in this phase.3–5
Cerebrospinal fluid (CSF) or plasma/serum progranulin levels in GRN mutation carriers4 6 and CSF (poly)GP dipeptide repeat concentrations in C9orf72 expansion carriers5 7 8 are markers of specific protein abnormalities in genetic FTD, but both are abnormal from early in the presymptomatic period (and potentially from birth). In contrast, neurofilament light chain (NfL) is a marker of neuronal death and axonal degeneration (measurable in CSF3 9 10 as well as both plasma11 and serum12 13) that is not specific to FTD14 and has only been shown to be abnormal in the very late presymptomatic period prior to conversion to the symptomatic phase.3 Glial fibrillary acidic protein (GFAP) is a marker of astrogliosis, the abnormal proliferation of astrocytes due to neuronal damage15 and has previously been shown to be increased in frontal cortical tissue in FTD,16 and raised in both the CSF and serum of patients with symptomatic FTD.17–19 However, it has yet to be explored using ultrasensitive blood-based assays in genetic FTD mutation carriers.
In this study, we aimed to investigate within the Genetic FTD Initiative (GENFI) cohort whether plasma GFAP was abnormal in each of the different genetic FTD groups during the symptomatic period, and whether we could detect any presymptomatic changes. We also aimed to explore the relationship of GFAP with plasma NfL, cognitive, and neuroimaging measures.
Methods
Participants
Participants were recruited from GENFI, a natural history study of genetic FTD involving 23 research centres across Europe and Canada (www.genfi.org.uk)2 involving symptomatic carriers of mutations in GRN, MAPT or C9orf72, and those at risk of carrying a mutation because a first-degree relative was a known symptomatic carrier. Four hundred sixty-nine consecutively recruited individuals from the GENFI study were included: 114 C9orf72 expansion carriers (74 presymptomatic, 40 symptomatic), 119 GRN mutation carriers (88 presymptomatic, 31 symptomatic), 53 MAPT mutation carriers (34 presymptomatic, 19 symptomatic) and 183 non-carriers who acted as a control group. Demographic information is shown in table 1: age and sex differed significantly between groups. All people in the study underwent a clinical assessment consisting of a medical history with the participant and informant, and physical examination, with symptomatic status diagnosed by a clinician who was an expert in the FTD field20–24 (specific diagnoses are shown in table 1). All participants underwent a standardised examination including the Mini-Mental State Examination (MMSE) and the Frontotemporal Lobar Degeneration-Clinical Dementia Rating scale (FTLD-CDR).25 Participants also performed three-dimensional T1-weighted MRI of the brain: 432 scans were available for cross-sectional analysis, of which a subgroup of 243 participants had a follow-up scan (on the same scanner) for analysis (mean (SD) interval 1.12 (0.29) years between baseline and follow-up). Volumetric measures of whole brain and cortical regions were calculated using a previously described method that uses the geodesic information flow (GIF) algorithm, which is based on atlas propagation and label fusion (online supplementary table 1).3 26 An annualised longitudinal rate of atrophy was found by calculating the difference in each specific measure between the baseline and longitudinal scan and expressing it as a percentage of the baseline volume over 1 year (online supplementary table 2).
Supplemental material
Demographic, cognitive and biomarker data from study participants
Adjusted mean differences in plasma NfL concentrations between groups with 95% bias-corrected bootstrap CI
Adjusted mean differences in plasma GFAP concentrations between groups with 95% bias-corrected bootstrap CIs
Measurement of plasma markers
Plasma was collected, processed and stored in aliquots at −80°C according to standardised procedures. Samples were measured using the multiplex Neurology 4-Plex A kit (102153, Quanterix, Lexington, USA) on the SIMOA HD-1 Analyzer following manufacturer’s instructions. The lower limit of detection of the assay for GFAP and NfL were 0.221 and 0.104 pg/mL, respectively. Measurements were carried out at the same study site on consecutive days and the operator was blinded to all clinical information, including genetic status. To keep sample processing and plating consistent, plasma samples were thawed at room temperature for 2 hours and subsequently centrifuged at 10 000 g for 5 min; 150 µL samples were aliquoted in a 96-well plate (Quanterix) and frozen at −80°C until analysis. Quality control samples had a mean intra-assay and interassay coefficient of variation of <10%.
Statistical analysis
Fisher’s exact test was used to compare sex frequencies between groups. Distributions for demographic and biomarker data were investigated graphically using histograms and quantile-quantile plots and tested for normality using the Shapiro-Wilk test. As demographic data did not follow a normal distribution, group differences for age at sample collection and FTLD-CDR-Sum Of Boxes were compared using the Kruskal-Wallis test. A linear regression adjusting for age was used to compare MMSE scores between groups. The primary analysis in the study was to investigate whether there were any differences in plasma GFAP concentration from controls in the different genetic mutation groups both symptomatically and presymptomatically, as well as between genetic groups. As biomarker values were not normally distributed, group means were compared by performing a linear mixed regression model with 95% bias-corrected bootstrapped CIs with 2000 repetitions in STATA (V.14; StataCorp, College Station, Texas, USA), adjusting for age and sex with family membership included as a random effect. Diagnostic performance of GFAP was assessed by areas under the curve (AUC) obtained by receiver operating characteristic (ROC) analyses, with optimal cut‐off levels at the highest Youden’s index (sensitivity+specificity−1) using GraphPad Prism (V.6; GraphPad Software, San Diego, California, USA). In order to investigate the relationship of GFAP concentration to demographic, cognitive and imaging measures as well as NfL concentrations, Spearman’s correlation coefficient was used.
Results
Plasma GFAP concentration
Plasma GFAP concentration was significantly higher in the symptomatic GRN mutation carriers compared with controls (adjusted mean difference 192.3 pg/mL, 95% CI 126.5 to 445.6), but not in either the symptomatic C9orf72 (9.0, –61.3 to 54.6) or MAPT (12.7, –33.3 to 90.4) groups (figure 1, tables 1 and 2). Within the symptomatic groups, concentrations in GRN were significantly higher than both C9orf72 (183.3, 106.1 to 427.2) and MAPT (179.6, 99.8 to 348.1) mutation carriers.
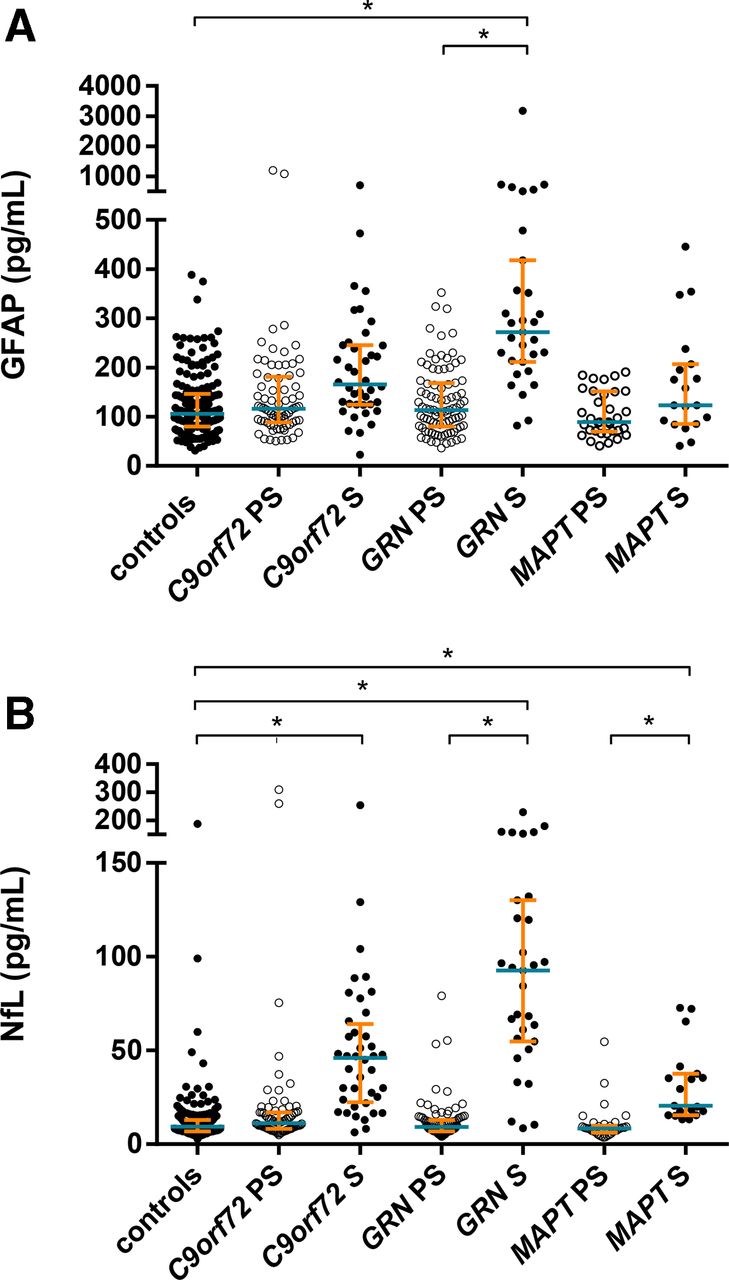
(A) Plasma glial fibrillary acidic protein (GFAP) and (B) plasma neurofilament light chain (NfL) concentrations (pg/mL) in control, presymptomatic and symptomatic frontotemporal dementia mutation carriers for each gene: C9orf72, GRN and MAPT. Median designated by blue line; IQRs indicated by orange error bars. *Significant differences—only differences from controls and within the same genetic group are shown on the graph. Note that 29 data points fall outside the upper or lower limit using the IQR method, with factor k=1.5 (ie, outside the upper limit Q3+1.5×IQR or lower limit Q1−1.5×IQR): excluding these outliers does not change the significance of the results.
A ROC curve analysis measuring the ability of GFAP to distinguish symptomatic GRN mutation carriers from controls showed a sensitivity of 90.3% and specificity of 82.0% with a cut-off point of 163.2 pg/mL and an AUC of 0.90. For distinguishing symptomatic GRN mutation carriers from C9orf72 mutation carriers there was a sensitivity of 71.0% and specificity of 70.0% with a cut-off point of 226.2 pg/mL and an AUC of 0.74, while for distinguishing symptomatic GRN mutation carriers from MAPT mutation carriers there was a sensitivity of 79.0% and specificity of 77.4% with a cut-off point of 209.1 pg/mL and an AUC of 0.80 (online supplementary figure 1).
In the presymptomatic groups, concentrations were not significantly increased in any of the groups compared with controls: GRN (14.2, −2.4 to 38.3), C9orf72 (21.1, −18.8 to 66.5), MAPT (−7.0, −61.8 to 7.8) (figure 1, tables 1 and 2). There were also no differences across the presymptomatic groups.
Comparing symptomatic and presymptomatic carriers, a significantly higher concentration was also seen in the symptomatic versus the presymptomatic GRN mutation carriers (178.1, 114.3 to 365.2), but not in the other groups (figure 1, tables 1 and 2).
Correlation with age
GFAP concentration was significantly correlated with age at sample collection in controls (r=0.55, p<0.001), presymptomatic mutation carriers (all groups combined: r=0.53, p<0.001; GRN: r=0.58, p<0.001; C9orf72: r=0.50, p<0.001; MAPT: r=0.36, p=0.036) and symptomatic mutation carriers for all genetic groups together (r=0.38, p<0.001) and the GRN group alone (r=0.65, p<0.001) (figure 2). No significant correlation was seen for the symptomatic C9orf72 (r=0.27, p=0.088) or MAPT mutation carriers (r=0.00, p=0.989).

Correlation between plasma glial fibrillary acidic protein (GFAP) concentrations (pg/mL) and age: (A) presymptomatic and (B) symptomatic mutation carriers.
Correlation with plasma NfL
Plasma NfL was increased in all three symptomatic groups compared with controls (figure 1, tables 1 and 3): GRN mutation carriers (adjusted mean difference 70.5 pg/mL, 95% CI 51.6 to 92.6), C9orf72 mutation carriers (29.7, 18.7 to 47.5) and MAPT mutation carriers (12.6, 3.3 to 26.1). Within the symptomatic groups, concentrations in GRN were significantly higher than both C9orf72 (40.7, 16.5 to 62.2) and MAPT (57.9, 36.8 to 81.5) mutation carriers, and C9orf72 mutation carriers were higher than MAPT mutation carriers (17.2, 2.9 to 35.7). Concentration was also increased in presymptomatic C9orf72 mutation carriers compared with controls (9.0, 1.3 to 26.8), but not in the GRN or MAPT presymptomatic groups (figure 1, tables 1 and 3). Comparing symptomatic and presymptomatic carriers, a significantly higher concentration was also seen in the symptomatic versus the presymptomatic mutation carriers in each of the groups (figure 1, tables 1 and 3): GRN mutation carriers (70.5, 52.5 to 92.2), C9orf72 mutation carriers (20.7, 3.2 to 36.1) and MAPT mutation carriers (11.7, 0.8 to 23.4).
Plasma GFAP and NfL concentrations were significantly correlated in controls (r=0.66, p<0.001), presymptomatic mutation carriers (GRN: r=0.66, p<0.001; C9orf72: r=0.75, p<0.001; MAPT: r=0.41, p=0.017) and symptomatic mutation carriers (GRN: r=0.38, p=0.036; C9orf72: r=0.57, p<0.001; MAPT: r=0.76, p<0.001).
Correlation with cognitive measures
A significant negative correlation between GFAP concentrations and MMSE was seen in the presymptomatic GRN (r=−0.24, p=0.033) and C9orf72 (r=−0.40, p<0.001) but not MAPT (r=0.05, p=0.801) mutation carriers. No significant correlation was seen during the symptomatic period in any of the genetic groups (GRN: r=−0.29, p=0.153; C9orf72: r=−0.24, p=0.146; MAPT: r=−0.48, p=0.080).
No significant correlations were seen between GFAP concentration and FTLD-CDR sum of boxes score in either the presymptomatic or symptomatic period in any group: GRN: r=−0.04, p=0.768 presymptomatic, r=0.18, p=0.409 symptomatic; C9orf72: r=−0.17, p=0.234 presymptomatic, r=0.21, p=0.321 symptomatic; MAPT: r=−0.17, p=0.446 presymptomatic, r=0.14, p=0.736 symptomatic.
Correlation with cross-sectional imaging data
A significant negative correlation was seen between GFAP concentrations and both GRN and C9orf72 presymptomatic carrier brain volumes for frontal cortex (r=−0.23, p=0.039; r=−0.35, p=0.002), temporal cortex (r=−0.35, p=0.001; r=−0.27, p=0.024), cingulate cortex (r=−0.24, p=0.027; r=−0.44, p<0.001) and insular cortex (r=−0.27, p=0.016; r=−0.26, p=0.029) as well as whole brain (r=−0.45, p<0.001) and parietal cortex (r=−0.33, p=0.005) for the C9orf72 group (online supplementary table 3). No significant correlations were seen in the presymptomatic MAPT mutation carrier group or any of the symptomatic genetic groups.
Correlation with longitudinal imaging data
No significant positive correlation of GFAP concentration with longitudinal rates of atrophy were seen in any of the groups except for in the temporal cortex of symptomatic GRN mutation carriers (r=0.66, p=0.010) (online supplementary table 4). However, within the same symptomatic GRN group there was also a trend in relationship between GFAP concentration and atrophy rates in the cingulate cortex (r=0.55, p=0.052).
Discussion
In this study, we found that plasma GFAP concentration was significantly increased in genetic FTD but only in GRN mutation carriers, and not in those with C9orf72 expansions or mutations in the MAPT gene. In the presymptomatic period, higher concentrations were correlated with a lower cognitive score (MMSE) and lower brain volumes (in regions characteristically affected in FTD), potentially suggesting GFAP is increased in the late presymptomatic period. In the symptomatic period, higher concentrations were associated with faster rates of atrophy, suggesting GFAP levels are associated with disease intensity, and therefore progression and survival.
GFAP is a major constituent of the astrocytic cytoskeleton and its expression pattern is highly brain-enriched.27 Its levels increase following acute damage to astrocytes such as after a stroke28 or traumatic brain injury,29 but also in relation to more chronic insults, such as in neurodegeneration, when astrocytes become reactive, increasing in size and proliferating, a process called astrogliosis.27 In neurodegeneration, increased GFAP concentrations in biofluid have been reported in Alzheimer’s disease30 (in both CSF17 19 and serum19) and amyotrophic lateral sclerosis18. Previous studies in FTD have found increased CSF concentrations in symptomatic patients within combined clinical17 19 and genetic cohorts18 but have not previously found changes in blood,19 nor investigated individual genetic groups previously. Our results suggest that there are differential increases within FTD, with concentrations being higher in people with GRN mutations than in other groups. GRN encodes the progranulin protein, which is a secreted growth factor and known to be involved in many biological processes including inflammation, wound healing and cell proliferation.31 32 However, progranulin is also taken up by astrocytes for storage or transportation to the lysosomal compartment,33–35 and studies of GRN-deficient mice have shown the presence of astrogliosis.35–37 In vitro, progranulin seems to have a role of inactivating astrocytes with evidence that progranulin attenuates a pro-inflammatory phenotype of astrocytes.35 This suggests that deficiency of progranulin in GRN mutation carriers may lead to activation of pro-inflammatory phenotypes of astrocytes and subsequent astrogliosis, with increased levels of GFAP expression. People with GRN mutations have evidence of astrogliosis pathologically, including within areas of white matter damage38 (visible in a proportion of people in vivo as white matter hyperintensities on MR imaging, which have been previously shown to be unique to GRN mutations within familial FTD).39 Such damage increases as the neurodegeneration progresses,39 consistent with the pattern of increased plasma GFAP in our study. In contrast, levels were not increased in plasma in individuals with C9orf72 expansions or MAPT mutations. While astrogliosis is seen in animal models and at postmortem in both C9orf72-related40 and MAPT-related41 42 FTD, this may well be a late feature of the disease, or the extent of astrogliosis may be less. Future work will be required to investigate this further.
It is well established that multiple biomarkers of neurodegeneration increase in concentration with age, attributed to the reduction of neural integrity in the ageing brain.43 CSF GFAP concentrations have previously been shown to increase as one gets older,44 with multiple studies showing proliferation of astrocytes, increased GFAP immunoreactivity and elevated levels of GFAP mRNA with age.45–49 Consistent with this, we also found a significant positive correlation of plasma GFAP concentration with age in the majority of the groups. This highlights the importance of adjusting plasma GFAP concentrations for age in statistical analyses: symptomatic mutation carriers in the C9orf72 and MAPT groups (as well as the GRN group) in this study showed increased levels of plasma GFAP compared with controls and their presymptomatic counterparts, but significance was lost once adjusting for age.
NfL, part of the axonal cytoskeleton, is released following cellular damage. A previous study has shown that NfL concentrations are increased in both the CSF and blood of symptomatic genetic FTD in all three mutation groups, C9orf72, GRN and MAPT.3 The results in this study replicate these findings in plasma, although we also found elevated levels in presymptomatic C9orf72 mutation carriers. In this latter group, NfL concentrations correlated negatively with MMSE (r=−0.33, p=0.004: online supplementary table 5) and with brain volumes (whole brain, r=−0.53, p<0.001 and cortical regions: frontal, −0.51, <0.001; temporal, −0.37, 0.001; parietal, −0.51, <0.001; occipital, −0.33, 0.005; cingulate, −0.49, <0.001; insula, −0.47, <0.001: online supplementary tables 6 and 7), suggesting that NfL increases particularly towards the end of the presymptomatic period with increasing neurodegeneration. Although GRN NfL concentration was not significantly increased presymptomatically, a similar pattern of negative correlation with brain volumes was seen in this group (in whole brain and all cortical regions except the occipital lobe, r=−0.30 to −0.48, p≤0.006). NfL and GFAP concentrations were significantly correlated in all groups including controls, although the correlation coefficient varied from 0.38 to 0.76. A similar correlation has been shown in CSF previously.44 As both increase with age (online supplementary table 8 for NfL correlations with age), the correlation is not unexpected, but other unexplained factors are likely to affect the different patterns within genetic FTD; interestingly, the lowest correlation (r=0.38) was in the symptomatic GRN mutation carriers, suggesting that in this group astrogliosis and neurodegeneration are not so closely related.
Correlation of GFAP concentration with cognitive and imaging measures revealed a negative correlation, that is, higher concentration with a lower cognitive score and lower cross-sectional brain volumes in FTD-related regions in presymptomatic GRN mutation carriers. This suggests that GFAP levels start to increase as the brain starts to decrease in volume, and as cognition starts to become affected thus in the later stages of the presymptomatic period in proximity to symptom onset. This would be an important biomarker for GRN-related FTD, as an increase in concentration from baseline during the presymptomatic period would identify a time around the onset of neurodegeneration, and potentially a time when therapeutic intervention may be optimal. Despite the lack of a significant increase in concentration in C9orf72 mutation carriers, a similar pattern of negative correlation with cognition and brain imaging was seen in the presymptomatic period—it would be useful in future studies to investigate the subset of C9orf72 expansion carriers that have increased GFAP concentrations, and how they differ from those with a lower concentration. In particular, it would be helpful to compare carriers with and without concomitant ALS. We also assessed whether GFAP correlated with the rate of brain atrophy measured with longitudinal brain imaging and found a significant positive correlation only in the symptomatic GRN carriers (in the temporal lobe), implicating an association of GFAP levels with the intensity of the disease process, that is, how fast the disease is progressing. With longitudinal follow-up of participants, it would therefore be hypothesised that higher GFAP concentration would be associated with shorter survival in GRN-related FTD.
While the multicentre nature of the GENFI study allows collection of samples from a large genetic cohort of FTD worldwide, there remains a relatively small number of cases in each group (leading to low statistical power to detect differences), particularly in the symptomatic carriers, and replication in a larger dataset would be helpful. Due to the nature of the disease process, the mean age of the controls overall is lower compared with the symptomatic mutation carriers, but nonetheless the same results are found whether performing an age-adjusted comparison (as presented above in Plasma GFAP concentration) or when symptomatic mutation carriers are compared with an age-matched and gender-matched subset of older controls (see online supplementary figure 2). The advantage of studying levels in plasma is that blood is more easily accessible and a relatively cost-efficient way to access bodily fluids in comparison to performing a lumbar puncture; in this study, the use of the ultrasensitive SIMOA assay allowed detection at a level in blood that other assays do not. However, it will be important to study CSF levels in more detail in this group, as concentrations can differ between blood and CSF.18 Lastly, despite significant differences between the groups, there is a substantial overlap in concentrations between carriers and controls: longitudinal study of GFAP concentration over time, particularly in participants that convert from presymptomatic to symptomatic status, will therefore be important to truly evaluate whether changes do occur towards the end of the presymptomatic period and how levels change with progression of disease.
In summary, plasma GFAP levels appear to be uniquely increased in GRN mutation carriers in the current study, and importantly, concentrations may well be abnormal during the late presymptomatic period, suggesting that GFAP might act as marker of proximity to symptom onset.
Acknowledgments
The authors would like to thank the members of the kindreds who have been active participants in the GENFI study.
References
Supplementary materials
Supplementary Data
This web only file has been produced by the BMJ Publishing Group from an electronic file supplied by the author(s) and has not been edited for content.
Footnotes
Twitter @marthafoiani, @dave_mri, @sducharme66
Collaborators Martin N Rossor, Jason D Warren (Dementia Research Centre, Department of Neurodegenerative Disease, UCL Queen Square Institute of Neurology, London, UK); Nick C Fox (Dementia Research Centre, Department of Neurodegenerative Disease, UCL Queen Square Institute of Neurology, London, UK; Dementia Research Institute, Department of Neurodegenerative Disease, UCL Institute of Neurology, Queen Square, London, UK); Rita Guerreiro, Jose Bras (Center for Neurodegenerative Science, Van Andel Research Institute, Grand Rapids, Michigan, USA); Jennifer Nicholas (Department of Medical Statistics, London School of Hygiene and Tropical Medicine, London, UK); Simon Mead (MRC Prion Unit, Department of Neurodegenerative Disease, UCL Institute of Neurology, Queen Square, London, UK); Lize Jiskoot, Lieke Meeter, Jessica Panman, Janne Papma (Department of Neurology, Erasmus Medical Centre, Rotterdam, Netherlands); Rick van Minkelen (Department of Clinical Genetics, Erasmus Medical Centre, Rotterdam, Netherlands); Yolanda Pijnenburg (Amsterdam University Medical Centre, Amsterdam VUmc, Amsterdam, Netherlands); Myriam Barandiaran, Begoña Indakoetxea (Cognitive Disorders Unit, Department of Neurology, Donostia University Hospital, San Sebastian, Gipuzkoa, Spain; Neuroscience Area, Biodonostia Health Research Institute, San Sebastian, Gipuzkoa, Spain); Alazne Gabilondo, Mikel Tainta, Maria de Arriba, Ana Gorostidi, Miren Zulaica (Neuroscience Area, Biodonostia Health Research Institute, San Sebastian, Gipuzkoa, Spain); Jorge Villanua (OSATEK, University of Donostia, San Sebastian, Gipuzkoa, Spain); Zigor Diaz (1CITA Alzheimer, San Sebastian, Gipuzkoa, Spain); Sergi Borrego-Ecija, Jaume Olives, Albert Lladó, Mircea Balasa, Anna Antonell (Alzheimer’s disease and Other Cognitive Disorders Unit, Neurology Service, Hospital Clínic, Barcelona, Spain); Nuria Bargallo (Imaging Diagnostic Center, Hospital Clínic, Barcelona, Spain), Enrico Premi, Maura Cosseddu, Stefano Gazzina, Alessandro Padovani (Centre for Neurodegenerative Disorders, Neurology Unit, Department of Clinical and Experimental Sciences, University of Brescia, Brescia, Italy); Roberto Gasparotti (Neuroradiology Unit, University of Brescia, Brescia, Italy); Silvana Archetti (Biotechnology Laboratory, Department of Diagnostics, Spedali Civili Hospital, Brescia, Italy), Sandra Black, Sara Mitchell (Sunnybrook Health Sciences Centre, Sunnybrook Research Institute, University of Toronto, Toronto, Canada); Ekaterina Rogaeva (Tanz Centre for Research in Neurodegenerative Diseases, University of Toronto, Toronto, Canada); Morris Freedman (Baycrest Health Sciences, Rotman Research Institute, University of Toronto, Toronto, Canada), Ron Keren (The University Health Network, Toronto Rehabilitation Institute, Toronto, Canada); David Tang-Wai (The University Health Network, Krembil Research Institute, Toronto, Canada); Linn Öijerstedt (Department of Geriatric Medicine, Karolinska University Hospital-Huddinge, Stockholm, Sweden); Christin Andersson (Department of Clinical Neuroscience, Karolinska Institutet, Stockholm, Sweden); Vesna Jelic (Division of Clinical Geriatrics, Karolinska Institutet, Stockholm, Sweden); Hakan Thonberg (Center for Alzheimer Research, Divison of Neurogeriatrics, Karolinska Institutet, Stockholm, Sweden); Andrea Arighi, Chiara Fenoglio, Elio Scarpini (Fondazione IRCCS Ca’ Granda Ospedale Maggiore Policlinico, Neurodegenerative Diseases Unit, Milan, Italy; University of Milan, Centro Dino Ferrari, Milan, Italy); Giorgio Fumagalli (Fondazione IRCCS Ca’ Granda Ospedale Maggiore Policlinico, Neurodegenerative Diseases Unit, Milan, Italy; University of Milan, Centro Dino Ferrari, Milan, Italy; Department of Neurosciences, Psychology, Drug Research and Child Health (NEUROFARBA), University of Florence, Florence, Italy); Thomas Cope, Carolyn Timberlake, Timothy Rittman (Department of Clinical Neurosciences, University of Cambridge, Cambridge, UK); Christen Shoesmith (Department of Clinical Neurological Sciences, University of Western Ontario, London, Ontario Canada); Robart Bartha (Department of Medical Biophysics, The University of Western Ontario, London, Ontario, Canada; Centre for Functional and Metabolic Mapping, Robarts Research Institute, The University of Western Ontario, London, Ontario, Canada); Rosa Rademakers (Department of Neuroscience, Mayo Clinic, Jacksonville, Florida, USA); Carlo Wilke (Department of Neurodegenerative Diseases, Hertie-Institute for Clinical Brain Research and Center of Neurology, University of Tübingen, Tübingen, Germany; Center for Neurodegenerative Diseases (DZNE), Tübingen, Germany), Hans-Otto Karnarth (Division of Neuropsychology, Hertie-Institute for Clinical Brain Research and Center of Neurology, University of Tübingen, Tübingen, Germany); Benjamin Bender (Department of Diagnostic and Interventional Neuroradiology, University of Tübingen, Tübingen, Germany), Rose Bruffaerts (Laboratory for Cognitive Neurology, Department of Neurosciences, KU Leuven, Leuven, Belgium); Philip Vandamme (Neurology Service, University Hospitals Leuven, Belgium, Laboratory for Neurobiology, VIB-KU Leuven Centre for Brain Research, Leuven, Belgium); Mathieu Vandenbulcke (Geriatric Psychiatry Service, University Hospitals Leuven, Belgium; Neuropsychiatry, Department of Neurosciences, KU Leuven, Leuven, Belgium); Catarina B Ferreira (Laboratory of Neurosciences, Institute of Molecular Medicine, Faculty of Medicine, University of Lisbon, Lisbon, Portugal); Gabriel Miltenberger (45Faculty of Medicine, University of Lisbon, Lisbon, Portugal); Carolina Maruta (Laboratory of Language Research, Centro de Estudos Egas Moniz, Faculty of Medicine, University of Lisbon, Lisbon, Portugal); Ana Verdelho (Department of Neurosciences and Mental Health, Centro Hospitalar Lisboa Norte - Hospital de Santa Maria & Faculty of Medicine, University of Lisbon, Lisbon, Portugal); Sónia Afonso (Instituto Ciencias Nucleares Aplicadas a Saude, Universidade de Coimbra, Coimbra, Portugal); Ricardo Taipa (Neuropathology Unit and Department of Neurology, Centro Hospitalar do Porto - Hospital de Santo António, Oporto, Portugal); Paola Caroppo, Giuseppe Di Fede, Giorgio Giaccone, Sara Prioni, Veronica Redaelli, Giacomina Rossi, Pietro Tiraboschi (Fondazione IRCCS Istituto Neurologico Carlo Besta, Milano, Italy); Diana Duro, Maria Rosario Almeida, Miguel Castelo-Branco (Faculty of Medicine, University of Coimbra, Coimbra, Portugal), Maria João Leitão (Centre of Neurosciences and Cell biology, Universidade de Coimbra, Coimbra, Portugal), Miguel Tabuas-Pereira, Beatriz Santiago (Neurology Department, Centro Hospitalar e Universitario de Coimbra, Coimbra, Portugal); Serge Gauthier (Alzheimer Disease Research Unit, McGill Centre for Studies in Aging, Department of Neurology & Neurosurgery, McGill University, Montreal, Québec, Canada), Pedro Rosa-Neto (Translational Neuroimaging Laboratory, McGill Centre for Studies in Aging, McGill University, Montreal, Québec, Canada), Michele Veldsman (Nuffield Department of Clinical Neurosciences, Medical Sciences Division, University of Oxford, Oxford, UK); Toby Flanagan (Faculty of Biology, Medicine and Health, Division of Neuroscience and Experimental Psychology, University of Manchester, Manchester, UK); Catharina Prix, Tobias Hoegen, Elisabeth Wlasich, Sandra Loosli, Sonja Schonecker (Neurologische Klinik, Ludwig-Maximilians-Universität München, Munich, Germany); Elisa Semler, Sarah Anderl-Straub (Department of Neurology, University of Ulm, Ulm); Luisa Benussi, Giuliano Binetti, Roberta Ghidoni, Michela Pievani (Instituto di Recovero e Cura a Carattere Scientifico Istituto Centro San Giovanni di Dio Fatebenefratelli, Brescia, Italy); Gemma Lombardi, Benedetta Nacmias, Camilla Ferrari, Valentina Bessi (Department of Neuroscience, Psychology, Drug Research, and Child Health, University of Florence, Florence, Italy).
Contributors CH and JR contributed to the study design, acquisition, analysis and interpretation of the data as well as drafting and revising the manuscript. All other authors (MSF, AJH, HZ, KM, RC, MB, MN, DMC, DT, CVG, IOCW, RS, JCVS, FM, RS-V, BB, RJrL, MM, MCT, CG, DG, JBR, EF, MS, RV, AdeM, FT, IS, SD, CRB, AG, JL, AD, GF, SS, MO) contributed to the acquisition of data and study coordination as well as helping to critically review and revise the manuscript.
Funding The GENFI study has been supported by the Medical Research Council UK (MR/M023664/1), the Italian Ministry of Health and the Canadian Institutes of Health Research as part of a Centres of Excellence in Neurodegeneration grant, as well as other individual funding to investigators. This work was supported by the NIHR Queen Square Dementia Biomedical Research Unit, the NIHR UCL/H Biomedical Research Centre and the Leonard Wolfson Experimental Neurology Centre (LWENC) Clinical Research Facility, Alzheimer’s Research UK, the Brain Research Trust and the Wolfson Foundation as well as an Alzheimer's Society grant (AS-PG-16-007). The biomarker measurements were funded in part by the UK Dementia Research Institute at UCL and by a Wellcome Trust Multi-User Equipment Grant. KM has received funding from an Alzheimer’s Society PhD studentship. IOCW is supported by a MRC Clinical Research Training Fellowship (MR/M018288/1). RS-V is supported by an Alzheimer's Research UK Clinical Research Training Fellowship (ARUK-CRF2017B-2). JCVS was supported by the Dioraphte Foundation grant 09-02-03-00, the Association for Frontemporal Dementias Research Grant 2009, The Netherlands Organization for Scientific Research (NWO) grant HCMI 056-13-018, ZonMw Memorabel (Deltaplan Dementie, project number 733 051 042), Alzheimer Nederland and the Bluefield project. CG received funding from JPND-Prefrontals VR Dnr 529-2014-7504, VR 2015-02926 and 2018-02754, the Swedish FTD Initiative-Schörling Foundation, Alzheimer Foundation, Brain Foundation and Stockholm County Council ALF. DG received support from the EU Joint Programme—Neurodegenerative Disease Research (JPND) and the Italian Ministry of Health (PreFrontALS) grant 733051042. RS-V has received funding from Fundació Marató de TV3, Spain (grant no. 20143810). FM received funding from the Tau Consortium and the Center for Networked Biomedical Research on Neurodegenerative Disease (CIBERNED). JBR has received funding from the Wellcome Trust (103838) and the National Institute for Health Research (NIHR) Cambridge Biomedical Research Centre. MO has received funding from BMBF (FTLDc). MM has received funding from a Canadian Institutes of Health Research operating grant and the Weston Brain Institute and Ontario Brain Institute. RV has received funding from the Mady Browaeys Fund for Research into Frontotemporal Dementia. EF has received funding from a CIHR grant #327387. HZ is a Wallenberg Academy Fellow. JR is a MRC Clinician Scientist (MR/M008525/1) and has received funding from the NIHR Rare Diseases Translational Research Collaboration (BRC149/NS/MH), the Bluefield Project and the Association for Frontotemporal Degeneration.
Competing interests None declared.
Patient consent for publication Not required.
Ethics approval Local ethics committees at each site approved the study and all participants provided written informed consent at enrolment.
Provenance and peer review Not commissioned; externally peer reviewed.
Data availability statement Data are available on reasonable request. Some GENFI data is available on reasonable request through application to the GENFI Data Access Committee.