Article Text

Abstract
Objective PARADIGMS demonstrated superior efficacy and comparable safety of fingolimod versus interferon β-1a (IFN β-1a) in paediatric-onset multiple sclerosis (PoMS). This study aimed to report all predefined MRI outcomes from this study.
Methods Patients with multiple sclerosis (MS) (aged 10–<18 years) were randomised to once-daily oral fingolimod (n=107) or once-weekly intramuscular IFN β-1a (n=108) in this flexible duration study. MRI was performed at baseline and every 6 months for up to 2 years or end of the study (EOS) in case of early treatment discontinuation/completion. Key MRI endpoints included the annualised rate of formation of new/newly enlarging T2 lesions, gadolinium-enhancing (Gd+) T1 lesions, new T1 hypointense lesions and combined unique active (CUA) lesions (6 months onward), changes in T2 and Gd+ T1 lesion volumes and annualised rate of brain atrophy (ARBA).
Results Of the randomised patients, 107 each were treated with fingolimod and IFN β-1a for up to 2 years. Fingolimod reduced the annualised rate of formation of new/newly enlarging T2 lesions (52.6%, p<0.001), number of Gd+ T1 lesions per scan (66.0%, p<0.001), annualised rate of new T1 hypointense lesions (62.8%, p<0.001) and CUA lesions per scan (60.7%, p<0.001) versus IFN β-1a at EOS. The percent increases from baseline in T2 (18.4% vs 32.4%, p<0.001) and Gd+ T1 (–72.3% vs 4.9%, p=0.001) lesion volumes and ARBA (–0.48% vs −0.80%, p=0.014) were lower with fingolimod versus IFN β-1a, the latter partially due to accelerated atrophy in the IFN β-1a group.
Conclusion Fingolimod significantly reduced MRI activity and ARBA for up to 2 years versus IFN β-1a in PoMS.
This is an open access article distributed in accordance with the Creative Commons Attribution Non Commercial (CC BY-NC 4.0) license, which permits others to distribute, remix, adapt, build upon this work non-commercially, and license their derivative works on different terms, provided the original work is properly cited, appropriate credit is given, any changes made indicated, and the use is non-commercial. See: http://creativecommons.org/licenses/by-nc/4.0/.
Statistics from Altmetric.com
Introduction
The overall incidence of paediatric-onset multiple sclerosis (PoMS) is estimated to range from 0.18 to 0.79 per 100 000 children,1–4 except in a few regions where a higher incidence of >2.6 per 100 000 children was reported.5–7 PoMS has a higher relapse rate, that is, a highly active inflammatory disease course, compared with adult-onset multiple sclerosis (MS).8 9
Brain MRI plays an important role in diagnosing and monitoring the characteristics of inflammatory lesions and brain volume in MS.10 The rate of accrual of new T2 lesions in the first few years after PoMS is higher than in adults.11 PoMS is associated with failure of age-expected brain growth during childhood and early adolescence, and brain atrophy from disease-onset to mid-adolescence and into adulthood.12–14 Findings suggest that T2 and T1 lesion volumes are comparable in patients with paediatric-onset and adult-onset MS when matched for disease duration.15 Higher T2 lesion volumes correlate with reduced thalamic volumes in paediatric patients, and total thalamic volumes are reduced relative to age-expected values, even after correcting for reductions in head size.12 Despite having more frequent brain lesions in PoMS,12 16 disability progression is slower than in adult-onset MS,17potentially due to a heightened compensatory capacity of children during the initial phase of the disease.15 Retrospective cohort data, however, suggest that patients with PoMS reach moderate-to-severe disability at an earlier age compared with adult-onset MS.17 18
The mainstay of treatment for paediatric patients with relapsing MS includes agents approved for use in adults with MS such as interferon (IFN) β and glatiramer acetate.18 19 More than 40% of patients ultimately are switched to a high-efficacy disease-modifying therapy (DMT) due to suboptimal response.20 Data on the treatment of PoMS are mainly supported by observational open-label studies. The results of the first global randomised phase 3 clinical trial in patients with paediatric MS—PARADIGMS—have been published.21 This study showed superior reduction with fingolimod treatment in annualised relapse rate (82% relative reduction, p<0.001) and annualised rate of formation of new or enlarging T2 lesions (52.6% relative reduction, p<0.001) compared with IFN β-1a at up to 24 months.21 The US Food and Drug Administration and European Union approved fingolimod for the treatment of paediatric patients (10 years of age and above) with relapsing MS in the USA22 and in Europe.23 The present study reports the effect of fingolimod versus IFN β-1a on all predefined MRI outcomes and post hoc analyses of MRI data from the PARADIGMS study.
Methods
Study design and patient population
PARADIGMS was a double-blind, active-controlled, parallel-group, multicentre study. The study was conceptualised as a flexible duration design24 comprising a core phase of up to 2 years, followed by a 5-year fingolimod open-label extension phase, in paediatric patients with MS aged 10–<18 years at enrolment. Patients were randomised (1:1) to receive either oral fingolimod (dose adjusted for body weight, 0.5 mg once daily for >40 kg and 0.25 mg once daily for ≤40 kg) or intramuscular IFN β-1a 30 µg once weekly in a double-dummy design.
The study included patients who had been previously treated or were treatment-naïve who experienced at least one relapse in the past year or two relapses in the previous 2 years, or who had evidence of one or more gadolinium-enhancing (Gd+) lesion on T1-weighted MRI within 6 months prior to randomisation (including screening MRI) with an Expanded Disability Status Scale score of 0–5.5. Patient assessments during screening and baseline included a central review process of the diagnosis of paediatric MS by independent experts, on the basis of the patient’s clinical history and MRI scans. Further details of the study design and population are reported elsewhere (PARADIGMS ClinicalTrials.gov number, NCT01892722).21
MRI assessments and outcomes
MRI was assessed for all patients at screening and at months 6, 12, 18 and 24 or at the end of the study (EOS) in case of early discontinuation or early completion of study treatment. The MRI scans were analysed independently at a central reading centre (NeuroRx Research, Montreal, Quebec, Canada).
The key MRI endpoint was the annualised rate of formation of new/newly enlarging T2 lesions up to month 24 (key secondary endpoint of the PARADIGMS study). Other secondary MRI endpoints included the proportion of patients free of Gd+ T1 lesions at EOS, number of Gd+ T1 lesions per scan up to EOS and volume of Gd+ T1 lesions at EOS.
Prespecified exploratory MRI endpoints included the proportion of patients free of new/newly enlarging T2 lesions up to month 24, change in T2 lesion volume at EOS, annualised rate of new T1 hypointense lesion formation up to month 24 and change in volume of T1 hypointense lesions at EOS. The percent brain volume change (PBVC) from baseline to EOS and annualised rate of brain atrophy (ARBA) were also assessed. The brain volume at baseline was calculated using a modified version of SIENAx V.5.0.4 software, in which the segmentation maps of lesions were integrated into the white matter mask and considered part of the white matter volume. Further details are summarised in the online supplementary material. The PBVC was measured using the Paired Jacobian Integration method.25 26 The ARBA was calculated from the PBVC, as = ((PBVC/100+1)ˆ(365.25/#days) −1)×100, where ‘days’ stands for the scan date relative to day 1 for the primary analysis and relative to the date of the month 6 scan for the sensitivity analysis. ARBA is the PBVC per year, which corrects for differences in study duration between patients.27 Exploratory MRI endpoints also assessed the number of combined unique active (CUA) lesions (Gd+ lesions (for scans acquired with Gd) plus new/enlarging T2 lesions not associated with gadolinium (Gd enhancement) on scans after 6 months up to month 24 and the proportion of patients free of CUA lesions at EOS.
Supplemental material
MRI procedure
Prior to the start of the study, the neuroradiologist and MRI technician at each site were provided with an MRI manual, technical implementation documents, image quality requirements and administrative procedures. Each site performed a dummy run on a healthy child or an adult volunteer (unless it was specified by the site to be performed on a patient with MS) to ensure standardised image contrast across sites. Once the dummy run was accepted, all the parameter settings for the study-specific MRI sequences were unchanged for the duration of the study.
The primary treating physician was not allowed to view the MRI scans during the study in order to maintain blinding. A local neuroradiologist reviewed the MRI scans to see if new lesions were present. In cases of unexpected findings (eg, findings not consistent with MS) observed during the study, the primary treating physician was further notified by a local neuroradiologist. The central blinded MRI reading centre provided MRI notifications during the core phase of the study if specified MRI activity criteria were met for a given patient. The study physician was notified if the following criteria were met: ≥5 Gd+ lesions on the month 6 scan and ≥5 CUA lesions on the month 12 scan (notification triggered at month 12), ≥5 CUA lesions on the month 12 scan and ≥5 new/enlarging T2 lesions on the month 18 scan (notification triggered at month 18), or ≥5 new/enlarging T2 lesions on the month 18 scan and ≥5 new/enlarging T2 lesions on the month 24 scan (notification triggered at month 24). Only Gd+ lesions were considered at month 6 in order to assess MRI activity after sufficient time had elapsed for the treatment to become effective. Only new/enlarging T2 lesions were considered from month 18 onwards, as increasing concerns about potential toxicity of gadolinium led to removal of the requirement for gadolinium administration during the conduct of the study.
During the study, the MRI reading centre reviewed the MRI scan to evaluate quality, completeness and protocol adherence. If a scan was incomplete or incorrectly performed, the study centre was requested to repeat it as soon as possible. After passing quality control, all scans were analysed according to the MRI protocol. The time point of EOS is the last MRI scan available during the blinded trial. Modifications in the MRI schedule were followed to avoid potential confounding effects of steroids for the treatment of MS relapse. In the case of relapse, no MRI scan was performed while a patient was on intravenous steroid therapy and within the 30 days following termination of steroid therapy. The number and volume of Gd+ lesion data obtained <30 days after use of a steroid for treatment of relapses was excluded from the Gd+ T1 analysis.
Scanning and sequences
The following five sequences were acquired: proton density-weighted, T2-weighted and T1-weighted scans prior to gadolinium injection, whereas fluid attenuated inversion recovery (FLAIR) and T1-weighted scans after gadolinium injection. The FLAIR sequence was acquired after administration of gadolinium during the 10 min wait period before acquiring the post-gadolinium scan. Resolution of all scans was approximately 1×1 mm in plane and 3 mm out of plane. The use of contrast medium was optional from month 18; sites were allowed to use contrast medium if this was normally done as part of the site’s routine clinical practice. Magnetic field strengths included both 1.5 Tesla (1.5T) and 3T (table 1). Further details on each sequence are summarised in online supplementary table S1.
Scan geometry for MRI sequences
Statistical analysis
All the MRI outcomes were analysed on the full analysis set (FAS), comprising all randomised patients who received at least one dose of the study drug. The annualised rate of formation of new/enlarging T2 lesions (key secondary endpoint) was also analysed on the per-protocol set (all FAS patients with no major protocol deviations) as a supportive analysis. In addition, a sensitivity analysis for the annualised rate of formation of new/enlarging T2 lesions was performed on the FAS population after the exclusion of patients in the IFN β-1a group who were neutralising antibody positive at the EOS visit. EOS was defined as the last assessment taken on or before the final study visit date. The number of new/enlarging T2 lesions was also analysed in the DMT-naïve subgroup, defined as patients who had not received any previous DMT prior to the study. Post hoc analyses of the number of new/enlarging T2 lesions for subject subgroups as defined by sex, age (≤12 and >12 years), body weight (≤40 and >40 kg) and treatment experience at baseline were also performed. A post hoc analysis included the proportion of patients free from new T1 hypointense lesions at EOS.
All the MRI endpoints were summarised using descriptive statistics by treatment group and visit. The annualised rate of formation of new/enlarging T2 lesions, new T1 hypointense lesions and number of CUA lesions per scan were analysed using a negative binomial regression model adjusted for treatment, region, pubertal status and the corresponding baseline value; time on study was included as an offset variable for each covariate (and subgroup by treatment interaction for relevant post hoc analyses). The least squares mean values and their 95% CI, estimates of the rate ratio and its 95% CI, and the p value for treatment comparisons are reported. The proportions of patients free of new MRI lesions were analysed using a logistic regression model adjusted for treatment, region, pubertal status and the corresponding baseline value. The volume of Gd+ lesions, T2 lesions and T1 hypointense lesions on MRI were analysed via a rank analysis of covariance (ANCOVA) model adjusted for treatment, region, pubertal status and relevant baseline values. The PBVC and ARBA up to Month 24 were analysed using an ANCOVA model adjusted for treatment, region, pubertal status and the corresponding baseline brain volume. Furthermore, a post hoc sensitivity analysis for PBVC re-baselined to the month six scan, PBVC in patients with no Gd+ lesions at baseline and PBVC in patients with ≥1 Gd+ lesions at baseline was conducted using the same approach. The least squares mean and its 95% CI, the estimate of between-group difference and its 95% CI, and the p value for treatment comparisons are reported from the ANCOVA model.
Results
Patient disposition and baseline characteristics
Of 348 unique screenings (patients could be screened more than once), 215 patients were randomised into the study (fingolimod, n=107; IFN β-1a, n=108). Of the randomised patients, 214 received study medication and were included in the FAS (fingolimod, n=107; IFN β-1a, n=107). The per-protocol set consisted of 197 patients. In total, 188 patients completed the core phase of the study (fingolimod, 100 (93.5%); IFN β-1a, 88 (81.5%)) between July 2013 and August 2017. The sensitivity analysis that excluded IFN neutralising antibody-positive patients included 98 patients out of 107 in the IFN β-1a treatment group. Further details on patient disposition and baseline characteristics are reported in the primary paper.21
Overall, the mean (SD) age of the study population was 15.3 (1.81) years, ranging between 10 and <18 years at randomisation. Most patients were Caucasian (~92%) and female (~62%); 10 patients were in the prepubertal (Tanner staging score <2) at randomisation. The mean body mass index was 22.5 (4.51) kg/m2. Overall, MS and MRI characteristics at baseline were comparable between the two treatment groups. Of note, a lower proportion of patients in the fingolimod group were free of Gd+ T1 lesions at baseline compared with the IFN β-1a group (table 2). More patients in the fingolimod group compared with the IFN β-1a group completed on-study treatment at 18 months (69% vs 51%) and 24 months (28% vs 18%). Overall, the median duration of exposure was 634 and 547 days for the fingolimod and IFN β-1a treatment groups, respectively. This exposure corresponded to 176.0 patient-years in the fingolimod group and 153.4 patient-years in the IFN β-1a group.
Patient demographics and baseline characteristics (randomised; intention-to-treat cohort)
MRI outcomes
New/enlarging T2 lesions
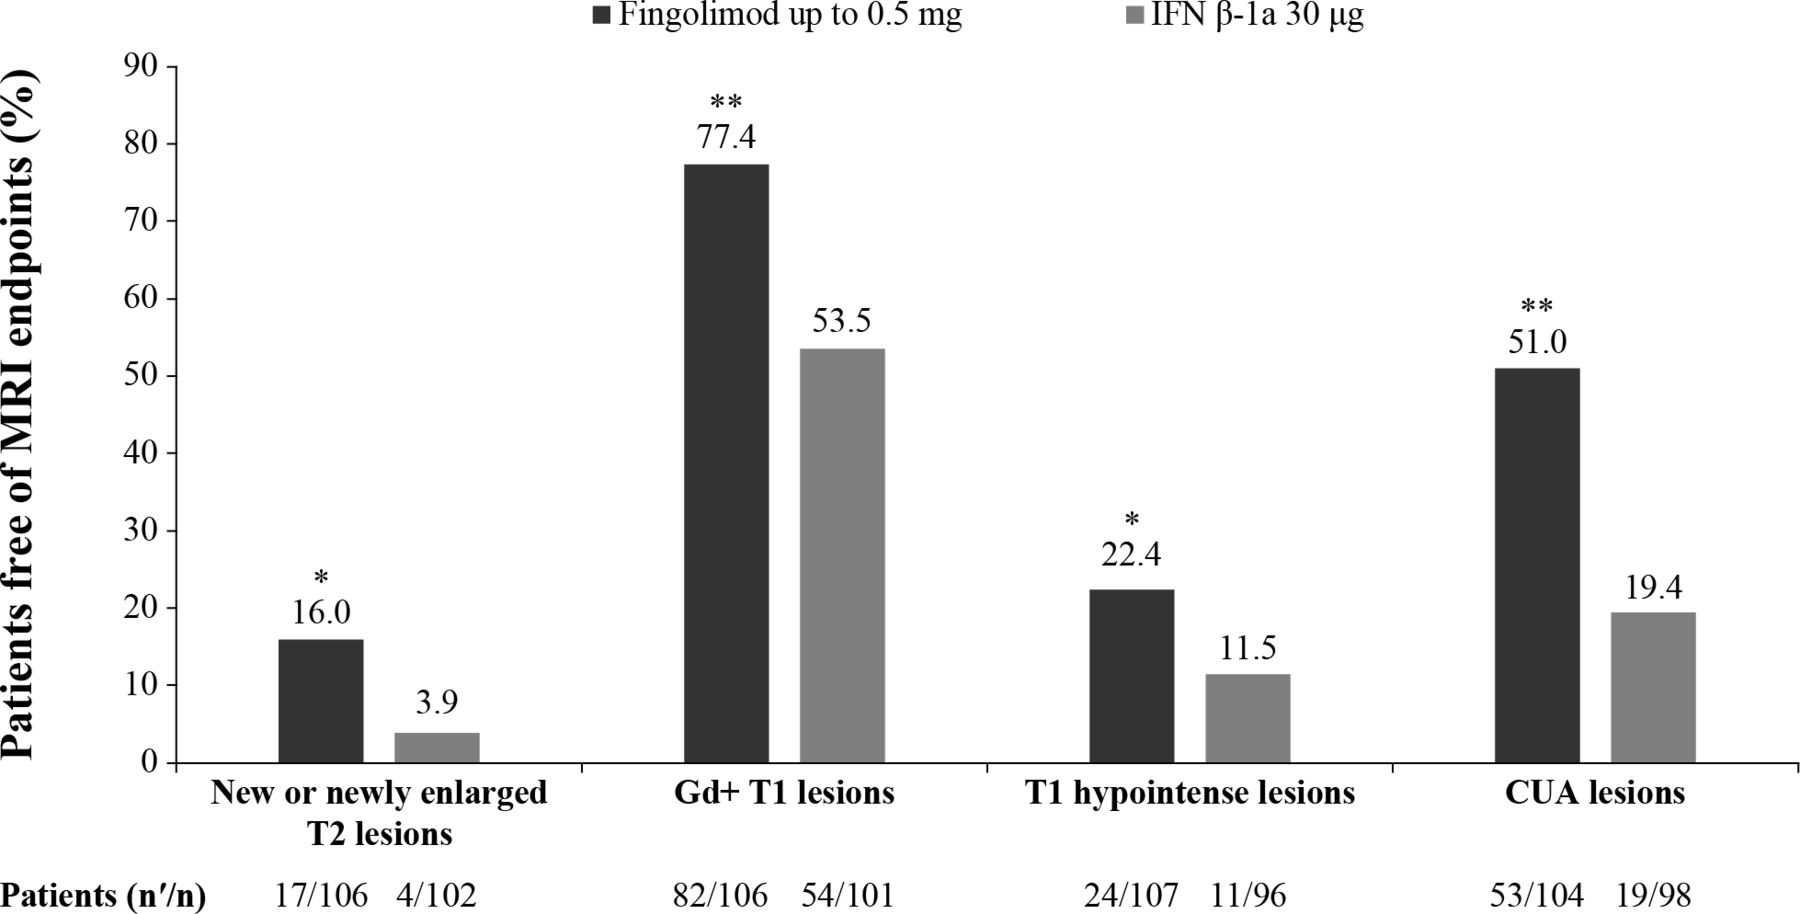
The annualised rate of formation of new/enlarging T2 lesions up to EOS was the predefined key secondary endpoint of the study and was lower in patients treated with fingolimod compared with IFN β-1a (52.6% relative reduction, p<0.001; table 3).21 The robustness of this result was further confirmed by supportive analyses in the per-protocol set, which demonstrated a similar risk reduction (month 0 to EOS: 51.6% relative reduction, p<0.001).28 In addition, further supporting the robustness of the results, a sensitivity analysis excluding patients positive for interferon neutralising antibodies in the IFN β-1a treatment group showed a slightly lower risk reduction in this result at EOS (47.6%, p<0.00128; figure 1). The proportion of patients free of new/enlarging T2 lesions at EOS was higher in fingolimod-treated patients compared with those treated with IFN β-1a (16.0% vs 3.9%, p=0.011; figure 2). The mean per cent increase in T2 lesion volume from baseline at EOS was lower with fingolimod treatment compared with IFN β-1a (18.4% vs 32.4%, p<0.001; table 4).

Annualised rate of the number of new/enlarging T2 lesions from baseline by time point (sensitivity analysis)ˆ. *p≤0.05 vs IFN β-1a; **p≤0.001 vs IFN β-1a. Data are expressed as adjusted mean±95% CI. n, number of patients included in each analysis. EOS is defined as the last assessment taken on or before the final study phase visit date. ˆAnalysis excluding patients positive for neutralising antibodies in the IFN β-1a treatment group–nine IFN patients were positive for antibodies. aObtained from fitting a negative binomial regression model adjusted for treatment, region, pubertal status (the stratification factor in IVRS) and baseline number of T2 lesions (offset: time on study). EOS, end of the study; IFN, interferon; IVRS, interactive voice response system.

Proportion of patients free of MRI endpoints (FAS). *p≤0.05 vs IFN β-1a; **p≤0.001 vs IFN β-1a. nʹ, number of patients free from MRI outcomes; n, number of patients included in each analysis. CUA lesion count is defined as Gd+ lesions plus new/newly enlarging T2 lesions not associated with Gd enhancement for scans performed after Gd administration, or only new/newly enlarging T2 lesions for scans done without contrast. CUA lesions were measured from 12 months onwards. EOS is defined as the last assessment taken on or before the final study phase visit date. Proportions of patients free from new MRI lesions were analysed using a logistic regression model adjusted for treatment, region, pubertal status and the corresponding baseline value. CUA, combined unique active; EOS, end of the study; FAS, full analysis set; Gd+, gadolinium-enhancing; IFN, interferon.
Effect of fingolimod on MRI inflammatory lesion activity at EOS (FAS)
Effect of fingolimod on MRI volumes at EOS (FAS)
Gd+ T1 lesions
Treatment with fingolimod resulted in a 66.0% reduction in the number of Gd+ T1 lesions per scan compared with IFN β-1a at EOS (p<0.001; table 3).21 A higher proportion of patients in the fingolimod group were free of Gd+ T1 lesions compared with the IFN β-1a group at EOS (77.4% vs 53.5%, p<0.001; figure 2). The mean percent change in Gd+ T1 lesion volume from baseline showed a decrease in fingolimod-treated patients compared with a slight increase in those treated with IFN β-1a over the study period (–72.3% vs 4.9%, p=0.001; table 4).
T1 hypointense lesions
The annualised rate of formation of new T1 hypointense lesions was reduced with fingolimod treatment compared with the IFN β-1a group at EOS (62.8% rate reduction, p<0.001; table 3). This reduction in new T1 lesion formation was consistently observed in fingolimod-treated patients compared with IFN β-1a throughout the study. The percent change from baseline in T1 hypointense lesion volume between the fingolimod and IFN β-1a treatment groups was not significant at EOS (table 4) and consistently did not reach statistical significance throughout the study. The post hoc analysis results showed that the proportion of patients free of new T1 hypointense lesions was higher with fingolimod treatment than with IFN β-1a at EOS (22.4% vs 11.5%, p<0.048).
CUA lesions
The CUA lesions were reported at month 12 onwards. There was a significant reduction in the number of CUA lesions per scan at months 12, 18, 24 and EOS with fingolimod treatment compared with IFN β-1a (figure 3). A relative reduction rate of 60.7% (p<0.001) was observed at EOS (table 3). Treatment with fingolimod resulted in more patients free of CUA lesions at EOS (51.0% vs 19.4%; p<0.001; figure 2).

Mean number of CUA lesions per scan by time point (FAS). *p≤0.05 vs IFN β-1a; **p≤0.001 vs IFN β-1a. Data are expressed as adjusted mean±95% CI. n, total number of patients with an available result for the corresponding time point or time window and included in the analysis. CUA lesion count is defined as Gd+ lesions plus new or newly enlarging T2 lesions not associated with Gd enhancement for scans performed after Gd administration, or only new or newly enlarging T2 lesions for scans done without contrast. CUA lesions were measured from 6 months onwards. EOS is defined as the last assessment taken on or before the final study phase visit date. aObtained from fitting a negative binomial regression model adjusted for treatment, region, pubertal status (the stratification factor in IVRS), baseline number of Gd+ T1 lesions and baseline number of T2 lesions (offset: number of MRI scans). CUA counts based on data obtained <30 days after steroid treatment was used to treat MS relapses are excluded. CUA, combined unique active; EOS, end of the study; FAS, full analysis set; Gd+, gadolinium-enhancing; IFN, interferon; IVRS, interactive voice response system; MS, multiple sclerosis.
Percent brain volume change
Fingolimod treatment resulted in reduction of ARBA versus IFN β-1a (−0.48% vs −0.80%), with a between-treatment difference of 0.32 (p=0.014; table 4) at EOS.21 Significantly lower brain volume loss was observed in fingolimod-treated patients at months 6, 12, 18 and 24 and EOS than in IFN β-1a–treated patients (figure 4). The sensitivity analysis (post hoc) re-baselined to the month 6 scan showed a numerical but not statistically significant lower BVL for fingolimod-treated patients (figure 5). A box and whisker plot of the ARBA (re-baselined 6 months) at EOS is provided in the online supplementary figure S1. Similar trends in favour of fingolimod compared with IFN β-1a were observed in patients who had no Gd+ lesions at baseline (online supplementary figure S2) and those who had ≥1 Gd+ lesions at baseline (online supplementary figure S3).
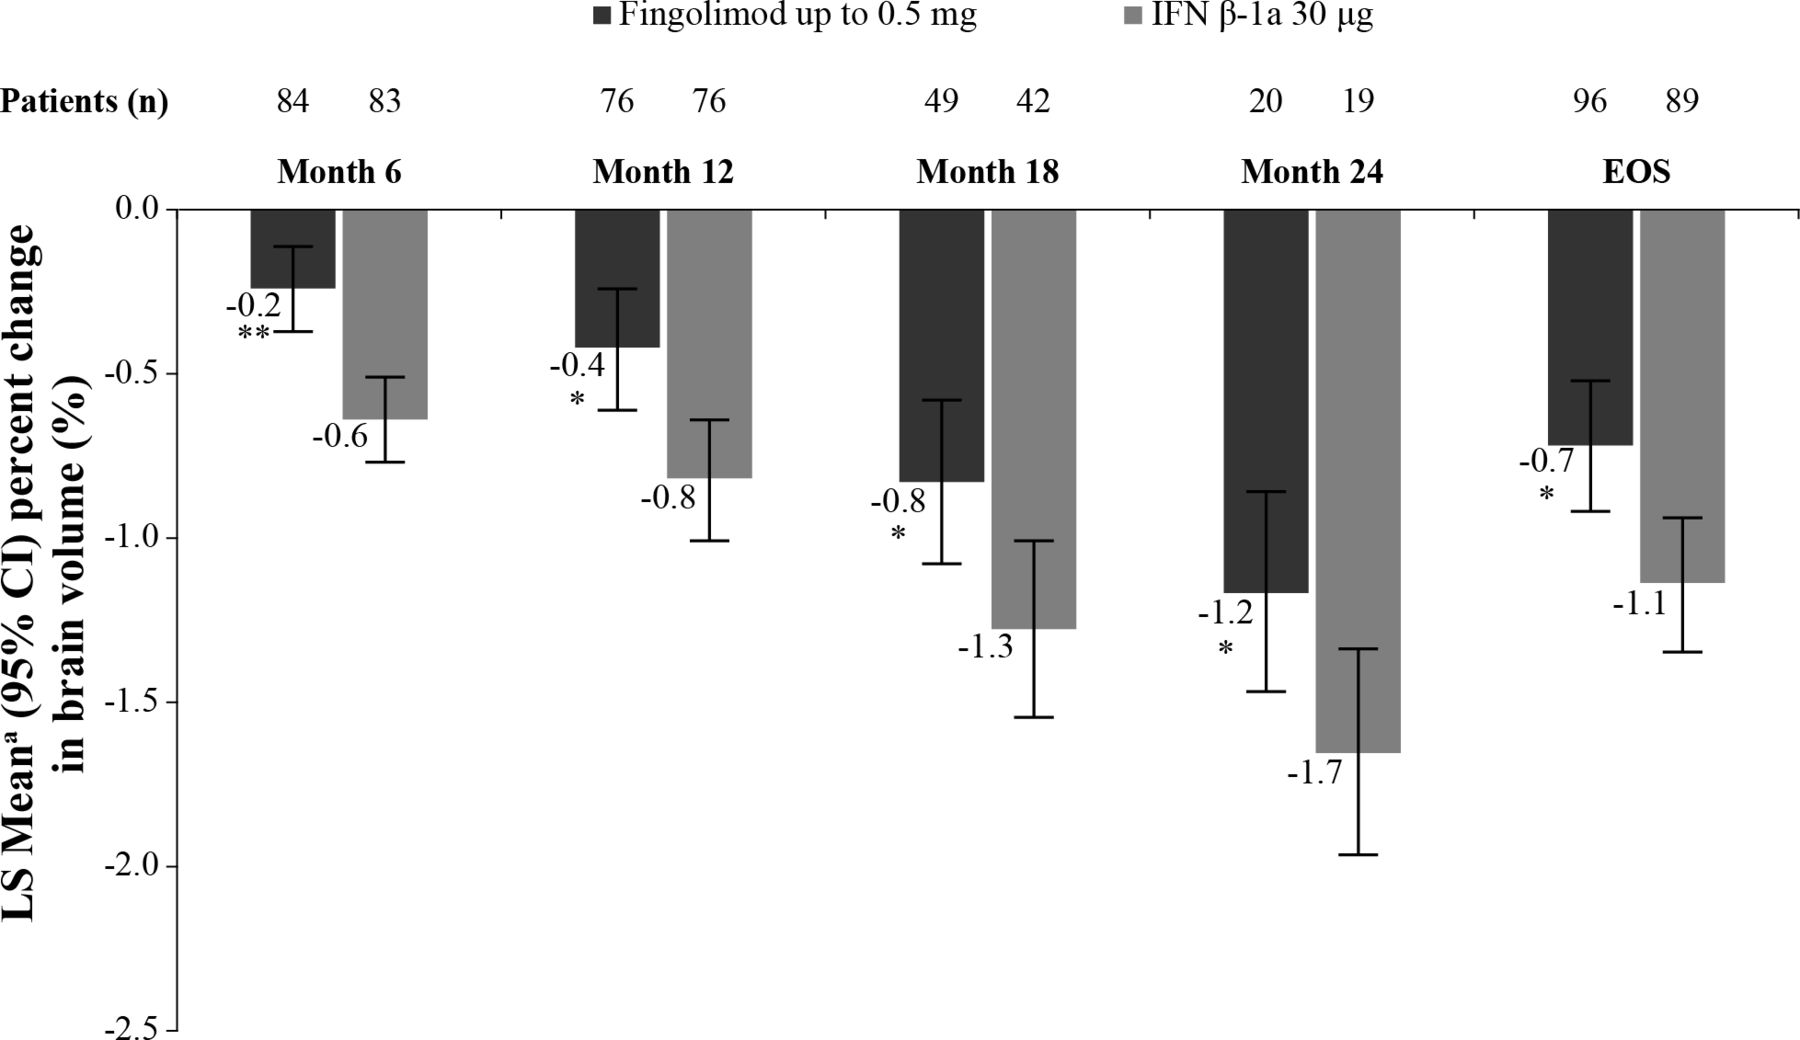
Percent change from baseline in brain volume by time point (FAS). *p≤0.05 vs IFN β-1a; **p≤0.001 vs IFN β-1a. Data are expressed as adjusted mean±95% CI. n, number of patients included in each analysis. EOS is defined as the last assessment taken on or before the final study phase visit date. aObtained from fitting an ANCOVA model adjusted for treatment, region, pubertal status (the stratification factor in IVRS) and baseline normalised brain volume. ANCOVA, analysis of covariance; EOS, end of the study; FAS, full analysis set; IFN, interferon; IVRS, interactive voice response system.

Percent change in brain volume (re-baselined from 6 months) by time point (FAS). Data are expressed as adjusted mean±95% CI. n, number of patients included in each analysis. EOS is defined as the last assessment taken on or before the final study phase visit date. aObtained from fitting an ANCOVA model adjusted for treatment, region, pubertal status (the stratification factor in IVRS) and 6-month baseline normalised brain volume as covariates. ANCOVA, analysis of covariance; EOS, end of the study; FAS, full analysis set; IFN, interferon; IVRS, interactive voice response system.
Post hoc analyses of new/enlargingT2 lesions
Compared with baseline, the annualised rate of new/enlarging T2 lesions for each subgroup—sex, age, body weight, and treatment experience at baseline—was consistently lower in the fingolimod group than in the IFN β-1a group at EOS (table 5). There was a reduction in the annualised rate of formation of new/enlarging T2 lesions at EOS with fingolimod compared with IFN β-1a in both male (54.2%, p<0.001) and female (53.2%, p<0.001) and in subgroups of patients aged >12 years (53.7%, p<0.001) and weighing >40 kg (53.0%, p<0.001), as well as prior DMT-experienced patients (51.4%, p=0.002) and in the DMT-naïve subgroup (53.4%, p<0.001).28
Annualised rate of new/enlargingT2 lesions at EOS by subgroups (FAS)
Discussion
In this first randomised phase 3 study in paediatric patients with MS (aged 10–<18 years), fingolimod significantly reduced brain MRI activity and slowed the annualised rate of brain volume loss compared with IFN β-1a for up to 2 years. Compared with IFN β-1a, treatment with fingolimod resulted in relative risk reductions of 52.6% for new/enlarging T2 lesions, 66% for Gd+ lesions and 60.7% for CUA lesions, as well as reduction of ARBA (between-treatment difference: 0.32). Approximately 77% of patients in the fingolimod group and 54% in the IFN β-1a group were free of Gd+ lesions at EOS. Furthermore, 51% of patients on fingolimod and 19.4% of patients on IFN β-1a were free of Gd+ lesions or new/enlarging T2 lesions not associated with Gd enhancement (ie, accrued CUA lesions). Subgroup analysis results found that the relative reduction in annualised rate of formation of new/enlargingT2 lesions was similar in both male and female, and in patients who were DMT-naïve or DMT-experienced at baseline, consistent with the findings in the overall study population, confirming the efficacy of fingolimod treatment in children regardless of sex or prior treatment experience. When analysed by age and body weight, patients treated with fingolimod had consistently lower lesion counts. This was significant only for patients aged >12 years or with body weight >40 kg at baseline, likely related to the low sample size in patients ≤12 years of age and with a body weight <40 kg.
MRI disease activity in the paediatric population was generally higher at baseline (mean age: 15.3 years; T2 lesion volume 10 207 mm3; Gd+ T1 lesions 2.9) than the disease activity observed in a comparable adult population recruited for an actively controlled clinical trial (mean age: 36 years; T2 lesion volume 4924 mm3; Gd+ T1 lesions 1.06).29 The high baseline disease activity observed in the present study is consistent with previous observations of higher activity in young adult patients30 compared with adult-onset MS. For example, the disease activity as measured by the annualised rate of formation of new/enlarging T2 lesions and number of Gd+ T1 lesions per scan after at least 3 months were 4.39 and 0.44, respectively, with fingolimod treatment and 9.27 and 1.28, respectively, with IFN β-1a in the present study. The T2 lesion rate in our study was 2.6-fold greater with fingolimod and 3.5-folder greater with IFN β-1a than observed in adult patients with MS in the 12-month TRANSFORMS study (fingolimod: 1.7 and IFN β-1a: 2.6).29 Similarly, Gd+ T1 lesion rate was 2.0-fold greater with fingolimod and 2.5-fold greater with IFN β-1a than observed in the TRANSFORMS study (fingolimod: 0.23 and IFN β-1a: 0.51).29 This finding of higher inflammatory activity in the paediatric population compared with adults is further substantiated by looking at the proportion of patients free of T2 lesions. The proportions of patients free of T2 lesions were approximately 3.4-fold lower on fingolimod (16%) and 12-fold lower on IFN β-1a (3.9%) in the present paediatric study compared with the adult TRANSFORMS study (fingolimod: 54.8%; IFN β-1a: 45.7%).29 Thus, our findings from the first randomised controlled clinical trial in paediatric patients with MS confirms that inflammatory disease activity in children with MS is substantially higher than in adult patients with MS.
Due to the high frequency of new lesion formation in the paediatric patients in the present study and the time it takes for DMTs to achieve full efficacy, only 24% of patients were free of new/newly enlarging T2 lesions on the month six scan. An analysis of activity re-baselined to the scan at 6 months was conducted using CUA lesions, which were assessed from 12 months onwards (with reference to the previous scan). Approximately 51% of the patients on fingolimod and 19.4% of the patients on IFN β-1a were free of CUA lesions from month 6 to EOS.
Achievement of no evidence of disease activity may be an outcome of interest for future studies, but the present study suggests that no evidence of disease activity in paediatric patients with MS may not be observed even with agents that demonstrate a powerful effect on clinical disease.
In contrast to placebo-controlled studies, the present study showed a greater suppression of relapses (82%)21 than MRI activity (52.6% for new/newly enlarging T2 lesions; 66.0% for Gd+ lesions). This can be attributed to the use of the active comparator, IFN β-1a, which itself suppresses MRI activity more than relapses (28%–57% vs 18%, respectively).31–34
Children with MS have a smaller head size, brain volume and thalamic volume compared with age-matched and sex-matched healthy children, and failure of age-anticipated brain growth.11-13 Our study observed a relative reduction of 40% in brain volume loss with fingolimod compared with IFN β-1a which itself slows brain volume loss over 2 years.35 A large part of this difference appeared in the first 6 months following treatment initiation, and may have reflected the accelerated atrophy known to occur after initiation of treatment with IFN β-1a.36 Subsequent differences between groups in brain volume were smaller, and only numerically (ie, not significantly) in favour of fingolimod, reflecting a slowing of atrophy with fingolimod that is greater than that expected to occur with IFN β-1a.37 Despite treatment, these young patients showed brain volume loss rather than age-anticipated increases, emphasising the negative impact of MS in the maturing central nervous system. The resilience of children to the development of early physical disability should not be a cause for complacency with respect to the need for highly effective therapies. Furthermore, considerations relating to whether a given therapy is capable of mitigating the progressive brain atrophy seen in PoMS require more information relating to the natural history of brain volume loss and the potential that MS has a particularly detrimental impact on brain maturation unique to the paediatric MS population.
The behaviour of T1 hypointense lesion volume deserves special consideration. The percentage increase in T1 hypointense lesion volume was substantially greater than the percentage increase in T2-weighted lesion volume, and the number of new T1 hypointense lesions may have been greater than the number of new/enlarging T2-weighted lesions. These observations may be explained by the recent findings related to ongoing degeneration within existing T2-weighted lesions,38 and may indicate that degenerative processes associated with progressive disease are already present in PoMS. This finding also suggests that even very young patients with MS fail to fully remyelinate within lesions, further emphasising the need for therapies that reduce new T2 lesion formation.
We conclude that treatment with fingolimod showed better efficacy compared with IFN β-1a in reducing MRI activity, relapses and brain volume loss, supporting the overall beneficial effect of fingolimod in paediatric patients with MS. Fingolimod provides an effective treatment option for children and adolescents with MS.
Acknowledgments
The authors acknowledge the patients, investigators and staff at participating sites for supporting the conduct of the study. All named authors meet the International Committee of Medical Journal Editors (ICMJE) criteria for authorship for this manuscript, take responsibility for the integrity of the work as a whole and have given final approval to the version to be published. All authors are responsible for intellectual content and data accuracy. We thank Anuja Shah (Novartis Healthcare, Hyderabad, India) for providing medical writing support, which encompassed a literature search, writing of the manuscript, formatting, referencing, preparation of tables and figures as per journal guidelines and incorporating the authors’ revisions and finalising the draft for submission, all under the direction of the authors; and Uma Kundu (Novartis Healthcare, Hyderabad, India) for review support. The article processing charges for this publication were funded by Novartis Pharma AG. The study sponsor (Novartis Pharma AG) participated in the design and conduct of the study, data collection, data management, data analysis, data interpretation and preparation, review, approval of the manuscript as well as in the writing of the report; and in the decision to submit the paper for publication. All authors had full access to all data in the study and had final responsibility for the decision to submit for publication. The corresponding author confirms that he had full access to all the data in the study and had final responsibility for the decision to submit for publication.
References
Supplementary materials
Supplementary Data
This web only file has been produced by the BMJ Publishing Group from an electronic file supplied by the author(s) and has not been edited for content.
Footnotes
Contributors DLA contributed to the study design, data acquisition, data analysis and interpretation outline review and critical revision of the manuscript. BB contributed to the interpretation of study data and critical revision of the manuscript. ABO contributed to the study concept, design, data analysis and interpretation, outline review, critical revision of the manuscript and supervision of the research. AG was involved in study execution, acquisition, data interpretation and critical revision of the manuscript. BG contributed to the study concept, data analysis and critical revision of the manuscript. EW contributed to the study design, execution, acquisition, data interpretation, outline review and critical revision of the manuscript. GG contributed to the study concept, design, execution and critical revision of the manuscript. JW contributed to the study concept, design, execution, data interpretation, outline review and critical revision of the manuscript. JG contributed to the study concept, design, acquisition, data interpretation and critical revision of the manuscript. KR contributed to data interpretation and critical revision of the manuscript. LK contributed to the study concept, design, critical revision of the manuscript and supervision of the research. MT contributed to the study execution, acquisition and critical revision of the manuscript. WB contributed to the data interpretation, outline review and critical revision of the manuscript. TS contributed to the study design, execution, acquisition, data analysis and interpretation, critical revision of the manuscript and supervision of the research. GLP contributed to the statistical analysis and data analysis. DAH contributed to the study design, execution, acquisition, statistical analysis, data analysis and interpretation, outline review and critical revision of the manuscript. MM contributed to the study concept, design, execution, acquisition, statistical analysis, data analysis and interpretation, outline review, critical revision of the manuscript and supervision of the research. TC contributed to the study concept, design, execution, data interpretation, outline review and critical revision of the manuscript.
Funding This work was supported by Novartis Pharma AG, Basel, Switzerland.
Competing interests DLA receives grant support and consultant fees from Novartis, which manufactures the drug that is tested in this study. He also has an equity interest in NeuroRx Research, which performed the MRI analyses for the study. BB reports consultant fees and personal fees during the study conduct from Novartis, which manufactures the drug that is tested in this study. ABO reports personal fees from Novartis, which manufactures the drug that is tested in this study. AG reports personal fees during the study conduct from Novartis, which manufactures the drug that is tested in this study. BG reports personal fees from Novartis during the study conduct from Novartis, which manufactures the drug that is tested in this study. EW has nothing to disclose. GG reports consultant fees for steering committee and advisory board activities during the study conduct from Novartis, which manufactures the drug that is tested in this study. JW reports consultation fees for on a data monitoring committee (not this study) and during this study for steering committee participation from Novartis, which manufactures the drug that is tested in this study. JG reports consultant fees for research, lectures and advisory boards from Novartis, which manufactures the drug that is tested in this study. KR reports consultant fees for an advisory board from Novartis, which manufactures the drug that is tested in this study. LK reports personal fees personal fees during the study conduct from Novartis, which manufactures the drug that is tested in this study. MT reports personal fees for an advisory board during the study conduct from Novartis, which manufactures the drug that is tested in this study. WB reports grant support and personal fees during the study conduct from Novartis, which manufactures the drug that is tested in this study. TS is an employee of Novartis and holds some stocks and restricted stocks of the company. GLP has nothing to disclose. DAH is an employee of Novartis. MM is an employee of Novartis and holds some stocks and restricted stocks of the company. TC reports consultant fees for steering committee and advisory board activities during the study conduct from Novartis, which manufactures the drug that is tested in this study.
Patient consent for publication Obtained.
Ethics approval The study was conducted in compliance with the ethical principles of the Declaration of Helsinki and the International Conference on Harmonisation Good Clinical Practice Guidelines. The study protocol and amendments were reviewed and approved by the Independent Ethics Committees and Institutional Review Boards for each centre as per local regulations. All patients or legal guardians of paediatric patients provided written informed consent before study entry.
Provenance and peer review Not commissioned; externally peer reviewed.
Data availability statement Data are available on reasonable request. Once the 5-year open-label extension has been completed, the reader will be able to request the raw data (anonymised) and related documents (eg, protocol, reporting and analysis plan, clinical study report) that underlie the results reported in this article by connecting to https://www.clinicalstudydatarequest.com and signing a Data Sharing Agreement with Novartis. These will be made available to qualified external researchers, with requests reviewed and approved by an independent review panel on the basis of scientific merit.
Linked Articles
- Editorial commentary