Article Text

Abstract
Objective Neurofilament light chain (NfL) is a promising biomarker in genetic frontotemporal dementia (FTD) and amyotrophic lateral sclerosis (ALS). We evaluated plasma neurofilament light chain (pNfL) levels in controls, and their longitudinal trajectories in C9orf72 and GRN cohorts from presymptomatic to clinical stages.
Methods We analysed pNfL using Single Molecule Array (SiMoA) in 668 samples (352 baseline and 316 follow-up) of C9orf72 and GRN patients, presymptomatic carriers (PS) and controls aged between 21 and 83. They were longitudinally evaluated over a period of >2 years, during which four PS became prodromal/symptomatic. Associations between pNfL and clinical–genetic variables, and longitudinal NfL changes, were investigated using generalised and linear mixed-effects models. Optimal cut-offs were determined using the Youden Index.
Results pNfL levels increased with age in controls, from ~5 to~18 pg/mL (p<0.0001), progressing over time (mean annualised rate of change (ARC): +3.9%/year, p<0.0001). Patients displayed higher levels and greater longitudinal progression (ARC: +26.7%, p<0.0001), with gene-specific trajectories. GRN patients had higher levels than C9orf72 (86.21 vs 39.49 pg/mL, p=0.014), and greater progression rates (ARC:+29.3% vs +24.7%; p=0.016). In C9orf72 patients, levels were associated with the phenotype (ALS: 71.76 pg/mL, FTD: 37.16, psychiatric: 15.3; p=0.003) and remarkably lower in slowly progressive patients (24.11, ARC: +2.5%; p=0.05). Mean ARC was +3.2% in PS and +7.3% in prodromal carriers. We proposed gene-specific cut-offs differentiating patients from controls by decades.
Conclusions This study highlights the importance of gene-specific and age-specific references for clinical and therapeutic trials in genetic FTD/ALS. It supports the usefulness of repeating pNfL measurements and considering ARC as a prognostic marker of disease progression.
Trial registration numbers NCT02590276 and NCT04014673.
Data availability statement
Data are available upon reasonable request. Data supporting the findings of this study are available from the corresponding author upon reasonable request.
This is an open access article distributed in accordance with the Creative Commons Attribution Non Commercial (CC BY-NC 4.0) license, which permits others to distribute, remix, adapt, build upon this work non-commercially, and license their derivative works on different terms, provided the original work is properly cited, appropriate credit is given, any changes made indicated, and the use is non-commercial. See: http://creativecommons.org/licenses/by-nc/4.0/.
Statistics from Altmetric.com
Introduction
GRN and C9orf72 gene mutations are the main genetic causes of frontotemporal dementia (FTD) and/or amyotrophic lateral sclerosis (ALS).1–4 GRN-associated phenotypes are dominated by the behavioural variant of FTD (bvFTD),5 whereas C9orf72 expansions lead to bvFTD, ALS or a combination of both.3 5 Less typical C9orf72-related phenotypes are characterised by psychiatric disorders6 or by a very slowly progressive disease in a subset of carriers.7 8
A new era is emerging in genetic FTD and ALS, with the development of GRN and C9orf72 disease-modifying therapies. The presymptomatic or prodromal phases appear to be the ideal time to deliver preventive treatments, before emergence of overt clinical manifestations. In this fast-moving context, detecting progression since disease beginning, at the biological level, up to full-blown clinical phase by means of circulating biomarkers is a major challenge. Neurofilament light chain (NfL) is highly expressed in axons. Accumulating evidence shows that elevated NfL reflects axonal damage and that levels in body fluids increase in proportion to neuronal loss in many neurodegenerative diseases.9–11 In particular, serum/plasma neurofilament light chain (pNfL) levels are elevated in FTD12–16 and ALS17–19 and appear to be efficient disease-tracking biomarkers at the clinical stage of genetic FTD/ALS. Additionally, relevant studies have demonstrated that NfL levels change in presymptomatic carriers (PS) of FTD/ALS-associated mutations, ~2–5 years before the fully symptomatic disease.14 20 21 They suggest NfL is also a valuable predictor of clinical proximity in PS, though an in-depth analysis by stratifying phenoconverters according to their genotype would be useful.
Despite a growing number of studies, some fundamental prerequisites for translating pNfL dosage from research to therapeutic trials and clinical settings are missing. In particular, further insights in the variability of NfL levels in the healthy are needed to establish appropriate references and cut-offs to be used in neurodegenerative diseases. Determining NfL values and change rates in FTD/ALS patients according to their genotypes, as well as during the preclinical stage, is also a cornerstone for clinical studies.
Hereby, we first assessed physiological variations of pNfL and their longitudinal changes in healthy controls to propose reference values during life span across age classes. Next, we determined NfL levels in two cohorts of GRN and C9orf72 carriers, separately, and delineated gene-specific trajectories from the presymptomatic to the clinical stage. Lastly, we established age-specific thresholds and annualised rates of change (ARCs) for each genetic form, in different disease stages, providing reference values to monitor clinical and therapeutic trials, and biological tools to predict disease progression.
Materials and methods
Participants
Our cohort consisted of 352 individuals whose characteristics are summarised in table 1.
Descriptive data of the studied population
We evaluated the variability of pNfL levels under physiological conditions, in 165 neurologically healthy controls recruited in research context (online supplemental appendix A1). Sixty-five underwent longitudinal pNfL assessments over a mean interval of 3.0±1.2 years (range: 1.3–6.3).
Supplemental material
We also evaluated 101 C9orf72 and 86 GRN mutation carriers. The C9orf72 cohort consisted of 54 patients and 47 presymptomatic carriers (PS). The GRN cohort included 48 patients and 38 PS. They were recruited through a French research network on FTD/ALS (Inserm RBM 02-59), and Predict to Prevent Frontotemporal Lobar Degeneration and Amyotrophic Lateral Sclerosis (PREV-DEMALS) and Natural History Characterization in Symptomatic and Asymptomatic Progranulin Gene Mutation Carriers (Predict-PGRN) national prospective studies.22–25 Individuals who had concurrent neurological conditions, other than FTD or ALS, were excluded.
In the patients’ groups, the median age at disease onset (AAO) was 58.0 years, and disease duration at baseline sampling was 3.5 years (4.9 for C9orf72 and 2.9 for GRN carriers). All GRN patients had FTD. Twenty-seven C9orf72 patients presented with bvFTD; 16 had ALS; and 11 had a C9orf72-associated atypical psychosis as described in prior studies.6 26 Patients have been followed up until death (n=37), loss to follow-up (n=58) or are still followed up (n=7) in a research context or a clinical setting. Twelve C9orf72 patients had slowly progressive course defined by disease duration of FTD of ≥14 years or ALS of ≥7 years, which corresponds to a significantly longer disease duration than commonly observed in each of the phenotypes.5 7 8 27 28 Forty-four patients underwent several plasma samplings over a mean of 2.0±1.2 years (range: 0.7–6.1).
The 85 PS (47 C9orf72 and 38 GRN) displayed no clinical symptoms and scored 0 on Clinical Dementia Rating (CDR) instrument plus National Alzheimer's Coordinating Center (NACC) frontotemporal lobar degeneration (FTLD) Behavior and Language Domains (CDR+NACC-FTLD). Sixty-six (43 C9orf72, 23 GRN) underwent longitudinal follow-up and plasma samplings in a research context over a mean of 3.0±1.7 years (range: 0.9–7.8). Four C9orf72 moved to prodromal stage during the follow-up as they developed subtle cognitive/behavioural and/or motor symptoms, and reached CDR+NACC-FTLD=0.5 (online supplemental table A1).
For a subgroup analysis in C9orf72 patients, we included five patients with primary psychiatric disorders whose demographic data were comparable to the former.
Laboratory methods
Plasma sampling
All blood samples were collected in EDTA tubes with similar standardised collection and handling procedures. They were centralised and processed using the same protocol at the DNA/cell bank Paris Brain Institute, Pitié-Salpêtrière Hospital (Biological Resource Centre, NF S96-900). Plasma was extracted at room temperature, after centrifugation at 2500 rpm during 10 min at +4°C. Aliquots were stored in polypropylene tubes at −80°C.
pNfL measurements
We analysed pNfL levels in 668 samples (352 baseline and 316 follow-up) of patients, PS and controls. Measurements were performed in the same facility, blinded to clinical–genetic status, using Single Molecule Array (SiMoA) technology in 13 runs, according to the manufacturer’s instructions (Quanterix, USA). Calibrators were run in duplicate in each experiment, and fit with a four-parameter logistic regression, with 1/y2 weighting. Samples were assessed at a 1:4 dilution in duplicate. Those with a coefficient of variation (CV) of ≥15% were reanalysed.12 NfL concentration was interpolated from standard curves. The median intra-assay CV was 3.8% (range: 0%–14.7%). Three internal control plasmas of different NfL concentrations were analysed in each run, demonstrating satisfactory run-to-run variability (mean interassay CVs: 13%, 11% and 9%).
Statistical analyses
Statistical analyses were performed using the software R V.4.0.3 (Vienna, Austria). A two-sided p value of <0.05 was considered significant. As the investigated variables were not Gaussian, we reported them as median and first and third quartiles. We compared demographic and clinical variables between the groups using Fisher’s exact test for categorical variables, and Mann-Whitney-Wilcoxon, Kruskal-Wallis and Dunn’s test for continuous variables. Corrections for multiple comparisons were handled with the Benjamini-Hochberg method. Correlation analyses were performed with Spearman’s test.
We used generalised linear models (GLMs) to investigate the association between pNfL levels, their log-transformed value, or their change rate (used as dependent variables) and genetic status, gender, phenotype, AAO, age at sampling, disease duration and baseline pNfL levels (independent variables). We used linear mixed-effects models (LMEMs) to test for significant differences in pNfL levels between time points.29 We employed the following terms as fixed effects: time point (from T0 up to T5), baseline age, gender, genetic status and interaction terms between time point and age, and between time point and genetic status. Random intercept terms for participants were included in the model. For each of the models, type II Wald χ2 tests were used. The normality of the residuals as well as heteroscedasticity were checked visually. Cook’s distances and hat values were calculated to identify influential data. R-squared (R2) was calculated to evaluate the goodness of fit in GLM, as well as conditional R2 (R2 c) in LMEM.
To perform unbiased longitudinal analyses in patients and in PS, we selected separate subgroups of controls based on demographic features and follow-up duration (online supplemental tables A2 and A3).
All groups were split to separately analyse 10-year discrete age classes, from <30 to ≥70 years. The sixth and seventh decades, in which FTD and ALS usually begin, were further stratified into 5-year classes. We used receiver operating characteristic curve and Youden Index to establish the optimal cut-offs to separate patients from controls for each decade. We selected the method maximising Youden Index across all age classes and validated it through 10 000 bootstrap runs. In each age class, we analysed outliers with respect to pNfL baseline levels or progression rate (online supplemental appendix A2).
Results
Demographic, clinical characteristics of participants and pNfL levels are shown in table 1. Variables were comparable between C9orf72 and GRN patients, except for disease duration at baseline. Overall, disease duration was rather homogeneous among GRN patients and much more heterogeneous in the C9orf72 group due to a handful of slowly progressive carriers.
pNfL levels in controls: effect of demographic factors, longitudinal changes and progression rate
At baseline, age at sampling in controls ranged between 21.1 and 83.5 years (table 1). Their pNfL levels (median: 9.88 pg/mL, IQR: 7.42–14.36) were comparable between men and women.
Median pNfL levels increased with age (r=0.766, p<0.0001) (figure 1 and table 2), ranging from 5.01 pg/mL in the youngest to 17.52 pg/mL in the oldest individuals. Therefore, we split the controls into discrete age-classes to define references for each decade. Levels significantly differed between age-classes (p<0.0001), and gradually increased up to 60 years, with steeper progression thereafter. Gender had no effect in any age-classes, and was not considered in further analyses. Two individuals had unexpectedly high values for their age-class. One had elevated levels at age 59 (59.61 pg/mL), but normal measures at 61 (10 pg/mL). In another 82-year-old participant pNfL levels were 50.97 pg/mL, without follow-up. The inclusion or exclusion of these two individuals in the subsequent analyses led to comparable results.
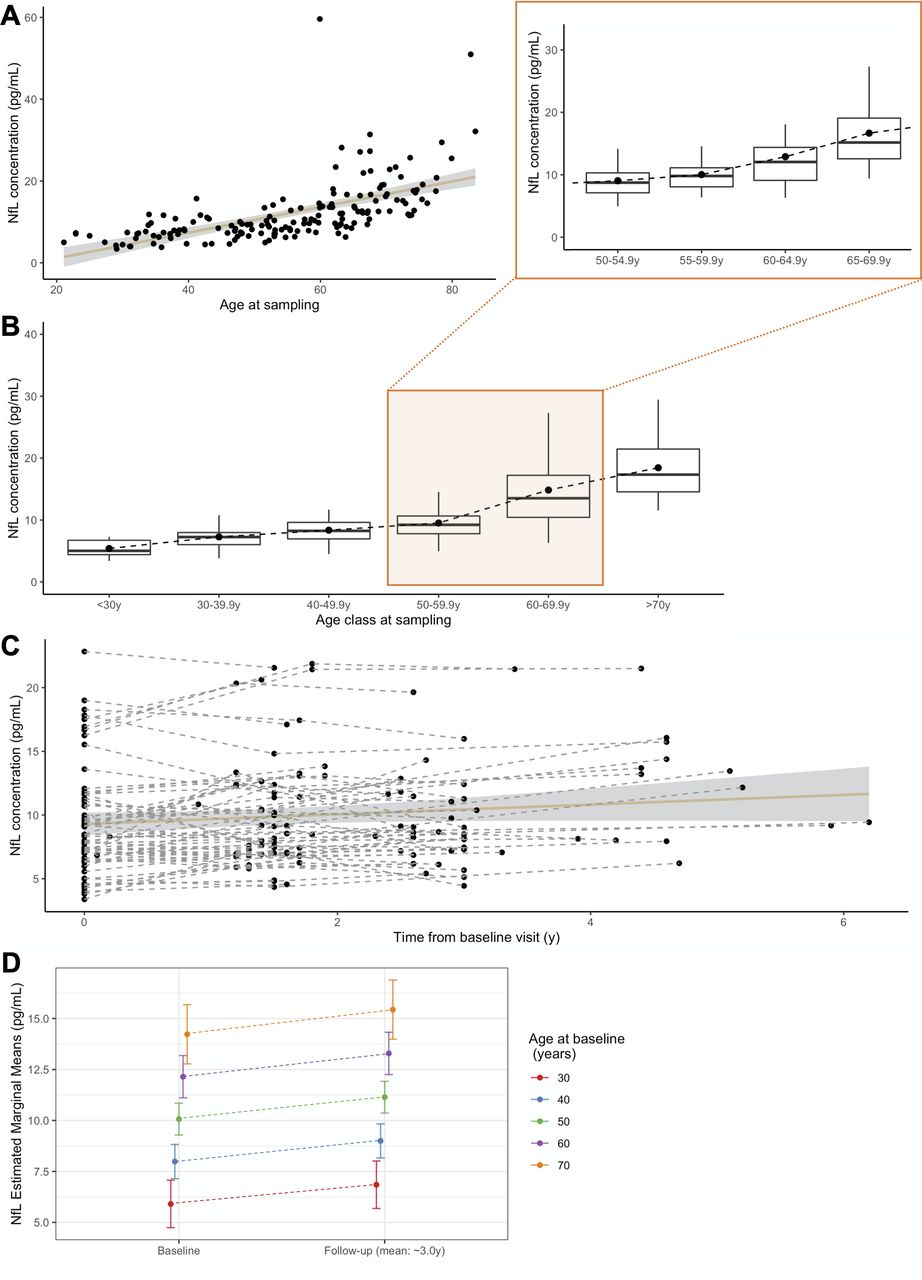
pNfL levels in controls. (A) Association of pNfL levels with the age at sampling (r=0.766, p<0.0001). (B) pNfL levels in discrete age classes, each representing a decade, with greater detail on the period in which disease usually manifests, 50.0–69.9 years, split in four classes (insert). Boxes represent median values and first and third quartiles; whiskers extend up to the lowest and highest values no further than 1.5*IQR; dots represent mean values. (C) Spaghetti plot representing pNfL variations across all the analysed time points, for controls undergoing longitudinal sampling, at the individual (dashed lines) and group (continuous line, CI 99%) levels. (D) Prediction of pNfL increase, from baseline to last follow-up, for a given age at baseline. CI: confidence interval; NfL, neurofilament light chain; pNfL, plasma neurofilament light chain.
Plasma neurofilament light chain levels in each of the age classes in controls
Next, we evaluated the rate of annual increase in 65 controls with longitudinal samplings, over a 3 year interval. Levels increased over time (p<0.0001, R2 c=0.93) regardless of the age at baseline sampling, and at a comparable rate throughout all age-classes. The mean increase per year was 0.366 pg/mL, corresponding to mean ARC of +3.9%. This rate was constant across ages (p=0.196), and only moderately associated with baseline levels (p=0.013, R2=0.10).
pNfL levels in C9orf72 and GRN patients
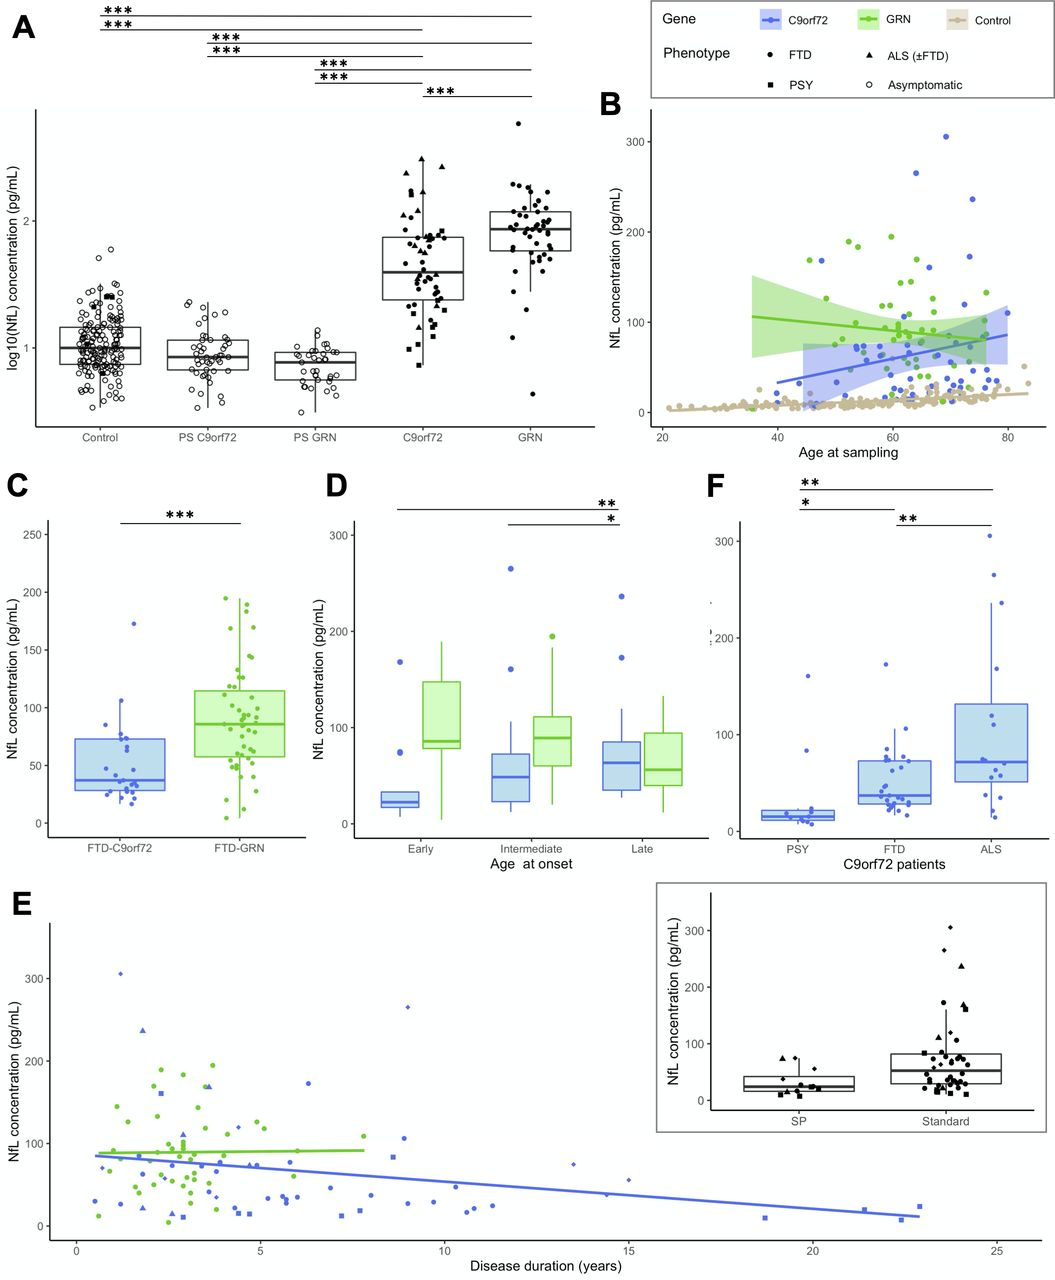
Patients displayed higher levels than controls (p<0.0001) (figure 2). Unlike controls, values did not vary with the age at sampling in the overall patients’ group (p=0.261, R2=0.07), nor with gender (p=0.274). Nevertheless, age at sampling and pNfL levels were moderately correlated in C9orf72 patients (r=0.284, p=0.037) (online supplemental figure A1).

Baseline pNfL levels in patients. (A) pNfL levels in C9orf72 and GRN patients compared with presymptomatic carriers and controls. (B) pNfL levels according to the age at sampling in C9orf72 (r=0.284, p=0.037) and in GRN (r=−0.123, p=0.406) patients, with controls displayed for comparison. (C) Comparison of pNfL levels between C9orf72 and GRN patients, restricting the analysis to those with FTD phenotype only. (D) Comparison of pNfL levels according to the age at onset, classified as early (before 50 years), intermediate (between 50 and 65 years) and late (after 65 years). Levels significantly differed in C9orf72 patients, but not in GRN patients. (E) pNfL levels according to disease duration, evidencing a negative correlation in C9orf72 patients (r=−0.311, p=0.021) but not in GRN patients (r=0.088, p=0.552). In the insert, C9orf72 carriers with atypical, SP disease course are compared with patients with standard disease duration. (F) Comparison of pNfL levels according to clinical phenotype in C9orf72 patients; patients with ALS were considered as a unique group, regardless of the presence of associated FTD. Asterisks indicate the significance of post hoc comparisons between the groups: *p<0.05, **p<0.01, ***p<0.001. ALS, amyotrophic lateral sclerosis; FTD, frontotemporal dementia; NfL, neurofilament light chain; pNfL, plasma neurofilament light chain; PSY, psychiatric presentations; SP, slowly progressive.
The genotype had a major effect on pNfL: levels were much higher, and less variable, in GRN (86.21 pg/mL) than C9orf72 patients (39.49 pg/mL, p=0.014). This finding was unbiased by disease duration, slightly shorter in GRN patients, or by clinical phenotypes. Indeed, the same effect was evidenced when analysing only GRN and C9orf72 patients with FTD (excluding ALS and other phenotypes) (86.21 vs 37.16 pg/mL, p=0.007). The two genetic groups were then described separately.
C9orf72 patients
In C9orf72 patients, a later AAO was associated with higher pNfL levels (r=0.389, p=0.004). Median values were lower in early-onset patients (≤50 years: 22.49 pg/mL) than those with AAO between 50–65 years (48.57 pg/mL) and late-onset patients (≥65: 68.00 pg/mL; p=0.002) (figure 2).
pNfL levels negatively correlated with disease duration (r=−0.311, p=0.021). Additionally, values were two-fold lower in patients with slowly progressive course (24.11 pg/mL, n=12) compared with the others (52.47 pg/mL, n=42; p=0.05). This was even more significant when comparing them with 11 patients deceased after a median disease duration of 6.0 years (77.24 pg/mL; p=0.01).
Values also varied according to the phenotype. ALS patients had higher levels (71.76 pg/mL) than those with isolated FTD (37.16 pg/mL, p=0.008). Interestingly, patients with psychiatric presentation had unexpectedly lower levels (15.3 pg/mL, IQR: 11.48–21.75) than those with FTD or ALS (p=0.003, age-corrected). Their values were not different from those of patients with primary psychiatric disorders with comparable demographic features (21.03 pg/mL, IQR: 10.75–25.09; p=0.844).
GRN patients
pNfL levels did not correlate with AAO and age at sampling in GRN patients (figure 2). There were no differences between patients with early, intermediate or late onset, and no association between pNfL values and disease duration at baseline, possibly because disease duration was much less variable in GRN than in C9orf72 patients.
Longitudinal progression and ARC in patients
Forty-four patients (29 C9orf72 and 15 GRN) underwent follow-up plasma samples over 2.0±1.2 years (table 1). pNfL levels increased over time in both genotypes (p<0.0001), but more importantly in GRN than C9orf72 patients (p=0.016, R2 c=0.85) (figure 3A,B). Notably, one GRN patient had an extreme value (~600 pg/mL) in his terminal stage, few days before his death.

Longitudinal pNfL changes in patients and controls. (A) Mean baseline and follow-up pNfL levels in 44 patients and 36 controls with comparable demographic variables undergoing longitudinal sampling (mean follow-up: 2 years). There was greater increase in C9orf72 and GRN patients compared with controls (p<0.0001), and in GRN patients compared with C9orf72 patients (p=0.016). (B) Spaghetti plot representing pNfL changes from the first to the last observation in the same participants, at the individual (dashed lines) and group (continuous lines, CI 99%) levels. (C) Individual-level and group-level trajectories of SP C9orf72 patients compared with those with standard disease course over two consecutive visits (mean follow-up: 1.2 years), showing a lesser increase in the former (p=0.05). CI: confidence interval; NfL, neurofilament light chain; pNfL, plasma neurofilament light chain; SP, slowly progressive; y, years.
The mean yearly increase of 13.62 pg/mL in patients, corresponding to an ARC of +26.7%, was much higher than that in controls (+4%, p<0.0001). This rate was slightly higher in GRN (+29.3%) than in C9orf72 carriers (+24.7%). Among C9orf72 patients, the ARC differed according to the phenotypes, with a mean value of +37% in ALS,+21.7% in FTD and +8.3% in psychiatric presentations.
Importantly, pNfL progression over time was slower in C9orf72 patients with slowly progressive disease (p=0.05, R2 c=0.95) (figure 3C). Their ARC was only +2.5%, i.e. in the range of controls and markedly lower than that in C9orf72 patients with a standard course (p=0.05).
Genotype-specific and age-specific cut-offs
We determined cut-off values discriminating patients from controls (table 3 and online supplemental figure A2). Given the distinct gene-specific trajectories, we separately determined thresholds for C9orf72 and for GRN patients. A cut-off at 19.00 pg/mL yielded the best sensitivity/specificity trade-off to separate C9orf72 patients from controls (83% and 88%, respectively). A higher threshold of 27.48 pg/mL differentiated GRN patients from controls, with 94% sensitivity and 97% specificity.
Optimal cut-off values separating patients from controls
As age has a major impact on pNfL levels in controls and, to a lesser degree, in C9orf72 carriers, we stratified the two genetic cohorts in distinct age classes. Cut-offs by decades are provided in table 3. They ranged from 9.74 pg/mL for C9orf72 patients of <50 years to 27.71 for those ≥70 years, and from 15.70 pg/mL to 26.47 pg/mL for GRN patients of the same age classes. As expected, all cut-offs yielded better performances for GRN patients.
These cut-offs could be thereby employed in the analysis of pNfL in PS, suprathreshold values likely predicting proximity to disease onset.
pNfL levels in PS: two genes, two trajectories
The 85 PS included 48 C9orf72 and 37 GRN carriers. Their median age at sampling (41.2 years) was similar in both genotypes (table 1). Their pNfL values were comparable to controls and remarkably lower than those of patients (p<0.0001) (figure 2A). C9orf72 had higher pNfL levels (8.48 pg/mL) than GRN carriers (7.69 pg/mL, p=0.004). Levels in PS significantly increased with age at sampling (p<0.0001), as in controls. The correlation was much stronger in C9orf72 (r=0.651, p<0.0001) than in GRN (r=0.359, p=0.029) (figure 4). To sum up, pNfLs were slightly higher and showed a more age-related trend during the presymptomatic phase of C9orf72 disease.

Baseline pNfL levels and longitudinal changes in presymptomatic carriers. (A) pNfL levels at baseline according to the age at sampling in C9orf72 (r=0.651, p<0.0001) and in GRN carriers (r=0.359, p=0.029). (B) Spaghetti plot representing pNfL changes from the first to the last observations in 66 carriers and 58 controls with comparable demographic variables undergoing longitudinal sampling (mean follow-up: 3 years). (C) Longitudinal trajectories of pNfL levels in C9orf72 and GRN carriers and controls (continuous lines, CI 99%), which were comparable at group level (p=0.172). Eight individuals (five C9orf72 and three GRN carriers: dots and dashed lines) qualified as outliers, having remarkable baseline values and/or increases over time. Four of them were prodromal C9orf72 carriers (see online supplemental table A1). CI : confidence interval; NfL, neurofilament light chain; pNfL, plasma neurofilament light chain; y, years.
Follow-up plasma samples over a mean interval of 3.0±1.3 years were available for 43 C9orf72 and 23 GRN PS (table 1). Levels slightly increased over time, with a mean ARC of +3.2% (+3.2% in C9orf72 and +3.3% in GRN), similarly to controls (p=0.703).
High pNfL values in PS: prodromal stage or outliers?
Four C9orf72 carriers, described in online supplemental table A1, moved to prodromal stage during their follow-up, one of whom developed ALS 6 years after baseline. All had elevated baseline and/or follow-up pNfL levels with respect to their age (as detailed in online supplemental appendix A2 and figure 4), and three had remarkable longitudinal trajectories, with higher ARC (mean: +7.3%, up +15% in one case) than in non-converting carriers (mean: +3.2%).
Notably, four other mutation carriers had elevated pNfL levels or ARC but did not develop any prodromal signs, at least during the time of their follow-up. One of them was a 44-year-old individual carrying the C9orf72 expansion. He displayed higher pNfL levels than expected in his age class (17.17 pg/mL). The other three were GRN PS who had normal pNfL values at baseline but high ARC, from +19% to +62% during follow-up, though not reaching suprathreshold values for their age classes. So far, none displayed clinical changes at their last follow-up.
Discussion
pNfLs hold promise to serve as efficient disease-tracking biomarkers in genetic forms of FTD and ALS.12 14 20 30 However, more insights about the dynamics of pNfL in the healthy and a thorough understanding of the differential progression in genetic FTD/ALS are needed to implement pNfL dosage in clinical care and research practice, and to define appropriate endpoints in the forthcoming gene-tailored therapeutic trials.9 11 16 19 These critical points are addressed in this study, which analyses pNfL in one of the largest cohorts of FTD/ALS mutation carriers, followed over 2–3 years, thereby allowing definition of gene-specific changes and longitudinal trajectories for C9orf72 and for GRN carriers, separately.
First, we provided detailed cross-sectional and longitudinal characterisation of age-related changes in controls, where NfL release is mainly due to physiological axonal turnover.11 This is a fundamental prerequisite to appropriately interpret values in pathological conditions. Prior studies have addressed the impact of age on NfL, but most focused on elderly populations, during normal or pathological ageing.9 14 31–33 Here, we traced pNfL dynamics across the life span with a broad representation of age classes, from <30 to >70 years, providing greater information on early and mid-adulthood. pNfL levels progressively increase with age, from ~5 pg/mL in the youngest to ~18 pg/mL in the eldest individuals. This progression is quasi-linear up to 60 years and is followed by a steeper age-related trend in older subjects. Importantly, pNfL markedly increase throughout the sixth and seventh decades, the life period in which FTD and ALS usually manifest. This is possibly due to less efficient protein turnover or a progressive ageing-related axonal loss. Alternatively, clinically silent neurological disorders may affect a subset of the oldest controls, in whom clinical proximity to other unrelated neurodegenerative conditions cannot be excluded. A similar low-amplitude progression was evidenced in another study focused on normal ageing,33 supporting the robustness of our findings. These studies indicate that NfL levels must be cautiously interpreted in neurological diseases, relatively to reference values in age-matched controls. Thereby, we established thresholds by decades, taking into account the physiological pNfL increases throughout the life span. It has to be kept in mind, however, that these thresholds may change on different analytical conditions, thus encouraging joint efforts between centres to standardise dosing techniques and harmonise the interpretation of results.34
Additionally, we determined reference values in controls for all age classes (table 2) and a mean expected ARC of about +4%, from longitudinal observations over a 3-year time course. This rate, concordant with other works,11 32 33 35 may serve as a landmark for clinical studies.
Overall, patients presented higher pNfL levels than controls and greater progression over time with an ARC of ~27%. In our study, an in-depth analysis depicts two distinct pNfL trajectories according to the genotype. GRN disease was associated with extremely high levels and progression rates, overshadowing the effect of ageing. The higher baseline levels in GRN compared with C9orf72 patients, and the ARC of ~30%, could reflect the impressive neuroaxonal degeneration and frequent white matter changes in GRN disease.5 36 37 Lower levels in C9orf72 patients may also be partly due to the clinical heterogeneity within this group, some patients presenting a less aggressive, slowly progressive course.
In C9orf72 patients, pNfL levels were tightly associated with the aggressiveness of the phenotype. ALS and psychiatric presentations showed the highest and lowest values, respectively. This is concordant with prior studies in patients with ALS, displaying higher levels compared with other neurodegenerative conditions, possibly due to the large-calibre axonal degeneration characterising ALS.17 18 30 38 On the other hand, the patients with psychiatric presentations usually have long-standing disease course, without patent markers of neurodegeneration.26 Accordingly, their pNfL levels were significantly lower than those of patients with FTD and ALS in our study and more similar to those of patients with primary psychiatric disorders. Prior findings highlighted the potential of NfL to differentiate bvFTD from psychiatric disorders.39 40 Our results go somehow further, indicating that NfL might not allow to distinguish atypical C9orf72-associated psychosis from patients with primary psychiatric disorders.
More importantly, this study suggests the ARC could be used to predict disease progression in C9orf72 patients. It was impressively low in patients with slowly progressive phenotypes, displaying no detectable increases at 1 year, beyond what can be attributed to ageing. This strikingly contrasted with the annual ~25% increase in patients with typical disease course. These observations highlight the importance to repeat pNfL measurements, and the usefulness of the ARC in clinical and research settings as a prognostic index of progression in C9orf72 patients, lower ARC predicting a longer, less aggressive course.
The differences we observed in the two genetic cohorts point out the importance of analysing each genotype independently also in presymptomatic/prodromal carriers.20 A recent important study demonstrated the value of baseline NfL to predict phenoconversion.21 However, the cut-offs determined in two independent mixed genetic cohorts analysed in the latter study were not unequivocal, possibly because of demographic and/or genetic heterogeneity. Furthermore, the importance of repeated dosages during the presymptomatic stage has been already emphasised in genetic forms of Alzheimer disease.29 We suggest the same attention should be paid to PS FTD/ALS mutation carriers, where a shift to higher ARC during follow-up dosages may unveil the emergence of pathological processes. In the overall PS group, the ARC was +3.2%, similar to controls, without differences between genotypes. Four C9orf72 carriers, whose ARC was up to +15%, moved to the prodromal/symptomatic stage during follow-up, emphasising the major interest of repeated pNfL dosages for the prediction of phenoconversion. Notably, pNfL increased 3 years before clinical onset in one of them who developed ALS, in a similar timeframe than previously described converters.14 20 21
More interestingly, four other PS (one C9orf72 and three GRN) with high baseline pNfL and/or high ARC displayed no clinical symptoms during follow-up. Similar proportions of ‘non-converting’ PS with high NfL levels have been reported by others.14 21 These individuals might be in an earlier preclinical stage than the former PS, before the emergence of prodromal symptoms, thus underlining the usefulness of long preclinical follow-ups. Accordingly, NfL levels increase early in the cascade of disease biomarkers in GRN PS, ~2 to 5 years before the mild behavioural/cognitive impairment stage.14 41 The integration of information stemming from pNfL dosage with that provided by biochemical, neuroimaging, cognitive biomarkers could refine our understanding of the disease trajectory and provide insights into the mechanisms associated with clinical conversion.
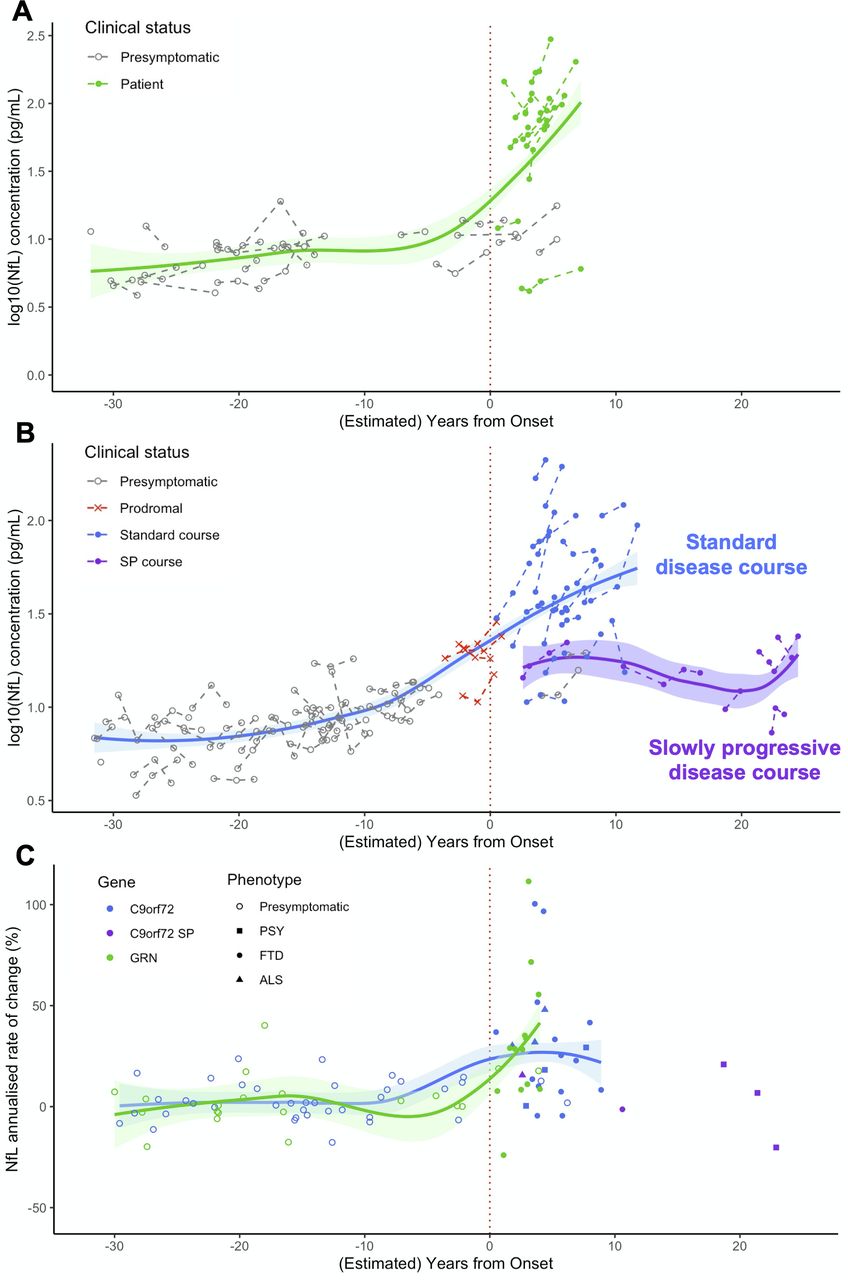
The overall pNfL trajectories during the entire disease course strikingly differed between the two genetic cohorts (figure 5). GRN carriers had low levels on average during the presymptomatic phase and displayed major and sustained increases after clinical onset. C9orf72 carriers displayed higher pNfL values in the presymptomatic, and lower in the clinical phase, compared with the former. An association with age was evidenced throughout all C9orf72- disease, supporting a less abrupt transition between the preclinical and clinical phases. This suggests that disease course may extend throughout adulthood in C9orf72 carriers and that progression biomarkers smoothly change during a long presymptomatic phase, in line with previous neuroimaging studies.24 42–44 Lastly, pNfL levels and change rates were rather heterogeneous in the clinical phase of C9orf72 disease and were strongly influenced by the disease phenotype and progression pace. Notably, sustained increases were observed soon after disease onset in the large majority of patients and a few years before onset in prodromal carriers. On the other hand, patients with slow progression showed significantly lower levels even at several years from onset.

Modelisation of pNfL trajectories and progression rates over the entire disease course, from presymptomatic phase to clinical phase, in GRN and C9orf72 carriers. (A,B) pNfL levels at baseline and at follow-up visits in presymptomatic and symptomatic carriers of GRN (A) and C9orf72 (B) mutations, at individual and group levels, according to their clinical status and their (estimated) distance to/from disease onset. (C) pNfL annualised rates of change (%) in presymptomatic and symptomatic GRN and C9orf72 carriers according to their (estimated) distance to/from disease onset. Patients are classified according to their phenotype. Among C9orf72 patients, those with SP disease course are presented in a different colour. On the x axis, the disease duration from onset is given for patients, and the estimated years to clinical onset is given for presymptomatic carriers. Estimated years to onset were calculated for each individual, taking into account the mean age of disease onset in his/her family. For prodromal C9orf72 carriers, the age at their first subtle cognitive/behavioural and/or motor symptoms was considered. ALS, amyotrophic lateral sclerosis; FTD, frontotemporal dementia; NfL, neurofilament light chain; pNfL, plasma neurofilament light chain; PSY, psychiatric presentations; SP, slowly progressive.
This study has some limitations. Quantitative measures of disease severity and neuroimaging data were not included, as standardised data was available only for a part of participants. However, other studies have already well demonstrated the association of NfL levels with cognitive decline and cerebral atrophy.14 16 21 For C9orf72 carriers, the proposed cut-offs could be further refined according to phenotype and/or progression rate. Moreover, this study specifically focused on genetic FTD/ALS and the proposed thresholds should be used to predict clinical evolution in presymptomatic carriers only when the mutation status is known. They are not intended to be used in sporadic forms, or when other diseases are in the differential diagnosis. In the modelisation of pNfL trajectories, the estimation of the years to disease onset in presymptomatic carriers was performed taking into account the mean age at onset in their families, which is known to show an imperfect correlation with the individual’s actual age at onset.5 Lastly, our findings should be replicated in other control populations, as well as in independent genetic cohorts, before employing references and thresholds in clinical practice. A standardised system for pNfL measurement would be highly recommended to reduce the variability across centres and harmonise the interpretation of the results.
Our study provides valuable information on pNfL dynamics under physiological conditions, and in C9orf72 and GRN diseases, improving their interpretability as biomarkers in future studies and as potential prognostic indexes in clinical practice. In particular, the impact of age in the healthy and the specific pNfL trajectories in the two different genetic cohorts led us to propose age-specific and gene-specific thresholds and change rates. They allow partial filling of the gaps of knowledge currently existing in pNfL dynamics and may prove their usefulness to spot unusual values in at-risk subjects.
Data availability statement
Data are available upon reasonable request. Data supporting the findings of this study are available from the corresponding author upon reasonable request.
Ethics statements
Patient consent for publication
Ethics approval
These clinical–genetic studies were approved by the Paris-Necker Hospital/AP-HP Ile-de-France VI ethics committees (CPP 68–15, ID RCB 2015-A00856-43). All participants or legal representatives gave informed consent.
Acknowledgments
We are grateful to the DNA and cell bank of the Institut du Cerveau (ICM) for the technical assistance (DNA and cell bank, ICM, Pitié-Salpêtrière hospital, Paris, France) and to Dr Foudil Lamari and Benoit Rucheton (DMU Biogem-Metabolic Biochemistry Department, Neurometabolic and Neurodegenerative Unit, APHP Sorbonne, Pitié-Salpêtrière hospital, Paris, France). The study was partially conducted with the support of the Centre d’Investigation Clinique Neuroscience (CIC 1422), Pitié-Salpêtrière Hospital, Paris.
References
Supplementary materials
Supplementary Data
This web only file has been produced by the BMJ Publishing Group from an electronic file supplied by the author(s) and has not been edited for content.
Footnotes
Collaborators The French Research Network on FTD/FTD-ALS: Sophie Auriacombe (CHU Pellegrin, Bordeaux), Serge Belliard (CHU Rennes), Frédéric Blanc (Hôpitaux Civils, Strasbourg), Claire Boutoleau-Bretonnière (CHU Laennec, Nantes), Alexis Brice (Hôpital Pitié-Salpêtrière, Paris), Mathieu Ceccaldi (CHU La Timone, Marseille), Philippe Couratier (CHU Limoges), Mira Didic (CHU La Timone, Marseille), Bruno Dubois (Hôpital Pitié-Salpêtrière, Paris), Charles Duyckaerts (Hôpital Pitié-Salpêtrière, Paris), Frédérique Etcharry-Bouyx (CHU Angers), Maïté Formaglio (CHU Lyon), Véronique Golfier (CHU Rennes), Didier Hannequin (CHU Charles Nicolle, Rouen), Lucette Lacomblez (Hôpital Pitié-Salpêtrière, Paris), Isabelle Le Ber (Hôpital Pitié-Salpêtrière, Paris), Bernard-François Michel (CH Sainte-Marguerite, Marseille), Jérémie Pariente (CHU Rangueil, Toulouse), Florence Pasquier (CHU Lille), Daisy Rinaldi (CHU Pitié-Salpêtrière, Paris), Mathilde Sauvée (CHU Grenoble Alpes), François Sellal (CH Colmar), Christel Thauvin-Robinet (CHU Dijon), Catherine Thomas-Anterion (CH Plein-Ciel, Lyon), and Martine Vercelletto (CHU Laennec, Nantes). PREV-DEMALS & Predict-PGRN study groups: Elisabeth Auffray-Calvier (CHU Nantes), Eric Bardinet (ICM, Paris), Eve Benchetrit (Hôpital Pitié-Salpêtrière, Paris), Isabelle Berry (CHU Toulouse), Hugo Bertin (Hôpital Pitié-Salpêtrière, Paris), Anne Bertrand (Hôpital Pitié-Salpêtrière, Paris), Anne Bissery (Hôpital Pitié-Salpêtrière, Paris), Stéphanie Bombois (CHU Roger Salengro, Lille), Marie-Paule Boncoeur (CHU Limoges), Alexis Brice (ICM, Paris), Claire Boutoleau-Bretonnière (CHU Laennec, Nantes), Agnès Camuzat (ICM, Paris), Valérie Causse-Lemercier (Hôpital Pitié-Salpêtrière, Paris), Mathieu Chastan (CHU Charles Nicolle, Rouen), Yaohua Chen (CHU Roger Salengro, Lille), Marie Chupin (ICM, Paris), Olivier Colliot (ICM, Paris), Philippe Couratier (CHU Limoges), Xavier Delbeuck (CHU Roger Salengro, Lille), Christine Delmaire (CHU Roger Salengro, Lille), Vincent Deramecourt (CHU Roger Salengro, Lille), Mira Didic (CHU La Timone, Marseille), Aurélie Funkiewiez (Hôpital Pitié-Salpêtrière, Paris), Emmanuel Gerardin (CHU Charles Nicolle, Rouen), Nadine Girard (CHU La Timone, Marseille), Eric Guedj (CHU Marseille), Marie-Odile Habert (Hôpital Pitié-Salpêtrière, Paris), Didier Hannequin (CHU Charles Nicolle, Rouen), Aurélie Kas (Hôpital Pitié-Salpêtrière, Paris), Gregory Kuchinski (CHU Lille), Géraldine Lautrette (CHU Limoges), Isabelle Le Ber (Hôpital Pitié-Salpêtrière, Paris), Benjamin Le Toullec (ICM, Paris), Marie-Anne Mackowiak (CHU Roger Salengro, Lille), Olivier Martinaud (CHU Charles Nicolle, Rouen), Merry Masmanian (Hôpital Pitié-Salpêtrière, Paris), Jacques Monteil (CHU Limoges), Assi-Hervé Oya (Hôpital Pitié-Salpêtrière, Paris), Amandine Pallardy (CHU Nantes), Jérémie Pariente (CHU Rangueil, Toulouse), Florence Pasquier (CHU Roger Salengro, Lille), Grégory Petyt (CHU Roger Salengro, Lille), Pierre Payoux (CHU Toulouse), Daisy Rinaldi (Hôpital Pitié-Salpêtrière, Paris), Adeline Rollin-Sillaire (CHU Roger Salengro, Lille), Sabrina Sayah (Hôpital Pitié-Salpêtrière, Paris), and David Wallon (CHU Charles Nicolle Rouen).
Contributors Full access to all the data in the study and responsibility for the integrity of the data and the accuracy of the data analysis: DS. Study concepts and study design, literature research: DS and ILB. Laboratory analysis: DS and KD. Statistical analysis: DS and MH. Obtainment of funding and study supervision: ILB. Administrative, technical or material support: SF and ILB. Acquisition, analysis or interpretation of data; manuscript drafting or manuscript revision for important intellectual content; approval of final version of submitted manuscript: all authors.
Funding The research leading to these results received funding from the 'Investissements d’avenir' ANR-11-INBS-0011. This work was partially funded by the Programme Hospitalier de Recherche Clinique (PHRC) Predict-PGRN (to ILB, promotion by Assistance Publique–Hôpitaux de Paris), the PHRC FTLD-exome (to ILB, promotion by Assistance Publique–Hôpitaux de Paris), by the ANR-PRTS PREV-DEMALS project (to ILB, grant number ANR-14-CE15-0016-07, promotion by Assistance Publique–Hôpitaux de Paris) and the Fondation Vaincre Alzheimer (to ILB, grant number FR-17035).
Disclaimer The sponsors had no role in study design, data analysis or interpretation, writing or decision to submit the report for publication.
Competing interests Disclosure of interests unrelated to the present article: ILB served as a member of advisory board for Prevail Therapeutics and of the steering committee for Alector, and received research grants from ANR, DGOS, PHRC, ARSla Association, Fondation Plan Alzheimer outside of the present work.
Provenance and peer review Not commissioned; externally peer reviewed.
Supplemental material This content has been supplied by the author(s). It has not been vetted by BMJ Publishing Group Limited (BMJ) and may not have been peer-reviewed. Any opinions or recommendations discussed are solely those of the author(s) and are not endorsed by BMJ. BMJ disclaims all liability and responsibility arising from any reliance placed on the content. Where the content includes any translated material, BMJ does not warrant the accuracy and reliability of the translations (including but not limited to local regulations, clinical guidelines, terminology, drug names and drug dosages), and is not responsible for any error and/or omissions arising from translation and adaptation or otherwise.