
Differential Mass Spectrometry Profiles of Tau Protein in the Cerebrospinal Fluid of Patients with Alzheimer’s Disease, Progressive Supranuclear Palsy, and Dementia with Lewy Bodies
Abstract
Microtubule-associated Tau proteins are major actors in neurological disorders, the so-called tauopathies. In some of them, and specifically in Alzheimer’s disease (AD), hyperphosphorylated forms of Tau aggregate into neurofibrillary tangles. Following and understanding the complexity of Tau’s molecular profile with its multiple isoforms and post-translational modifications represent an important issue, and a major analytical challenge. Immunodetection methods are, in fact, limited by the number, specificity, sensitivity, and capturing property of the available antibodies. Mass spectrometry (MS) has recently allowed protein quantification in complex biological fluids using isotope-labeled recombinant standard for absolute quantification (PSAQ). To study Tau proteins, which are found at very low concentrations within the cerebrospinal fluid (CSF), we relied on an innovative two-step pre-fractionation strategy, which was not dependent on immuno-enrichment. We then developed a sensitive multiplex peptide detection capability using targeted high-resolution MS to quantify Tau-specific peptides covering its entire sequence. This approach was used on a clinical cohort of patients with AD, progressive supranuclear palsy (PSP), and dementia with Lewy body (DLB) and with control non-neurodegenerative disorders. We uncovered a common CSF Tau molecular profile characterized by a predominance of central core expression and 1N/3R isoform detection. While PSP and DLB tau profiles showed minimal changes, AD was characterized by a unique pattern with specific modifications of peptide distribution. Taken together these results provide important information on Tau biology for future therapeutic interventions, and improved molecular diagnosis of tauopathies.
INTRODUCTION
Microtubule-associated tau proteins are main pathophysiological actors of Alzheimer’s disease (AD). They form intraneuronal fibrillar aggregates called neurofibrillary tangles within the brain of affected patients. These aggregates constituted of hyper- and abnormally phosphorylated Tau can also be found in other pathologies or “tauopathies” [1], like progressive supranuclear palsy (PSP) or some types of frontotemporal lobar degeneration. Tau proteins are coded by the microtubule-associated protein Tau (MAPT) gene. This 140 kb gene has 16 exons and generates via alternate splicing (especially exons 2, 3, and 10) six major different human brain isoforms of the protein [2]. Exons 2 and 3 encode sequences, located at the N-terminus, play modulatory role in the interaction of Tau with membranes and tyrosine kinases; while exon 10 encodes the fourth microtubule-binding domain (4R). These sequence variations modulate Tau function which is mostly related to tubulin polymerization and stabilization, an essential mechanism for efficient intracellular transport and axonal growth. The regulation of Tau function is ensured by its phosphorylation over about 85 putative sites scattered within the entire protein [1, 2]. The hyperphosphorylation of Tau protein reduces its affinity for microtubules, which can lead to disruptions of the cytoskeleton and aggregation associated with the formation of neurofibrillary tangles. In AD, the changes in cerebrospinal fluid (CSF) Aβ1 - 42 are detected before the changes in Tau [3], but the evolution of Tau gives a better index to the progression of patients’ mental impairments, and this has now become a major line of study for developing new therapeutic approaches [4]. The changes in Tau and its phosphorylated isoform (p-Tau), which occur in early AD after the changes in Aβ1 - 42 [3], are highly correlated except in a few cases such as Creutzfeldt-Jakob disease [5]. In addition, Tau and p-Tau are useful biomarkers that can be detected in the CSF of patients [3, 6–8]. Tau and p-Tau CSF levels increase in AD and along with the measure of amyloid peptides they contribute to the positive diagnosis of AD, and its detection in early stages of the disease [9]. CSF Tau can also increase in other tauopathies [10], as well when neuronal lysis occurs like in Creutzfeldt-Jakob disease [5] or in stroke [11].
Studying the molecular profile of Tau is important for understanding the pathological mechanisms of tauopathies, improving the molecular diagnosis of these diseases, and developing new therapeutic strategies. This is, however, very challenging since this protein is probably one of the most complex protein targets with its six isoforms (ranging from 352 to 441 amino acids), many truncated forms, and forms with extensive post-translational modification (PTM) such as methylation, glycosylation, ubiquitinylation, and phosphorylation. These distinct Tau isoforms/proteoforms are differentially detected in the brain parenchyma of patients and eventually in CSF. Prior studies based on western blotting and ELISA suggested the presence of several Tau fragments and many phosphorylated forms [1, 12, 13] in this biological fluid. However, the low resolution of these techniques and lack of specific antibodies for its many possible isoforms has so far prevented obtaining a global view on Tau molecular profile in the CSF.
One major analytical tool to explore protein diversity is represented by mass spectrometry (MS), which already ensures confident quantification of xenobiotics, metabolites, lipids, or peptides in biofluids. In recent years, the emergence of targeted proteomic approaches by MS has allowed protein quantification in complex biological fluids [14]. In this work, we used a MS based method for the absolute quantification of protein called Protein Standard for Absolute Quantification (PSAQ) standards [15, 16]. We relied on the sensitive multiplex peptide detection capability of targeted high-resolution MS (HRMS) on a Q-Orbitrap to follow in parallel 18 peptides covering Tau N-terminus, central core and C-terminus. This approach was then used on a clinical cohort allowing us to investigate CSF Tau molecular profile in several neurodegenerative disease, including AD, PSP, and dementia with Lewy body (DLB).
METHODS
Subjects
All cognitive patients underwent a standardized clinical investigation including anamnestic, clinical, neuropsychological, screening laboratory tests, brain morphological (computed tomography (CT) scans and/or magnetic-resonance imaging (MRI)) or functional (single photon emission tomography 99mTc-ECD-SPECT scans) imaging evaluations. The standardized neuropsychometric battery included the Mini-Mental Status Examination (MMSE), the MATTIS dementia rating scale (MDRS), the Frontal Assessment Battery (FAB) [17], and the Free and Cued Recall Test (FRCT). All clinical diagnoses were validated independently by three dementia experts. Patients were classified into four groups: AD (n = 11, as defined by the NINCDS-ADRDA criteria [18]), PSP (n = 5, as defined by the NINDS-SPSP criteria [19]), DLB (n = 4, as defined in McKeith et al. [20]), and other control non neurodegenerative diseases (CTRL) (n = 12). The non-AD group included patients with subjective cognitive impairment, normal pressure hydrocephalus and vascular dementia. CSF Aβ1 - 42, Tau, and p-Tau concentrations were measured using standardized commercially available INNOTEST® sandwich ELISA according to the manufacturer’s instructions (Fujirebio Europe NV, formerly Innogenetics NV). The commercial Fujirebio Tau assay measures the total Tau concentration, including the six isoforms (352 to 441 amino acids). The capture antibody targeted the PPTERPK epitope (AT120), whereas the two detecting antibodies targeted DRSGYS epitope (BT2) and PPGQK epitope (HT7). Participants gave written consent for their participation to the study, which was approved by the ethical committee CPP Sud Méditerranée IV under the number 2011-003926-028.
CSF samples collection and storage
CSF samples were collected in polypropylene tubes using lumbar puncture methods (Starstedt; 10 mL, ref 62.610.201) in line with standard operating procedures [23], transferred at a temperature of 4°C within less than 4 h to the laboratory and centrifuged at 1000 g at 4°C for 10 min. 0.5-mL aliquots of CSF supernatant were subsequently collected in 1.5-mL Eppendorf microtubes (Eppendorf Protein LoBind, ref 0030 108.116) and stored at –80°C before being analyzed. These samples were used/tested without performing an additional freeze-thaw cycle. The methods used for the handling/traceability of the samples were in keeping with the procedures recommended in the biobank quality standard NFS 96–900, for which the laboratory is certified. No specific quality control procedures were performed as in Greco et al. [24], but one aliquot of the samples was tested using ELISA assay to measure the AD biomarkers, and the fact that consistent results were obtained between Aβ1 - 42, Tau, and p-Tau suggest that no major preanalytical problems were involved.
Protein standards used for MS quantification
14N unlabeled recombinant 2N/4R (Tau-441), 0N/3R (Tau-352), and 1N/3R (Tau-381) Tau were purchased from Sigma-Aldrich (Saint Quentin Fallavier, France). 15N labeled recombinant Tau-441 protein [21] was a gift of Guy Lippens (UMR 8525, Lille Pasteur Institute, France). Isotopic incorporation of 15N in recombinant protein was estimated at ∼99% based on the isotopic profiles of tryptic peptides observed by LC-ESI-HRMS.
Tau purification and tryptic digestion
Extraction of Tau peptide samples was performed as previously described by Bros et al. [22]. Preparation methods used 450 μL of human CSF or 0.5% serum samples (for standard curves achievement) spiked with 15N-Tau-441 immediately after thawing. Twenty-five microliters of 70% perchloric acid (Fluka analytical, Sigma Aldrich) were added for protein precipitation and samples were kept on ice for 15 min before centrifugation (15 min, 4°C and 16000 g). Supernatants were collected and mixed with 50 μL of 1% trifluoroacetic acid (TFA). Tau extraction was performed using 96-well Oasis HLB μElution plate and extracts were digested for 24 h at 37°C with 40 μL of 1 ng/ μL trypsin solution (Sequencing Grade Modified Trypsin, Promega, Madison, WI) in 50 mM ammonium bicarbonate. Finally, the digested result was acidified with 5 μL of 10% acid formic and stored at –20°C prior to μLC-MS/HRMS analysis.
LC-MS/MS analysis
μLC-HRMS was performed on an Ultimate 3000 chromatography system coupled to a Q-Exactive Quadrupole-Orbitrap mass spectrometer (Thermo Fisher Scientific, Bremen, Germany). MS parameters were thoroughly optimized to yield the best detection sensitivity and multiplexing capacity. High-fill times, and simultaneous 14N/15N isotopologue ion isolation, fragmentation, and analysis significantly improved detection sensitivity [23, 24]). Despite the large isolation window, i.e., 10 m/z, used for the concomitant isolation of 14N/15N isotopologues, high-resolution/accurate mass detection of targeted fragment ions (PRM) allowed a very high detection specificity devoid of any interference compared with approaches using HRMS only (single ion monitoring, SIM) approaches. PRM spectra of Tau peptides were analyzed using Pinpoint software (Thermo Scientific). A specific processing method was created (QuanBrowser, Thermo Excalibur 2.2, Thermo Fischer Scientific) to extract a composite signal constituted by the sum of selected PRM transitions (3 ppm of isolation range) for each light and heavy peptides monitored. Additional information on the MS approach is provided in the Supplementary Material.
Statistical analysis
Statistical analyses were performed with the MedCalc software program (15.2.2). Parametric and non-parametric tests depending on the normal distribution of the data were used. Parametric Student’s t-tests (Fig. 4) and non-parametric Mann-Whitney tests (Supplementary Table 3) were used to check the significance of the differences between two independent samples. Non-parametric Spearman’s rho rank correlation coefficients (Figs. 1 and 3) were used to test the correlations between two series of values. The ANOVA test (Supplementary Table 2) was used to test the differences between the data obtained on the various diagnostic groups.
RESULTS
Clinical population
Demographics and biomarker values for the four clinical groups: AD, PSP, DLB, and CTRL, are presented in the Supplementary Table 2. Age and MMSE (cognitive patients) were comparable between groups while Aβ1 - 42 was lower in the AD group. As expected, differences in ELISA Tau and Tau phosphorylated at position 181 (p-Tau(181)) biomarker concentrations between AD patients and other clinical groups were significant. These results indicated that Tau and p-Tau(181) in this population in the advanced stages of the disease recruited from memory clinic were the best AD-specific biomarkers [25].
Selection of peptides from recombinant Tau proteins
The identification of specific (proteotypic) Tau peptides, and their absolute quantification, was achieved using recombinant protein [15]. In this work, we used the longer Tau (Tau-441) recombinant proteins in its unlabeled and 15N-labeled full-length forms. Studies on recombinant Tau enabled us to optimize the digestion, chemical modification, and targeted HRMS detection steps. It has to be noted that all methionines were oxidized to methionine sulfone residues in order to render the corresponding peptides readily amenable to absolute quantification [15]. Tryptic digestion of Tau-441 generated a series of peptides (Supplementary Table 1), 18 of which were detectable in pools of CSF used for developing the method (Fig. 1A and Table 1). Interestingly five of these 18 peptides were isoform-specific. A scheduled parallel reaction monitoring (PRM) acquisition with a Q-Orbitrap mass spectrometer was then designed for the multiplexed and high-sensitivity targeted analysis of these peptides along with their 15N isotopologues (Fig. 1B). Each peptide was followed by the extracted ions currents from the PRM spectra of its fragments (Fig. 1C).
CSF Tau global molecular profile
The use of our optimized MS workflow on CSF samples generated quantitative data for 18 Tau peptides (Supplementary Table 3). The quantitation of each peptide was ensured using as internal standard, spiked fixed concentration of 15N Tau-441. The 14N/15N ratio was then reported on the calibration curve realized in triplicate using different concentration of 14N-Tau 441 in model matrix (Fig. 1D,E, Supplementary Material). The limit of detection based on Tau-441 ranged from 50 to 800 pg/mL while the limit of quantification defined as the concentration with a coefficient of variation lower than 20% ranged from 100 to 1000 pg/mL (Table 1). In the CSF of all the groups, we observed low peptide detection at the N- and C-terminus of the protein in comparison with the central core (Fig. 2, Supplementary Table 3). The two 2N specific peptides (pep_68–87, pep_88–126) were present in much lower amount than the 1N/2N peptide (pep_45–67) suggesting that the 1N isoform was the one mostly present in the CSF. Similarly, the 4R specific peptides (pep_275–280, pep_299–317) amounts were very low suggesting that the 3R isoform was mostly represented.
Correlation with ELISA
Importantly, for all Tau peptides, MS quantification was highly correlated to Tau measured in the same samples by ELISA (spearman’s rank correlation significance < 0.001). The capture BT2 antibody used for the Tau sandwich ELISA is directed against the epitope present on pep_194–198, while the detection antibody, HT7, has its epitope present on pep_159–167 (Fig. 1A). The correlation between ELISA and MS has been illustrated with pep_6–23, pep_156–164, and pep_396–406 (Fig. 3B-D). MS values were around 20 times higher than those from ELISA (for pep_156–164). Such discrepancy between the two analytical methods has been reported before [26]. It seemed mainly in relation with differences in standard material used for the calibration curves. As a matter of fact, when we analyzed, the recombinant Tau-441 protein with the ELISA kit we could confirm this important difference in quantitation.
We observed also that the levels of Tau peptides were all intra-correlated (spearman’s significance level p < 0.001), as illustrated for the most N- and C-terminal peptides (pep_6–23, pep_396–406) and the central peptide pep_156–163 (Fig. 3E,F).
CSF Tau molecular profile in AD, PSP, DLB, and non-AD patients
The quantification of the Tau peptides in the clinical groups revealed an important and significant increase in the AD group when compared to the other groups (Fig. 2, Supplementary Table 3, ANOVA p < 0.001). This was true for all the peptides, as illustrated in Figure 4B and C. This result was coherent with both the correlation of MS quantification to ELISA, and the higher values of Tau ELISA in AD (Figs 3 and 4). A striking observation was that the AD profile (Fig. 2) showed an indentation in the central core region that was not apparent in the other clinical groups. To visualize in more detail the variation in peptide concentrations in this region, we plotted the MS values of the four central core peptides, pep_156–163, pep_175–180, pep_181–190, and pep_195–209, after normalization (ratio) by the value of the pep_156–163 (Fig. 4D). The rationale was that the pep_156–163, which is not susceptible to post-translational modification like phosphorylation (Table 1), served as a reference for the total level of Tau (using instead the sum of all the peptides to normalize, resulted in a similar result). We then observed that pep_175–180 and pep_181–190 normalized levels were significantly lower in AD, while pep_195–209 was at the opposite higher in AD (this was also apparent in the Figure 2 looking at the shape of the right part of the central core region in AD and non-AD diagnosis). For PSP and DLB patients, the Tau central core appeared more elevated than in the control samples, which was in agreement with previous studies [10]. However, we had a low number of PSP and DLB patients in our cohort and this difference did not reach statistical significance.
DISCUSSION
Absolute quantification of peptides by MS is a recent analytical approach that yields unprecedented information to investigate biological events at a molecular level. Targeting large and complex proteins, like Tau, which are present in low-abundance in biological fluids, does, however, represent a major challenge. Here, thanks to an adaptation of the “protein standard for absolute quantification” (PSAQ) approach [16], an original purification protocol not relying on immunocapture, and the latest generation of MS analyzers, we could monitor in parallel 18 peptides encompassing the entire Tau protein sequence and isoform diversity. Previous MS attempts to monitor Tau in the CSF of patients were in fact limited to a few peptides and/or relied on immunoprecipitation procedures [27, 28]. Importantly, preanalytical procedures are a major issue in the field of proteomics research, as Greco et al. have pointed out in connection with the CSF in particular [29]. In the present study, the same preanalytical protocol was used with all the samples (see the Methods section) and samples were traced in keeping with biobank standard NFS 96–900. It was unfortunately not possible to perform an additional quality control on the samples using MALDI-TOF-MS methods, as described by Greco et al. [29]. This elegant approach could be implemen-ted in further studies using a larger cohort of samples.
Data generated by our study could be analyzed in different ways. The first one was related to the global molecular profile of Tau in the CSF. By looking at the absolute quantification of peptides covering Tau-441 sequence, we were able to deduce the expression profile characterized by low N- and C-terminus Tau expression and, in between these two, a central core with a much higher expression (up to 8 times more). In addition, the focus on isoform specific peptides was coherent with the 1N/3R isoform being the one most present in CSF. These data are relevant to predict the success/failure of Tau detection with antibodies targeting different regions. Because in our study the Tau protein was trypsin digested before analysis, we did not have a direct access to the exact fragments present in CSF. However, our results are coherent with the study of Meredith et al. [30] which described N- and C-terminal fragments associated with a 17 kDa central core fragment. Differences in output observed between the present study and those by Portelius et al. and McAvoy et al. [27] can be accounted for in various ways different origins. First, the MS methods used were different, and the fact that different preanalytical methods were used in particular (precipitation versus immunocapture) may have yielded different results. Secondly, and most importantly, the methods of quantification and the standards used to draw up the calibration curves were different. These differences are likely to have resulted in significant differences between the concentrations obtained. More homogeneous results could probably be obtained in the future by using a Certified Reference Material.
The second level of our analysis was related to comparing Tau expression in different pathological conditions. The most striking observation was that in AD there is an increase of Tau peptide concentrations not only for the central core of the protein, but along the entire protein sequence. These AD-related data have important consequences since extracellular Tau, may play an active role in neurodegenerative processes [31]. The Tau “microtubule-binding domain” which is believed to be important in Tau polymerization did indeed show a higher expression in AD. The diagnosis potential of MS Tau peptide detection is important since this analytical method has important advantage in terms of specificity and absolute quantification [14, 32]. Studies in larger cohorts will be needed to assess its interest in comparison with classical ELISA [25]. We also collected data on a small number of samples that corresponded to typical clinical cases of PSP and DLB. Based on brain western blot and ELISA analysis, PSP is believed to be associated with an accumulation of exon10/4R species in the affected areas [33, 34]. However and paradoxically, in the CSF of PSP patients, we could not find the predominance of 4R, a result that was previously suggested using isoform differential ELISA [35]. This underlined the fact that a low CSF concentration might in fact reflect the accumulation/polymerization into filaments of a biomarker in the brain, which is well known for Aβ1 - 42. It is also possible that low Tau concentrations for both immunodetection and MS reside in PTM (phosphorylation in particular), which would change biomarker detection. In our study however, we relied on multiple peptides, some of them not having any known site of PTM, which reinforces the strength of our results. Finally, the peculiar AD profile in the central core which, after normalization revealed the relative decrease of peptides pep_175–180 and pep_181–190, might well illustrate the expected impact of phosphorylation on MS peptide detection. Several phosphorylation sites were in fact reported in this region (including the T181 site detected by the pTau ELISA). The relative increase of pep_195–209 in AD, however, is very puzzling and could correspond also to differences in post-translational modification or in the amount of Tau fragments covering this sequence. Further studies, and in particular MS quantification of the corresponding phosphopeptides [36] would be needed to fully explain these observations.
One limitation of our study resides in the relatively small sample set used and the lack of histopathological data. However, the patients were carefully selected and they had a good correspondence between clinical and biological phenotypes. Confirmation of our findings and evaluation of the diagnosis interest of MS Tau detection would nevertheless require an analysis of larger cohorts using multiplex assay, which would ideally include phosphopeptides. The application of our method of PRM Tau detection to routine laboratory situations will require having access to an expert proteomics center and will also require means of producing large enough amounts of quality controlled standard material. Analysis of brain homogenates will be also very interesting to understand Tau metabolism in physiological and pathological situations. It will also be interesting to investigate whether Tau truncation and the ratios between fragments change during the progression of the disease. In any case, we believe that our study clearly demonstrated the relevance of a new quantitative multiplex MS strategy and provided a new vision of Tau metabolism in CSF for future therapeutic interventions [4] and improved molecular diagnosis.
ACKNOWLEDGMENTS
This work was supported by the 2010 National PHRC “ProMara”: Use of targeted quantitative proteomics and metabolic labeling with stable isotopes for the diagnosis and the investigation of neurological disorders and in particular Alzheimer Disease” and through the National French Alzheimer effort (“Plan Alzheimer”). The authors thank Guy Lippens for the gift of recombinant Tau proteins and the Clinical Proteomics Plateform of the CHU of Montpellier (Head: Dr C.Hirtz) for its technical support.
Authors’ disclosures available online (http://j-alz.com/manuscript-disclosures/15-0962r1).
Appendices
The supplementary material is available in the electronic version of this article: http://dx.doi.org/10.3233/JAD-150962
REFERENCES
[1] | Sergeant N , Bretteville A , Hamdane M , Caillet-Boudin ML , Grognet P , Bombois S , Blum D , Delacourte A , Pasquier F , Vanmechelen E , Schraen-Maschke S , Buee L ((2008) ) Biochemistry of Tau in Alzheimer’s disease and related neurological disorders. Expert Rev Proteomics 5: , 207–224. |
[2] | Avila J , Lucas JJ , Perez M , Hernandez F ((2004) ) Role of tau protein in both physiological and pathological conditions. Physiol Rev 84: , 361–384. |
[3] | Jack CR Jr , Holtzman DM ((2013) ) Biomarker modeling of Alzheimer’s disease. Neuron 80: , 1347–1358. |
[4] | Giacobini E , Gold G ((2013) ) Alzheimer disease therapy–moving from amyloid-beta to tau. Nat Rev Neurol 9: , 677–686. |
[5] | Skillback T , Rosen C , Asztely F , Mattsson N , Blennow K , Zetterberg H ((2014) ) Diagnostic performance of cerebrospinal fluid total tau and phosphorylated tau in Creutzfeldt-Jakob disease: Results from the Swedish Mortality Registry. JAMA Neurol 71: , 476–483. |
[6] | Bombois S , Duhamel A , Salleron J , Deramecourt V , Mackowiak MA , Deken V , Sergeant N , Pasquier F , Buee L , Sablonniere B , Schraen-Maschke S ((2013) ) A new decision tree combining Abeta 1-42 and p-Tau levels in Alzheimer’s diagnosis. Curr Alzheimer Res 10: , 357–364. |
[7] | Fagan AM , Shaw LM , Xiong C , Vanderstichele H , Mintun MA , Trojanowski JQ , Coart E , Morris JC , Holtzman DM ((2011) ) Comparison of analytical platforms for cerebrospinal fluid measures of beta-amyloid 1-42, total tau, and p-tau181 for identifying Alzheimer disease amyloid plaque pathology. Arch Neurol 68: , 1137–1144. |
[8] | Lehmann S , Dumurgier J , Schraen S , Wallon D , Blanc F , Magnin E , Bombois S , Bousiges O , Campion D , Cretin B , Delaby C , Hannequin D , Jung B , Hugon J , Laplanche JL , Miguet-Alfonsi C , Peoc’h K , Philippi N , Quillard-Muraine M , Sablonniere B , Touchon J , Vercruysse O , Paquet C , Pasquier F , Gabelle A ((2014) ) A diagnostic scale for Alzheimer’s disease based on cerebrospinal fluid biomarker profiles. Alzheimers Res Ther 6: , 38. |
[9] | Blennow K , Hampel H ((2003) ) CSF markers for incipient Alzheimer’s disease. Lancet Neurol 2: , 605–613. |
[10] | Schoonenboom NS , Reesink FE , Verwey NA , Kester MI , Teunissen CE , van de Ven PM , Pijnenburg YA , Blankenstein MA , Rozemuller AJ , Scheltens P , van der Flier WM ((2012) ) Cerebrospinal fluid markers for differential dementia diagnosis in a large memory clinic cohort. Neurology 78: , 47–54. |
[11] | Hesse C , Rosengren L , Andreasen N , Davidsson P , Vanderstichele H , Vanmechelen E , Blennow K ((2001) ) Transient increase in total tau but not phospho-tau in human cerebrospinal fluid after acute stroke. Neurosci Lett 297: , 187–190. |
[12] | Hanger DP , Byers HL , Wray S , Leung KY , Saxton MJ , Seereeram A , Reynolds CH , Ward MA , Anderton BH ((2007) ) Novel phosphorylation sites in tau from Alzheimer brain support a role for casein kinase 1 in disease pathogenesis. J Biol Chem 282: , 23645–23654. |
[13] | Funk KE , Thomas SN , Schafer KN , Cooper GL , Liao Z , Clark DJ , Yang AJ , Kuret J ((2014) ) Lysine methylation is an endogenous post-translational modification of tau protein in human brain and a modulator of aggregation propensity. Biochem J 462: , 77–88. |
[14] | Lehmann S , Hoofnagle A , Hochstrasser D , Brede C , Glueckmann M , Cocho JA , Ceglarek U , Lenz C , Vialaret J , Scherl A , Hirtz C ((2013) ) Quantitative Clinical Chemistry Proteomics (qCCP) using mass spectrometry: General characteristics and application. Clin Chem Lab Med 51: , 919–935. |
[15] | Jaquinod M , Trauchessec M , Huillet C , Louwagie M , Lebert D , Picard G , Adrait A , Dupuis A , Garin J , Brun V , Bruley C ((2012) ) Mass spectrometry-based absolute protein quantification: PSAQ strategy makes use of “noncanonical” proteotypic peptides. Proteomics 12: , 1217–1221. |
[16] | Picard G , Lebert D , Louwagie M , Adrait A , Huillet C , Vandenesch F , Bruley C , Garin J , Jaquinod M , Brun V ((2012) ) PSAQ standards for accurate MS-based quantification of proteins: From the concept to biomedical applications. J Mass Spectrom 47: , 1353–1363. |
[17] | Dubois B , Slachevsky A , Litvan I , Pillon B ((2000) ) The FAB: A Frontal Assessment Battery at bedside. Neurology 55: , 1621–1626. |
[18] | McKhann G , Drachman D , Folstein M , Katzman R , Price D , Stadlan EM ((1984) ) Clinical diagnosis of Alzheimer’s disease: Report of the NINCDS-ADRDA Work Group under the auspices of Department of Health and Human Services Task Force on Alzheimer’s Disease. Neurology 34: , 939–944. |
[19] | Litvan I , Agid Y , Calne D , Campbell G , Dubois B , Duvoisin RC , Goetz CG , Golbe LI , Grafman J , Growdon JH , Hallett M , Jankovic J , Quinn NP , Tolosa E , Zee DS ((1996) ) Clinical research criteria for the diagnosis of progressive supranuclear palsy (Steele-Richardson-Olszewski syndrome): Report of the NINDS-SPSP international workshop. Neurology 47: , 1–9. |
[20] | McKeith IG , Dickson DW , Lowe J , Emre M , O’Brien JT , Feldman H , Cummings J , Duda JE , Lippa C , Perry EK , Aarsland D , Arai H , Ballard CG , Boeve B , Burn DJ , Costa D , Del Ser T , Dubois B , Galasko D , Gauthier S , Goetz CG , Gomez-Tortosa E , Halliday G , Hansen LA , Hardy J , Iwatsubo T , Kalaria RN , Kaufer D , Kenny RA , Korczyn A , Kosaka K , Lee VM , Lees A , Litvan I , Londos E , Lopez OL , Minoshima S , Mizuno Y , Molina JA , Mukaetova-Ladinska EB , Pasquier F , Perry RH , Schulz JB , Trojanowski JQ , Yamada M ((2005) ) Diagnosis and management of dementia with Lewy bodies: Third report of the DLB Consortium. Neurology 65: , 1863–1872. |
[21] | Lippens G , Wieruszeski JM , Leroy A , Smet C , Sillen A , Buee L , Landrieu I ((2004) ) Proline-directed random-coil chemical shift values as a tool for the NMR assignment of the tau phosphorylation sites. Chembiochem 5: , 73–78. |
[22] | Bros P , Vialaret J , Barthelemy N , Delatour V , Gabelle A , Lehmann S , Hirtz C ((2015) ) Antibody-free quantification of seven tau peptides in human CSF using targeted mass spectrometry. Front Neurosci 9: , 302. |
[23] | Peterson AC , Russell JD , Bailey DJ , Westphall MS , Coon JJ ((2012) ) Parallel reaction monitoring for high resolution and high mass accuracy quantitative, targeted proteomics. Mol Cell Proteomics 11: , 1475–1488. |
[24] | Gallien S , Duriez E , Demeure K , Domon B ((2013) ) Selectivity of LC-MS/MS analysis: Implication for proteomics experiments. J Proteomics 81: , 148–158. |
[25] | Gabelle A , Dumurgier J , Vercruysse O , Paquet C , Bombois S , Laplanche JL , Peoc’h K , Schraen S , Buee L , Pasquier F , Hugon J , Touchon J , Lehmann S ((2013) ) Impact of the 2008-2012 French Alzheimer Plan on the use of cerebrospinal fluid biomarkers in research memory center: The PLM Study. J Alzheimers Dis 34: , 297–305. |
[26] | Delaby C , Vialaret J , Bros P , Gabelle A , Lefebvre T , Puy H , Hirtz C , Lehmann S ((2014) ) Clinical measurement of Hepcidin-25 in human serum: Is quantitative mass spectrometry up to the job?. EuPA Open Proteomics 3: , 60–67. |
[27] | McAvoy T , Lassman ME , Spellman DS , Ke Z , Howell BJ , Wong O , Zhu L , Tanen M , Struyk A , Laterza OF ((2014) ) Quantification of tau in cerebrospinal fluid by immunoaffinity enrichment and tandem mass spectrometry. Clin Chem 60: , 683–689. |
[28] | Portelius E , Hansson SF , Tran AJ , Zetterberg H , Grognet P , Vanmechelen E , Hoglund K , Brinkmalm G , Westman-Brinkmalm A , Nordhoff E , Blennow K , Gobom J ((2008) ) Characterization of tau in cerebrospinal fluid using mass spectrometry. J Proteome Res 7: , 2114–2120. |
[29] | Greco V , Pieragostino D , Piras C , Aebersold R , Wiltfang J , Caltagirone C , Bernardini S , Urbani A ((2014) ) Direct analytical sample quality assessment for biomarker investigation: Qualifying cerebrospinal fluid samples. Proteomics 14: , 1954–1962. |
[30] | Meredith JE Jr , Sankaranarayanan S , Guss V , Lanzetti AJ , Berisha F , Neely RJ , Slemmon JR , Portelius E , Zetterberg H , Blennow K , Soares H , Ahlijanian M , Albright CF ((2013) ) Characterization of novel CSF Tau and ptau biomarkers for Alzheimer’s disease. PLoS One 8: , e76523. |
[31] | Clavaguera F , Bolmont T , Crowther RA , Abramowski D , Frank S , Probst A , Fraser G , Stalder AK , Beibel M , Staufenbiel M , Jucker M , Goedert M , Tolnay M ((2009) ) Transmission and spreading of tauopathy in transgenic mouse brain. Nat Cell Biol 11: , 909–913. |
[32] | Lehmann S , Barthelemy N , Vialaret J , Schraen-Maschke S , Tiers L , Delaby C , Becher F , Touchon J , Junot C , Hirtz C , Gabelle A ((2013) ) Quantitative mass spectrometry (SRM/MRM) for amyloid peptides, tau protein and apolipoprotein E in human cerebrospinal fluid for Alzheimer’s disease diagnosis. Alzheimers Dement 4: , 212. |
[33] | D’Souza I , Schellenberg GD ((2005) ) Regulation of tau isoform expression and dementia. Biochim Biophys Acta 1739: , 104–115. |
[34] | Sergeant N , Delacourte A , Buee L ((2005) ) Tau protein as a differential biomarker of tauopathies. Biochim Biophys Acta 1739: , 179–197. |
[35] | Luk C , Compta Y , Magdalinou N , Marti MJ , Hondhamuni G , Zetterberg H , Blennow K , Constantinescu R , Pijnenburg Y , Mollenhauer B , Trenkwalder C , Van Swieten J , Chiu WZ , Borroni B , Camara A , Cheshire P , Williams DR , Lees AJ , de Silva R ((2012) ) Development and assessment of sensitive immuno-PCR assays for the quantification of cerebrospinal fluid three- and four-repeat tau isoforms in tauopathies. J Neurochem 123: , 396–405. |
[36] | Domanski D , Murphy LC , Borchers CH ((2010) ) Assay development for the determination of phosphorylation stoichiometry using multiple reaction monitoring methods with and without phosphatase treatment: Application to breast cancer signaling pathways. Anal Chem 82: , 5610–5620. |
Figures and Tables
Fig.1
A) Schematic representation of the Tau-441 (2R/4R) sequence with the localization at the bottom of the quantified peptides, and at the top the exons subjected to alternative splicing and the names and epitopes of the commonly used Tau antibodies. B) μLC-MS/HRMS extracted chromatograms from 441-Tau peptides quantified by scheduled parallel reaction monitoring (PRM). C) PRM signal of the extracted ion current of the pep_156–163 fragments. D,E) Quantitation of pep_156–163 (D) and pep_299–317 (E) in CSF samples (crosses) using the calibration curve of triplicate concentration of 14N Tau-441. Note the high R2 resulting from the linear regression of the calibration curve values.
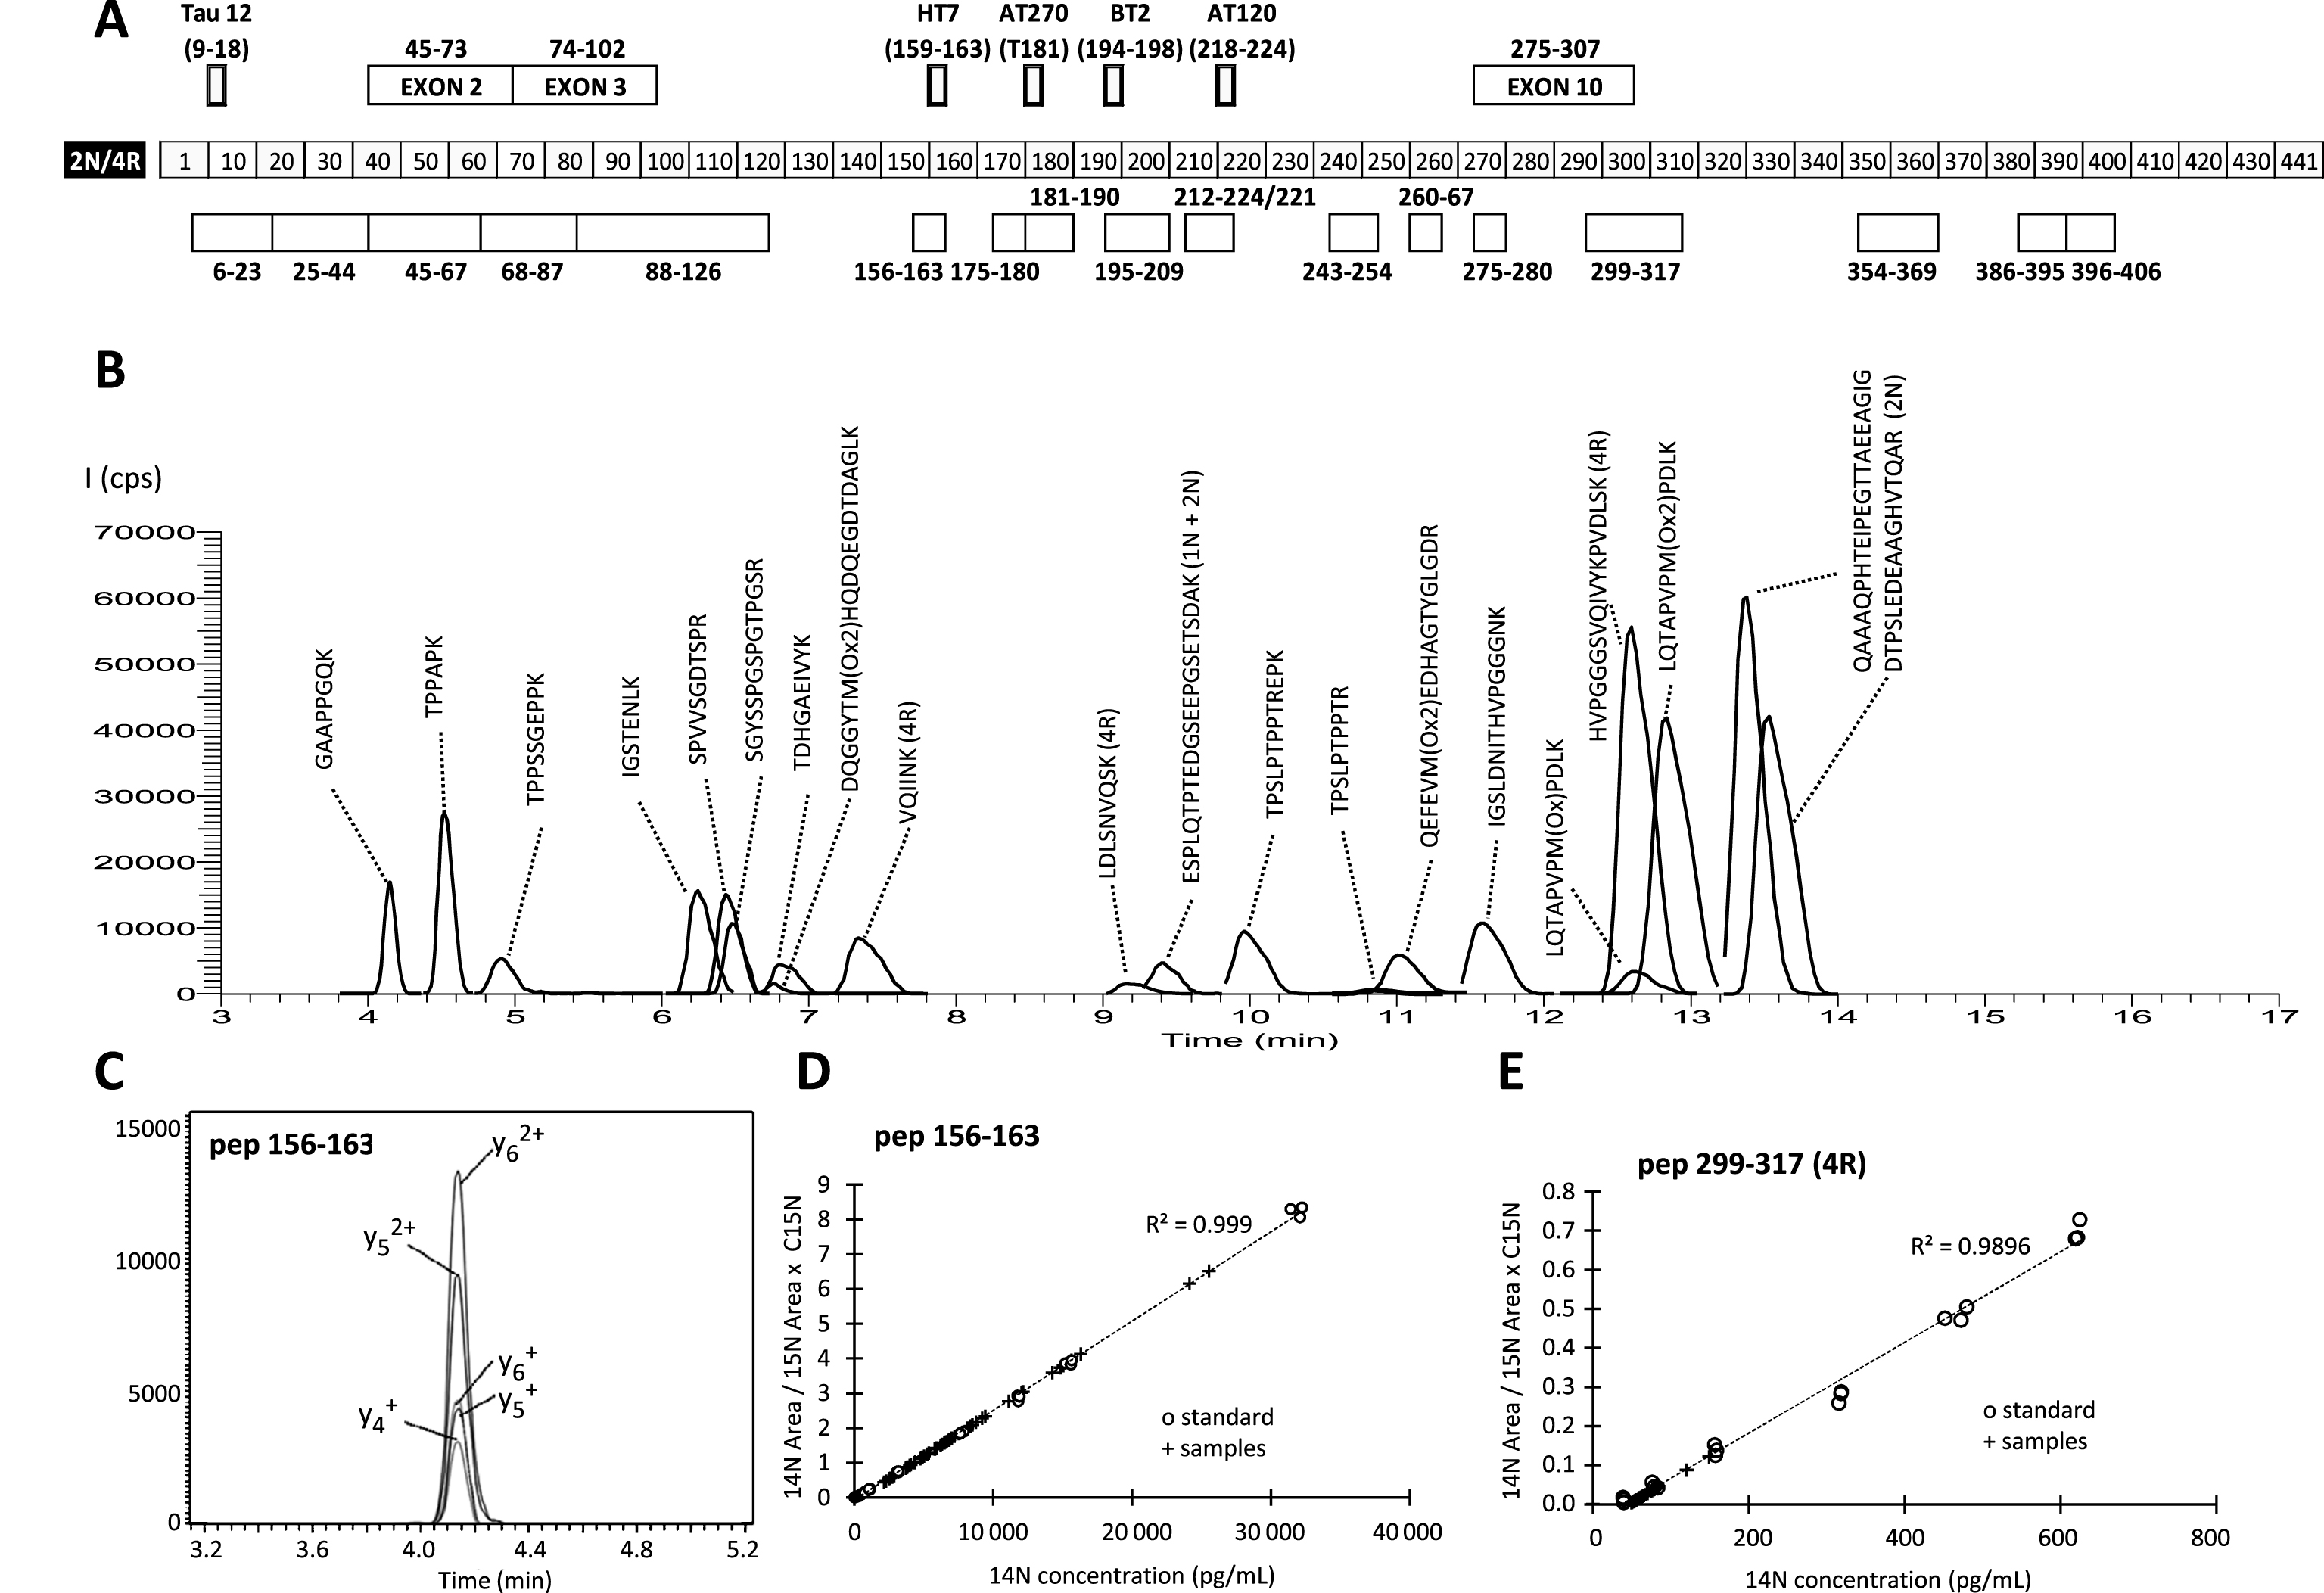
Fig.2
Schematic view of Tau peptide expression (y-axis: in pg/mL relative to the reference labeled Tau-441 recombinant protein) in the various clinical groups. The peptides have been aligned on the Tau sequence presented at the bottom of the figure. The peptides have been connected in order to form a surface that can be easily compared between clinical groups. Note the very low levels of the peptides corresponding to the 2N and 4R isoforms and the higher value of the AD profile with its peculiar shape (indentation) in the central core region. AD, Alzheimer’s disease; PSP, progressive supranuclear palsy; DLB, dementia with Lewy body; CTRL, control patients.
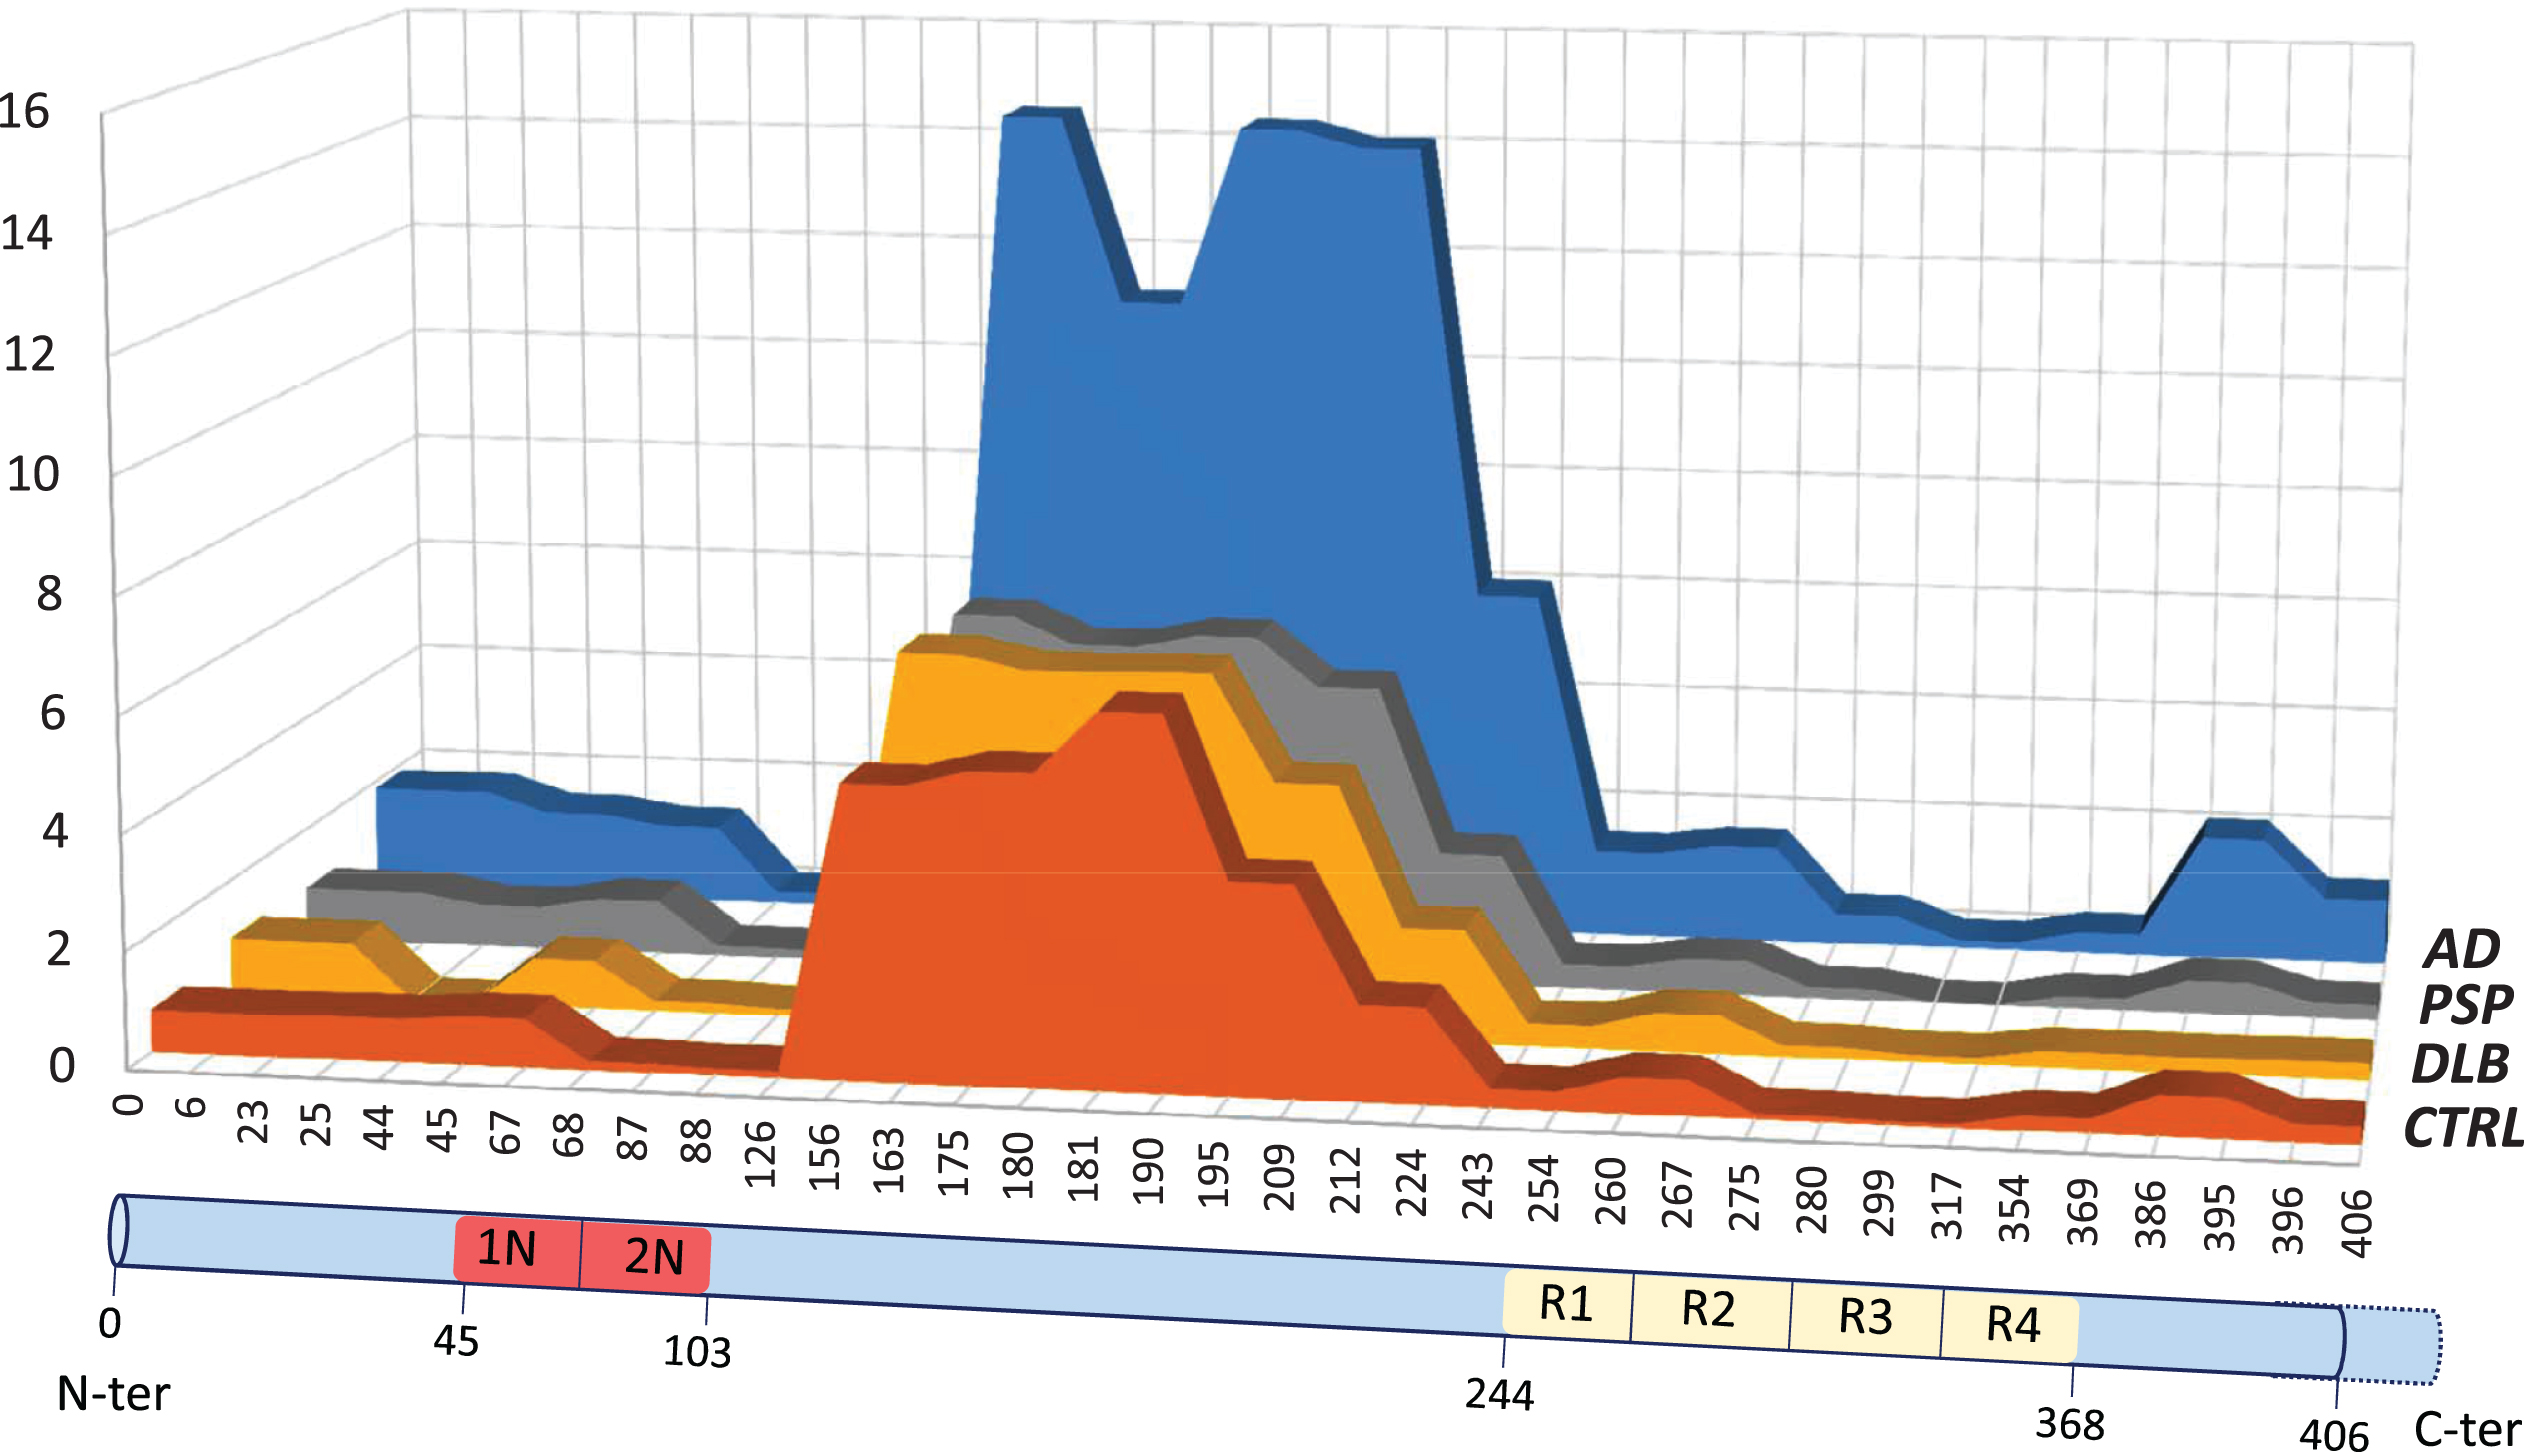
Fig.3
AD patient (1) are indicated with a black triangle (▵) and non-AD patient (O) with a circle. A) Correlation curve between p181 phosphorylated Tau (p-Tau) and total Tau (t-Tau) measured by ELISA in the cohort (spearman’s rank correlation coefficient = 0.92, significance < 0.001). Value are in pg/mL. B–D) Correlation curve between total Tau (t-Tau) measured by ELISA in the cohort and pep_6–23, pep_156–163 and pep_396–406 MS values. Spearman’s rank correlation coefficient are 0.927, 0.968 and 0.936, respectively; significance for all <0.0001. E,F) Correlation curve between pep_156–163 and pep_6–23 or pep_396–406 MS values. Spearman’s rank correlation coefficient are 0.943 and 0.902; significance for all <0.001.
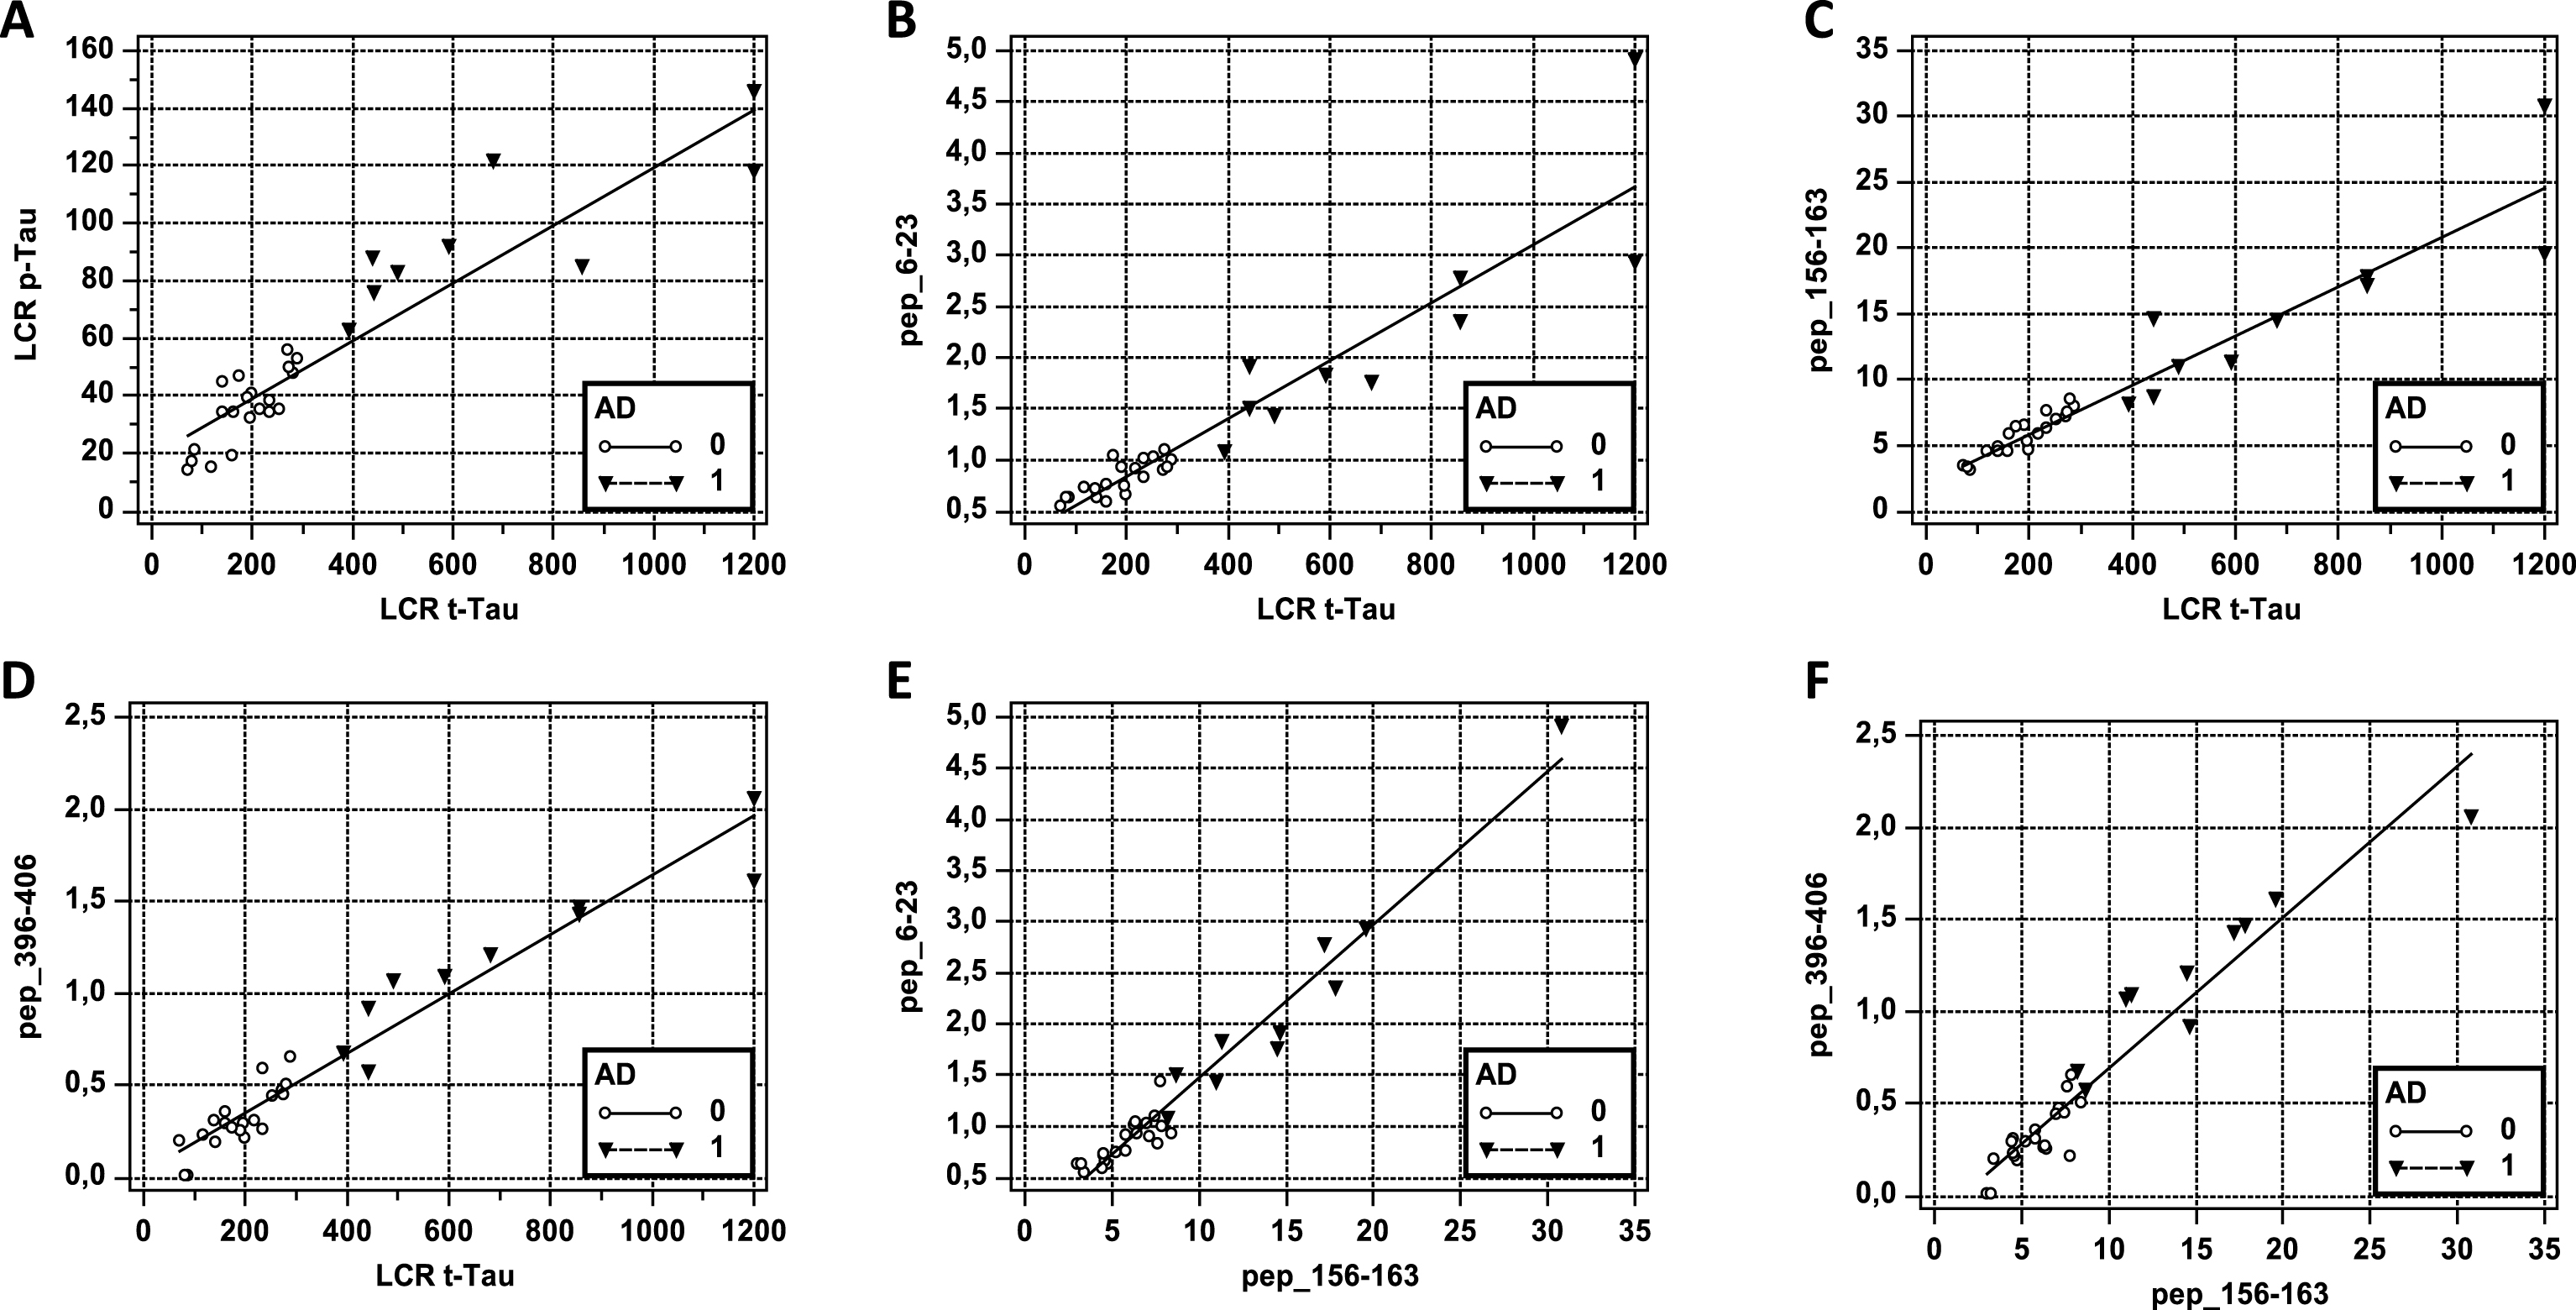
Fig.4
Non-AD (NAD) and AD population corresponds in all the panels to the first light bar and to the second dark bar respectively. A) Values (mean ± SD, pg/mL) of Aβ1–42, total Tau (t-Tau), and p181 Tau (p-Tau) measured by ELISA in the non-AD (NAD) and AD population. Student t-test p < 0.001 and p < 0.0001, respectively. B) MS values (mean ± SD, pg/mL) in the AD and the NAD population for the four central core peptides: pep_156–163, pep_175–180, pep_181–190, and pep_195–209. Student t-test for all p < 0.0001. C) MS values (mean ± SD, pg/mL) in the NAD and the AD population for the peptides along Tau sequence: pep_6–23, pep_45–67, pep_243–254, and pep_396–406. Student t-test for all p < 0.0001. D) Ratio between pep_156–163 MS values, used as reference and MS values of the four central core peptides: pep_156–163, pep_175–180, pep_181–190, and pep_195–209. Student t-test p < 0.001, p = 0.007 and p < 0.001 for NAD versus AD pep_175–180, pep_181–190, and pep_195–209, respectively.
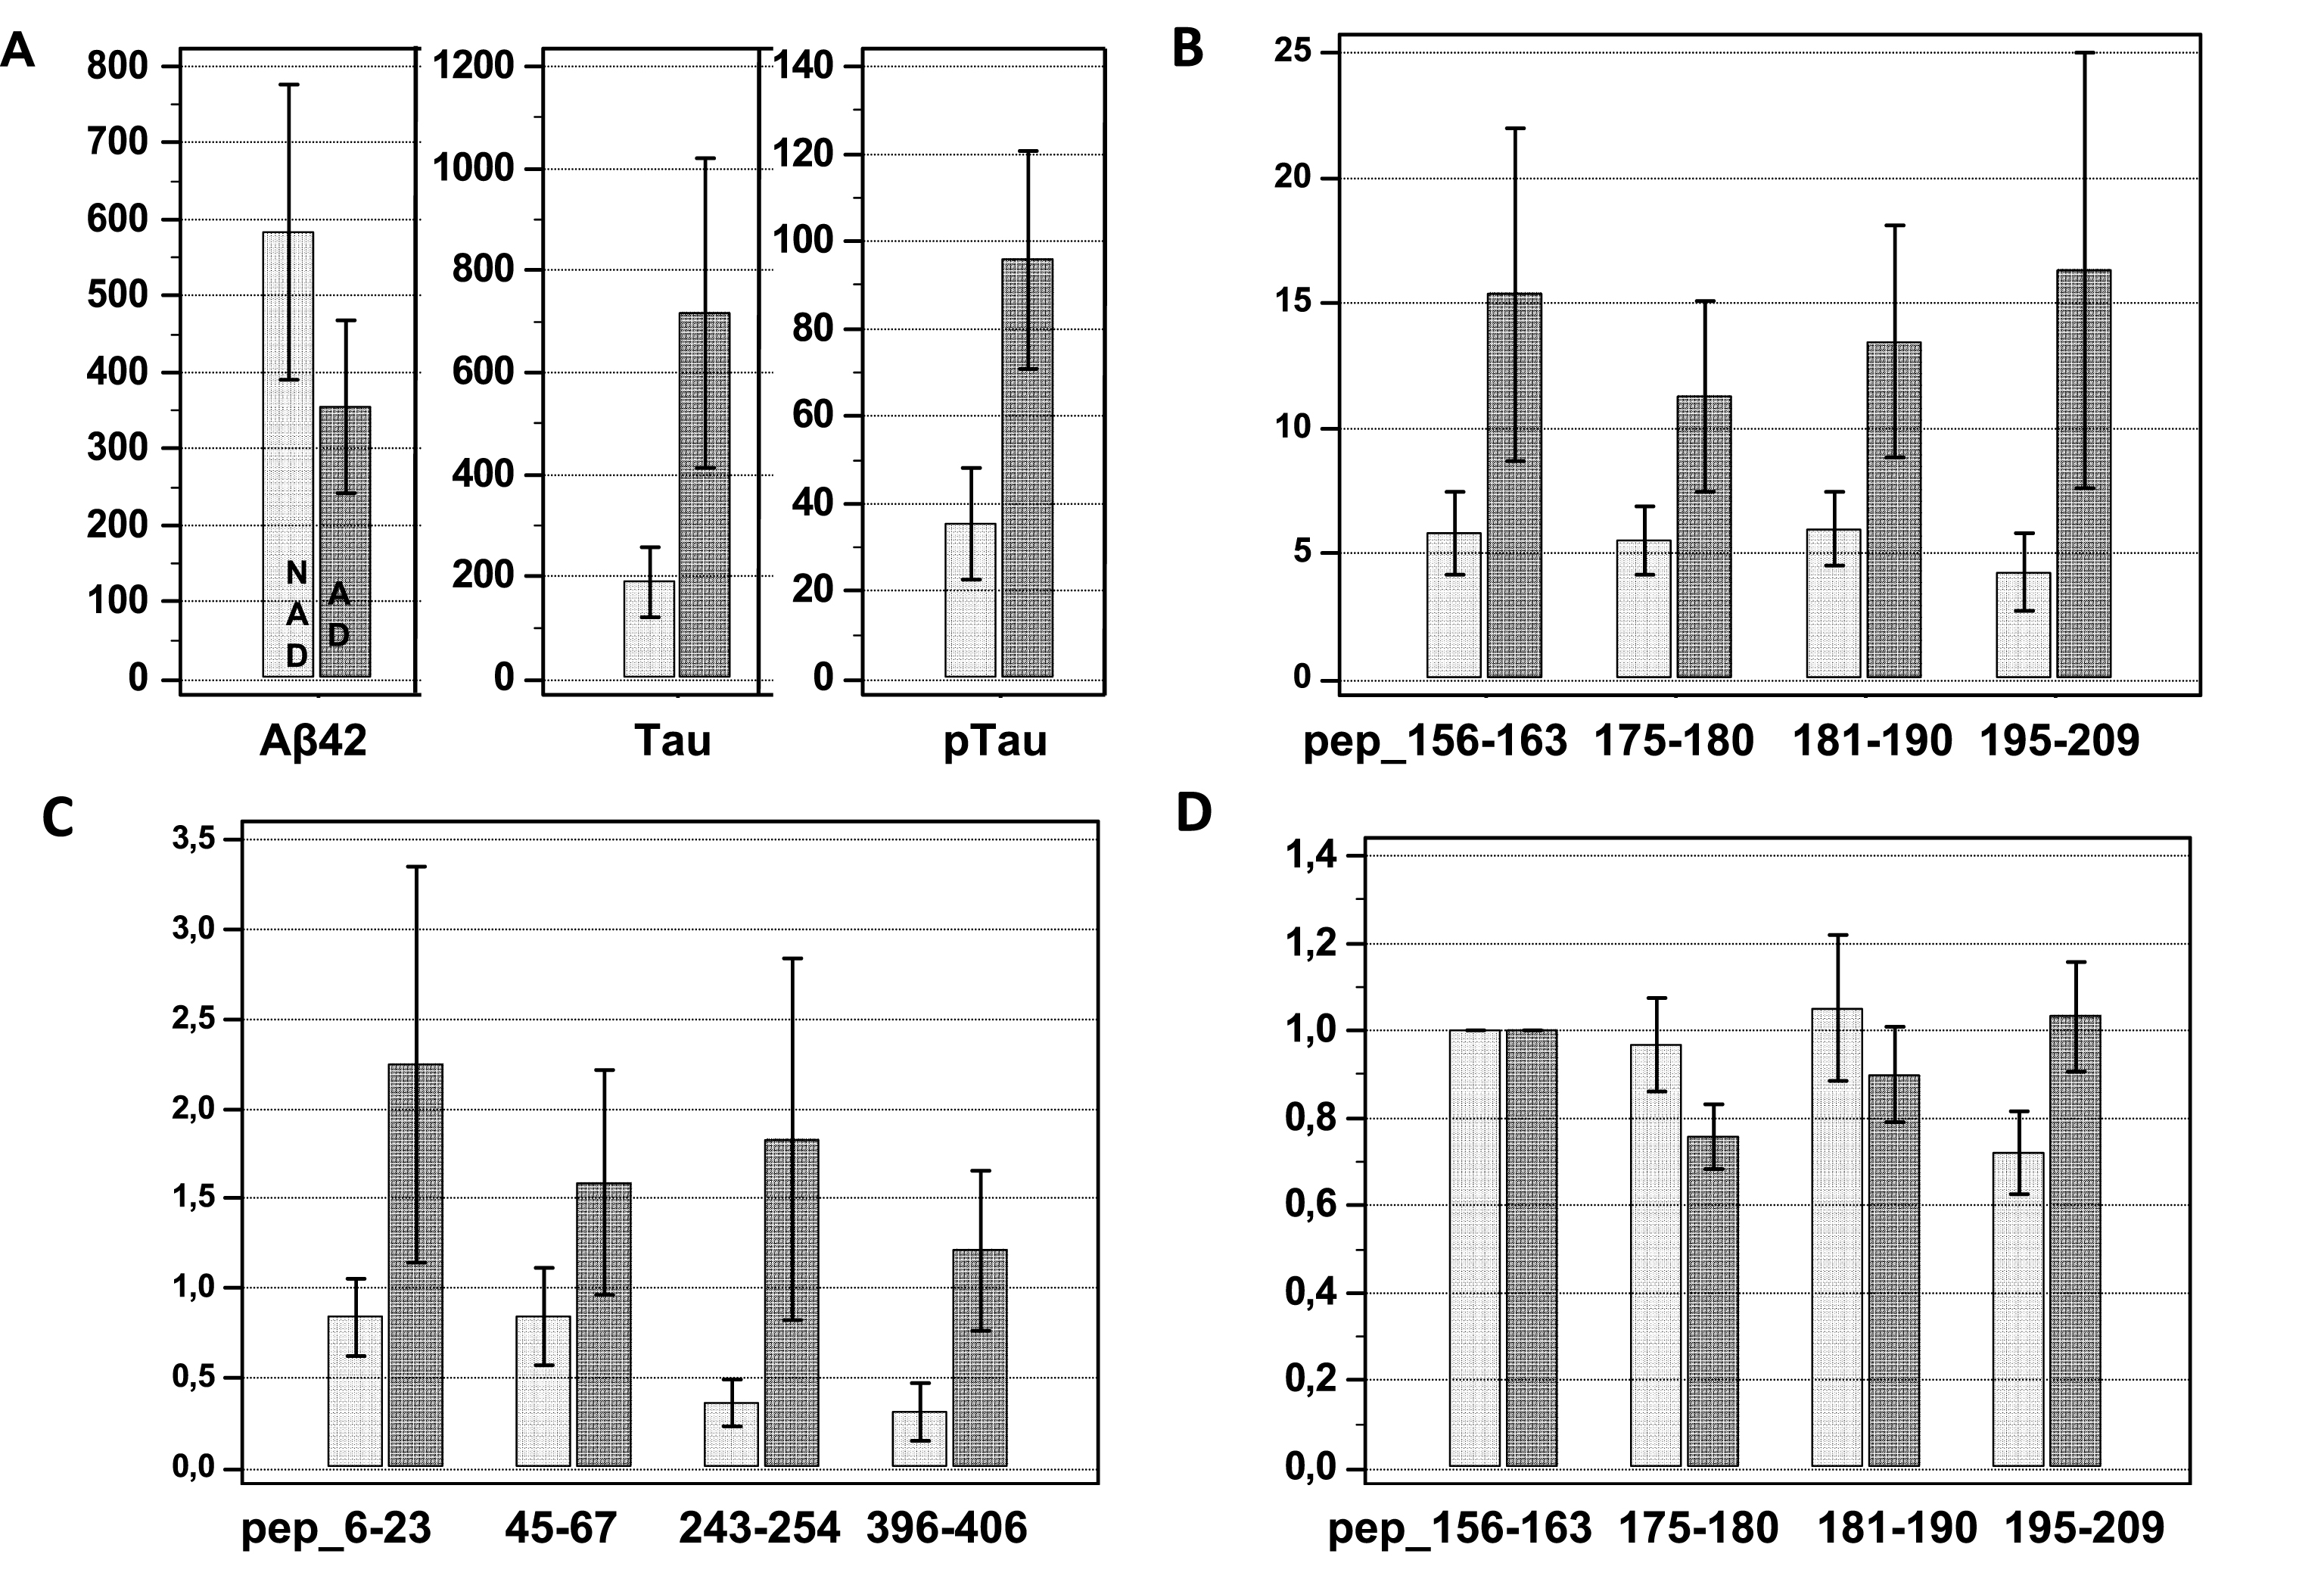
Table 1
Tau peptide names are based on the Tau-441 numbering
| Peptide | Sequence | Exon specific | Phosphorylation in human brain | LOD based on Tau-441 conc. | LOQ based on Tau-441 conc. | Average CV % at LOQ |
| pep_6–23 | QEFEVMox2EDHAGTYGLGDR | T17–Y18 | 100 | 800 | 7.1 | |
| pep_25–44 | DQGGYTMox2HQDQEGDTDAGLK | T30–T39 | 800 | 1000 | 8.5 | |
| pep_45–67 | ESPLQTPTEDGSEEPGSETSDAK | 1N/2N | S46–T50 | 400 | 600 | 3.7 |
| pep_68–87 | STPTAEDVTAPLVDEGAPGK | 2N | S68–S69–T71 | 50 | 100 | 2.7 |
| pep_88–126 | QAAAQPHTEIPEGTTAEEAG IGDTPSLEDEAAGHVTQAR | 2N | S113–T123 | 50 | 200 | 4.8 |
| pep_156–163 | GAAPPGQK | 50 | 200 | 2.9 | ||
| pep_175–180 | TPPAK | T175 | 50 | 200 | 2.5 | |
| pep_181–190 | TPPSSGEPPK | T181–S184–S185 | 200 | 400 | 2.9 | |
| pep_195–209 | SGYSSPGSPGTPGSR | Y197–S198–S199–S202-T205-S208 | 200 | 400 | 3.6 | |
| pep_212–221 | TPSLPTPPTR | T212–S214–T217 | 400 | 400 | 3.7 | |
| pep_212–224 | TPSLPTPPTREPK | T212–S214–T217 | 100 | 400 | 2.9 | |
| pep_243–254 | LQTAPVPMox2PDLK | 50 | 200 | 5.5 | ||
| pep_260–267 | IGSTENLK | S262–T263 | 100 | 200 | 3.6 | |
| pep_275–280 | VQIINK | 4R | 100 | 200 | 4.4 | |
| pep_299–317 | HVPGGGSVQIVYKPVDLSK | 4R | S305 | 50 | 100 | 4.8 |
| pep_354–369 | IGSLDNITHVPGGGNK | S356–T361 | 100 | 400 | 5.4 | |
| pep_386–395 | TDHGAEIVYK | T386–Y394 | 400 | 600 | 5.6 | |
| pep_396–406 | SPVVSGDTSPR | S396–S400–T403–S404 | 100 | 200 | 4.2 |
Full sequences, exon specificity, and presence of known phosphorylation sites are indicated. The limit of detection (LOD) corresponded to the equivalent concentration of recombinant Tau-441 for which PRM ion count was detected. The limit of quantification (LOQ) corresponded to the equivalent lowest concentration of recombinant Tau-441 giving rise to the corresponding peptide detection which coefficient of variation was below 20%.

