
Parkinson’s Disease Subtypes in the Oxford Parkinson Disease Centre (OPDC) Discovery Cohort
Abstract
Background:
Within Parkinson’s there is a spectrum of clinical features at presentation which may represent sub-types of the disease. However there is no widely accepted consensus of how best to group patients.
Objective:
Use a data-driven approach to unravel any heterogeneity in the Parkinson’s phenotype in a well-characterised, population-based incidence cohort.
Methods:
769 consecutive patients, with mean disease duration of 1.3 years, were assessed using a broad range of motor, cognitive and non-motor metrics. Multiple imputation was carried out using the chained equations approach to deal with missing data. We used an exploratory and then a confirmatory factor analysis to determine suitable domains to include within our cluster analysis. K-means cluster analysis of the factor scores and all the variables not loading into a factor was used to determine phenotypic subgroups.
Results:
Our factor analysis found three important factors that were characterised by: psychological well-being features; non-tremor motor features, such as posture and rigidity; and cognitive features. Our subsequent five cluster model identified groups characterised by (1) mild motor and non-motor disease (25.4%), (2) poor posture and cognition (23.3%), (3) severe tremor (20.8%), (4) poor psychological well-being, RBD and sleep (18.9%), and (5) severe motor and non-motor disease with poor psychological well-being (11.7%).
Conclusion:
Our approach identified several Parkinson’s phenotypic sub-groups driven by largely dopaminergic-resistant features (RBD, impaired cognition and posture, poor psychological well-being) that, in addition to dopaminergic-responsive motor features may be important for studying the aetiology, progression, and medication response of early Parkinson’s.
INTRODUCTION
Parkinson’s disease (PD) is a common neurodegenerative condition encompassing both motor and non-motor symptoms. Even within pathologically defined patient cohorts, there remains a spectrum of clinical features, treatment response and prognosis [1]. These differences in clinical phenotype may represent different PD subtypes, but there is no widely accepted consensus on the criteria for such groups. Clinically accurate sub-typing may result in improved delineation of aetiological mechanisms, better prognostic counselling, and improved targeting of disease modifying therapies. Attempts to sub-classify PD include “top-down” approaches which depend on an a priori assumption, such as the division of subjects by motor phenotype and age of onset [2, 3]. Unfortunately, this approach relies on accurate clinical observation to recognise patterns from all available variables, which is difficult given the breadth of clinical features. Recently, attempts at subtyping have employed data-driven, “bottom-up” approaches, allowing unexpected patterns or discriminating features to be determined [4]. Outcomes of the group characteristics depend heavily on the breadth and depth of the variables inputted into the models. In this study, we have used an approach with key methodological refinements including: 1) restriction to incident patients, to avoid the confounding effects of disease duration, with a far broader range of motor and non-motor assessments than most previously published studies 2) using factor analysis methods to reduce the large number of motor/non-motor variables into a smaller number of clinically important domains describing patient variability 3) using k-means cluster analysis with the inclusion of additional clinical features that may have not been already captured by the factor analysis.
MATERIALS AND METHODS
Patient selection with inclusion/exclusion criteria
PD patients diagnosed within the past 3.5 years were prospectively recruited as part of the Oxford Parkinson’s Disease Centre (OPDC) cohort study from 11 hospitals across the Thames Valley covering a population of approximately 2.1 million (PD-Discovery, website: http://opdc.medsci.ox.ac.uk). Full details of this cohort are described elsewhere, [5] with participants being recruited between September 2010 and September 2014.
Patients were eligible for study inclusion if they met the UK Parkinson’s Disease Society Brain Bank (UKPDBB) criteria for the diagnosis of idiopathic PD, as judged by a neurologist, with no atypical features to suggest an alternative diagnosis following systematic clinic assessment derived from the NIH PD-DOC study questionnaire (http://grants.nih.gov/grants/guide/rfa-files/RFA-NS-11-001.html). Patients with secondary parkinsonism due to head trauma or medication use, or features of atypical parkinsonism syndromes, such as multiple system atrophy, progressive supra nuclear palsy, corticobasal degeneration, dementia with Lewy bodies, or with significant documented postural BP drop on standardised measurement or significant urinary symptoms were excluded. Each patient was assigned a percentage probability that they met UKPDBB criteria for PD diagnosis by the research neurologist following the study visit. Date of symptom onset was recorded as the date the patient or their carer first became aware of motoric symptoms in relation to their PD, even if occurring on a mild or intermittent basis without initial obvious progression; for example hand tremor, reduced manual dexterity or arm swing. Date of diagnosis was recorded as the date the patient was first given a diagnosis of PD by their hospital specialist (neurologist or geratologist), with the subsequent delay from motoric symptom onset to diagnosis, and delay from date of diagnosis to first (baseline) research clinic visit calculated. Disease duration from motoric symptom onset to date of first (baseline) research clinic visit was also calculated.
Patient evaluation
A full description of the tests and assessments used to assess the Discovery cohort has been published [5, 6]. Assessments were done by the patient completing self-evaluating questionnaires at home and a clinic consultation conducted by a trained neurologist and a nurse. Where patients were taking dopaminergic medications, the assessment was carried out in the clinically-defined on-state. Medication use was recorded allowing the calculation of the levodopa equivalent daily dose (LEDD) [7]. Patient response to antiparkinson therapy was assessed using the physician-rated Clinical Global Impression of Change Scale (CGI-C) [8]. Included in the cluster analysis were: the Movement Disorders Society (MDS) revised Unified Parkinson’s Disease Rating Scale (UPDRS part I and part III); ‘Sniffin’ Sticks 16-item odour identification test; Big Five Inventory –extraversion scale; Epworth Sleepiness Scale; REM Sleep Behaviour Disorder Screening Questionnaire; Leeds Anxiety and Depression Scale (LADS); Becks Depression Inventory (BDI); Questionnaire for Impulsive-Compulsive Disorders in Parkinson’s Disease; Honolulu Asia Aging Study Constipation Questionnaire; Montreal Cognitive Assessment; Phonemic and Semantic verbal fluency; Purdue Peg-board Test; the timed Get Up and Go test; Flamingo test; Orthostatic blood pressure measurement. We explicitly did not include age at onset as this is a demographic variable rather than a feature of PD. Age at onset could influence the phenomenology of PD through two mechanisms: (a) it may confound phenotypic variability due to age-related comorbidity so older patients will have worse motor function unrelated to their PD and/or (b) it may be a proxy marker for different pathophysiological mechanisms which in turn alter the presenting features of PD. Adjusting for age would be helpful for the former but harmful for the latter as it would reduce the likelihood of identifying different sub-groups. Given the exploratory nature of the analysis, we therefore chose to see how any sub-types related to age in our analyses.
Standard protocol approvals, registrations, and patient consents
The study was undertaken with the understanding and written informed consent of each subject, with the approval of the local NHS ethics committee, and in compliance with national legislation and the Declaration of Helsinki.
Analysis dataset
Analysis was restricted to patients who were diagnosed within the previous 3.5 years and had a high probability of idiopathic PD (≥90% clinician-determined) following careful, structured neurological assessment. Where available, we used the latest follow-up visit to determine the likelihood of PD (n = 538, 58.2% seen after 18 and n = 170, 18.4% seen after 36 months).
Dealing with missing data
Where questionnaire data were partially completed we used the mean score if 80% or more questions were answered within a questionnaire. We then carried out multiple imputation using the chained equation approach to create 10 imputed datasets.
Determining variables to include within the cluster analysis
Our first step was to carry out an exploratory factor analysis (EFA) within each imputed dataset. We determined the number of important factors, only retaining those with an eigenvalue >1. A promax (oblique) rotation was used and only variables with a loading modulus of ≥0.4 were deemed sufficiently important to carry over to the second step.
The second step involved a confirmatory factor analysis (CFA) using the multiply imputed data given the results from the EFA and examining the following goodness of fit statistics: Comparative Fit Index (CFI), Tucker-Lewis Index (TLI) and the Root Mean Square Error of Approximation (RMSEA). A model was considered to fit the data well if CFI was ≥0.90, TLI ≥0.90 and RMSEA ≤0.06 [9]. We estimated factor scores for each individual from our CFA within each imputed dataset. At this stage we also considered other clinically important variables for the cluster analysis that were not found to load in any of our factors. Factor scores and other clinically important variables were combined using Rubin’s rules [10] to construct a single dataset for carrying out the cluster analysis.
Cluster analysis
We then examined if any variables which did not load on the factor analysis had value in identifying sub-groups by standardising them, so that they had equal weighting within the k-means cluster analysis and testing their inclusion in the cluster analysis. Ordered categorical and binary variables were weighted using the rules set out by Hennig et al. [11]. To determine the optimum number of clusters we carried out hierarchical clustering using the Ward algorithm [12] calculating the Calinski/Harabasz pseudo-F index [13] and the Duda/Hart pseudo-T-squared [14]. A higher value of Calinski/Harabasz pseudo-F index and a smaller value of the Duda/Hart pseudo-T squared indicate more distinct clustering. We considered models with between 2 to 5 clusters.
We then carried out k-means cluster analysis using the optimum number of clusters determined from the hierarchical analysis. To ensure convergence to the global maximum, we fitted the model using 500 random starts, and estimated the Calinski/Harabasz pseudo-F index stopping rule [13] to determine the optimal solution.
To test the utility of the sub-group classification, we examined the associations between the clusters with variables not included within the factor/cluster analysis, such as age at onset, time since diagnosis, and time since symptom onset, response to medication using the CGI-C, LEDD and the number of untreated individuals. We also examined the association between cluster membership and classification of PD patients into tremor dominant or postural instability/gait difficulty (PIGD), popularised by Jankovic [2] and updated by Stebbins et al. [15] for the MDS UPDRS.
To further test the reliability of the cluster solutions we applied a cross-validation approach where the data was randomly split into halves five times and the k-means cluster analysis repeated separately on each half. The number of individuals classified into the correct cluster was then determined. Hair et al. suggest that a very stable cluster solution would lead to >90% being correctly classified, a stable cluster solution 80–90% being correctly classified and a somewhat stable cluster solution 75–80% being correctly classified [12].
Computing
STATA version 13 was used to carry out the multiple imputation, Exploratory Factor Analysis (EFA) and the k-means cluster analysis. The Confirmatory Factor Analysis (CFA) and estimation of factor scores was carried out within Mplus.
RESULTS
At the time of this analysis, OPDC had recruited 924 patients (see Fig. 1) but we excluded 154 subjects either because of disease duration (41), they had a prior PD probability of <90% clinically (112), or because of a concomitant neurological disorder leading to significant disability in addition to PD, such that assessment of motor function was invalid (1). One individual was subsequently found to be a duplicate and was dropped from the cluster analysis. This left 769 subjects (age of onset 64.8 years) for the analysis. The baseline characteristics are presented in Table 1. 12.7% of patients were untreated and the mean MDS-UPDRS part III was 26.3. The variables included in our factor analysis had between 0.3% –7.8% missingvalues.
Exploratory factor analysis (EFA)
We included 34 variables measuring motor and non-motor domains within our EFA. MDS-UPDRS part III was split into four domains (rigidity, bradykinesia, postural, and tremor) to enable better discrimination. We also included the part III question related to speech. Laterality of symptoms was derived from the difference in responses between corresponding questions related to the right- and left-side from the MDS UPDRS part III (see Supplementary Table 1 for more detail on how each variable was derived).
Within each imputed dataset we found four factors to have an eigenvalue greater than 1. The first factor was a mixture of variables measuring non-motor features mostly related to psychological well-being: LADS, BDI, QUIP, BFI neuroticism and apathy, fatigue and pain domains from MDS-UPDRS. The second factor captured motor features either from the MDS UPDRS (rigidity, bradykinesia, postural, speech) or quantified motor performance (‘Get up and Go’ test, the flamingo test and Purdue pegboard test). The third factorcaptured cognition (MOCA, MMSE and phenomic and semantic fluency). A fourth factor captured constipation (from the UPDRS part I constipation question and Honolulu Asia Aging Study constipation questionnaire).
Confirmatory factor analysis (CFA)
Our EFA found very consistent results between the imputed datasets. For the CFA we could not estimate a constipation factor since a factor with only two variables is not identifiable. Our CFA of the remaining three factors fell slightly short of our pre-defined goodness of fit criteria with a CFI of 0.79, TLI of 0.88, and a RMSEA of 0.082. It is likely that our poor goodness of fit is due to the large number of variables in the first two factors [16] and our sample size [12]. However since we are only interested in calculating factor scores and not testing the validity of our structural model we kept the CFA as defined. We named factor 1, “psychological well-being”, factor 2, “non-tremor motor” and factor 3, “cognitive” (Table 2). Within each factor, variable loadings varied from 0.35 to 0.85, 0.43 to 0.76, and 0.59 to 0.78 respectively. The factor analysis did not capture a number of clinical features probably since they were not significantly correlated with any of the other variables in the analysis. Hence we decided to include any variable in our cluster analysis that was not loading into one of our factors. We did however exclude the other four BFI variables (since no other previous cluster analysis has looked at these personality traits) and the UPDRS constipation variable (since the other constipation variable was measuring the same trait) for the sake of parsimony.
Hierarchical and K-means cluster analysis
Supplementary Table 2 shows the statistics used to determine the optimum number of clusters from the hierarchical cluster analysis fitted using the Ward algorithm. Different conclusions on the optimum number of clusters would be drawn from different statistics. The Calinski/Harabasz pseudo-F index favoured a two cluster solution, and the Duda/Hart pseudo-T-squared a five cluster solution. This highlights the need for substantial researcher judgement on determining the optimum number of clusters and also the exploratory nature of cluster analysis. Because the two cluster solution appeared to discriminate patients mainly on disease severity with a poor and good group (Supplementary Figure 1), we chose to go forward with the exploratory five cluster solution as more helpful in describing the clinical heterogeneity between patients. Figure 2 shows the means values of each of the standardised variables within each cluster, all variables were coded such that positive indicates worse and negative better than average score. For the laterality variable positive is more bilateral than average and negative more unilateral than average. The groups were ordered in terms of size with the largest as the first. Table 3 shows the association between the clusters and ten variables not included within the factor analysis. There was moderate evidence of a difference in the mean duration of disease between clusters however in absolute terms the difference was negligible and hence we are confident these clusters are not an artefact of disease duration.
Patients in group 1 (25.4%) showed a milder form of PD and they also had a lower than average age at onset, a higher proportion of females, more drug naïve individuals and a lower LEDD. The second group (23.3%) comprised of individuals with worse than average non-tremor motor symptoms, cognitive features, smell, postural hypotension and with bilateral disease. They also had a higher than average age at onset and a lower proportion of females. Within this cluster over 49% were classified as PIGD, which was larger than the average proportion (34%). This cluster had higher than average LEDD and a higher proportion who responded well to therapy. The third group (20.8%) had patients with worse than average tremor scores but who were better than average in most of the other domains and with very unilateral disease. These individuals had similar average age at onset to the overall population and 84% of this cluster was classified as tremor dominant compared to 54% in the entire study population. This cluster had larger proportion of untreated individuals than the study population (18% versus 13%), and a lower than average LEDD. This cluster also had a lower proportion who responded well to PD therapy. The fourth group (18.9%) were marked by poor psychological well-being, RBD, and sleep problems. They also seemed to have better motor function, cognitive and postural hypotension than average with a lower than average age at onset, responded well to medication and were also on a higher than average LEDD. The fifth and smallest group (11.7%) were worse than average on almost all of the domains (except smell), showing a more severe form of PD. This group showed very severe psychological well-being which could be a secondary response to their fast progression or part of the clinical endophenotype. Within this cluster about 48% were classified as PIGD, very few individuals were untreated and they had a higher than average LEDD. The equivalent analysis for the two cluster solution is shown in Supplementary Table 3 for comparison. Supplementary Figure 2 shows the association between the UPDRS phenotype and the 5 cluster solution. It is interesting that although the third cluster is almost completely tremor dominant this cluster only includes about 32% of all the tremor dominant individuals. This highlights the differences in these approaches, that tremor dominant individuals have relatively more tremor problems compared to PIGD problems but do not necessarily have worse than average tremor.
Please note that the binary variable, hallucinations, and the categorical variables, urinary and constipation, have been scaled in a way so that they have equal weighting in the k-means cluster analysis when compared to the more continuous variables. However this does not mean that the distance of the within cluster means from the population average for these three variables can be interpreted in the same way as the other variables. Instead they should be considered relative to the other clusters. For instance the severity of urinary symptoms in the fifth cluster is worse that the severity in the fourth cluster. However we cannot be certain whether the severity of urinary symptoms in the fifth cluster is any less than the severity of sleepiness problems in the fifth cluster even though the within cluster mean of sleepiness is further from the population average.
Supplementary Table 4 shows the stability of the five cluster solution using our cross-validation approach. On average 73.8% of individuals were correctly classified which is close to the borders of a somewhat stable solution according to the Hair et al. criteria. The stability across the five split datasets was not consistent ranging from stable (83.7% correctly classified) to an unstable solution (64.5% correctly classified) so without an external validation it is difficult to determine the stability of our five cluster model. However the stability of the two cluster solution in the cross-validation is much better with on average 95.9% of individuals being correctly classified (Supplementary Table 5), a very stable solution which was consistent across the five split datasets. The apparent stability of the 2 cluster solution compared to the 5 cluster solution is not particularly surprising since there are 1 compared to 4 ways of incorrectly classifying an individual in the two and five cluster solutions respectively.
DISCUSSION
Our analyses suggest that there may be five sub-groups of patients with recently diagnosed PD: 1) mild motor and non-motor disease, 2) poor posture, gait, cognition, smell and postural hypotension, 3) severe tremor, 4) poor psychological well-being, RBD and sleep, and 5) severe motor, non-motor and cognitive disease, with poor psychological well-being. Our initial approach used a bottom-up data-driven approach to group together individuals with similar symptoms with little a priori assumptions. However, one limitation of using a purely data-driven approach is that the choice of variables and their breadth will partially determine what factors are identified i.e. a badly measured domain, even though clinically important, will appear statistically less informative than another for which several scales have been included. We therefore felt it important to supplement the factor analysis with a second stage approach where we added nine other domains that had not emerged from the factor analysis. This combined approach has advantages over simply using a priori assumptions about the importance of UPDRS tremor and non-tremor sub-items in defining such phenotypes [2].
Depending on which statistical approach we chose, we could have decided that the two cluster solution was more appropriate. However this solution only seemed to group people essentially as good or bad across a range of disease severity measures (motor, non-motor, psychological well-being and cognition- see Supplementary Figure 1). The five cluster solution allowed for disease severity measures to be preferentially affected, for example group 3) above who score poorly on tremor motor measures with relative sparing of non-tremor motor, cognitive and psychological well-being measures. This may be a more valid representation of the PD disease spectrum encountered in routine clinical practice. Interestingly, the five cluster solution might be more clinically relevant as the two cluster solution found no evidence of an association with drug responsiveness, (p = 0.13, see Supplementary Table 3) whilst the five cluster solution did find strong evidence of an association between cluster grouping and levodopa response (p = 0.0004).
One caveat for this study is that levodopa responsiveness was assessed using the clinician-rated Clinical Global Impression of Change Scale (CGI-C). This retrospective questionnaire involves the clinician asking the patient (and carer) about their overall impression of motor response to previously trialled dopaminergic medications. The CGI-C therefore, is likely to be a less accurate measure of true levodopa response when compared to formal levodopa challenge testing for example. While we have performed this in a patient subgroup, unfortunately overall numbers are small due to practical purposes, and insufficient to extend to the more general cluster model being presented here. Caveats aside, it is interesting to note that cluster 2 (which resembles PIGD with impaired postural and cognitive function) has a good CGI-C medication response similar to cluster 4, despite these subjects being older. One of the difficulties in interpreting these results is that this group also have the fewest number of drug naïve patients, possibly because their parkinsonian motor features are more severe and disabling than those with tremor-dominant disease. Hence this may be biasing the proportions in the CGI-C results if we assume that drug naïve would show excellent response had they been treated. In addition this may also reflect a “ceiling effect” whereby milder tremor-dominant patients despite showing drug responsiveness can only improve to a more moderate degree than those with more severe disease. Lastly, cluster 2 has a higher LEDD so may have had the opportunity to demonstrate a bigger drug response compared to other clusters. The higher LEDD may also reflect the more severe motoric symptoms (bradykinesia, rigidity, and gait imbalance) experienced by this group, which are likely to be stronger determinants of disability than tremor symptoms, hence driving up the increased overall treatment doses. Future work will focus on comparing the accuracy of GCI-C versus formal levodopa challenge in assessing medication response and predicting progression inearly PD.
At least two phenotypes defined in the current study, namely 4) poor psychological well-being, RBD and sleep and 5) severe motor, non-motor and cognitive disease with poor psychological well-being, would have been missed using conventional “top-down” PD classification models. These findings are novel and potentially of high clinical relevance, as they underline the importance of early non-motor symptoms such as RBD, anxiety, depression, apathy, pain and fatigue in underpinning the disease heterogeneity seen in early PD. To date, few studies using data-driven techniques have assessed the baseline importance of non-motor symptoms in such a large well-characterised incident PD cohort. This is particularly relevant given the increasingly acknowledged importance of non-motor symptoms over and above motor symptoms in determining patient-related quality of life and subsequent decline [17]. Symptoms such as RBD, which can manifest prior to the onset of motoric symptoms, are characterised pathologically by involvement of the locus coeruleus, subcoeruleus, pedunculopontine and serotonergic raphe nuclei [18].
The co-existence in group 5 of significantly worse scores in both motor and non-motor domains highlights the importance of the latter, and in particular psychological well-being which may or may not be secondary to a worse clinical evolution. This group had poor scores across both subjective and objective evaluations of motor, cognitive and other non-motor domains, thus excluding the possibility that they simply reflect a poor perception of personal well-being, which is a common occurrence in mood disorders such as anxiety and depression. Although every effort was made to exclude atypical Parkinsonism from our analysis, it is of course possible that a proportion of subjects in group 5 do not have PD but rather an atypical parkinsonian disorder such as multiple system atrophy or progressive supranuclear palsy. As we follow-up our subjects over the next 10 years, we will be able to determine if atypical features emerge in this subgroup and ultimately post-mortem pathological diagnosis should help clarify if they have a more rapidly progressive form of PD or atypical Parkinsonism.
Patients in group 4 scored particularly poorly on RBD measures, however function on motor and cognitive testing was good compared to other groups. This, together with the fact that RBD is a prodromal feature, which may have a 15-year latency before the emergence of motor symptoms [19] might suggest that RBD is a risk but not a prognostic marker for subsequent PD. Previous longitudinal studies have also shown that concomitant RBD was not associated with greater worsening of motor disability scores, cognition or depression, in patients with PD [20–22].
It is uncertain whether the phenotypic features of group 2, who are on average much older, merely reflect age-related co-morbidities such as poor posture, cognition, smell, postural hypotension, or are a distinct aetiological sub-group.
A recent study using principle component analysis [23] in a prevalent PD cohort found that a composite score of predominantly nondopaminergic (PND) features which are largely insensitive to dopaminergic medication (postural instability, gait difficulty, cognitive impairment, depressive symptoms, psychotic symptoms, excessive daytime somnolence and autonomic dysfunction) might provide a more accurate evaluation of disease severity and progression in PD. Our results support this finding and raise the important issue of how best to select patients for future disease-modifying or neuroprotective trials in PD.
If only certain sub-groups respond to a neuroprotective agent, existing trials are more likely to result in a false negative result and future trials will need far larger sample sizes to group according to baseline phenotype with concomitant cost implications. It is unclear as to whether the 12% of PD patients assigned to group 5, who appear severe across a range of motor and non-motor measures, should be selected as being the most likely to benefit from future disease modifying interventions, or might be least likely to benefit due to more advanced pathophysiology. Phenotypic differences seen across PD might therefore be a major contributing factor to the current lack of a convincing neuroprotective agent for this disease, despite multiple drug trials in this field.
Our results are consistent with several studies applying cluster methodology in PD [24–33] that found a milder disease group with a young age at onset, [25, 26, 28–33] a group with severe gait dysfunction and cognitive impairment [24, 27] and a tremor dominant group [28, 29, 31]. Most studies have found a rapid disease progression group with an older age at onset [25–32]. The relationship between cognitive function and impairments in gait, posture and non-tremor motor features in PD has been well documented in previous studies [34]. It seems that our finding of a group which has poor RBD, psychological well-being and sleepiness has not been found in previous studies, possibly because information about these features have not always been collected.
Although we argue against including age at onset in the cluster analysis we explored using it in our factor and cluster analysis as some of the previous studies have done [25, 27–29, 31, 32]. Including age at onset in the factor analysis would mean it loading on the non-tremor motor factor very weakly and hence would have made little difference to our estimated factor scores. If it was included at the cluster analysis stage we would have qualitatively found five groups of similar phenomenology.
These sub-groups have been derived from baseline visits, hence are not confounded by disease duration. Future evaluation will determine whether patients retain their initial clinical phenotype or whether changing from one clinical phenotype to another is an important marker of subsequent progression. We are currently undertaking an independent replication in collaboration with a second UK cohort (Tracking Parkinson’s Disease) which used a very similar methodology (90% of variables are the same).
We cannot yet draw firm conclusions as to the prognostic value of these clusters, but with further follow-up we will determine whether this classification is of greater value than existing approaches which discriminate patients based on simpler baseline measures. We will also test whether these clusters have biological or clinical utility by comparing data on genotypes, biomarkers, including neuroimaging as well as responsiveness to drug therapy, and the onset of clinically-meaningful end points, such as motor fluctuations, dyskinesias, dementia, dependency or institutionalisation and long-term mortality.
CONFLICT OF INTEREST
The authors have no conflict of interest to report.
ETHICS APPROVAL
Local NHS ethics committee.
ACKNOWLEDGMENTS
The authors would like to thank all subjects who have participated in this study. This study was funded by the Monument Trust Discovery Award from Parkinson’s UK and supported by the National Institute for Health Research (NIHR) Oxford Biomedical Research Centre based at Oxford University Hospitals NHS Trust and University of Oxford, and the NIHR Clinical Research Network: Thames Valley and South Midlands. The views expressed are those of the author(s) and not necessarily those of the NHS, the NIHR or the Department of Health.
Appendices
The supplementary tables and figures are available in the electronic version of this article: http://dx.doi.org/10.3233/JAD-140523.
REFERENCES
1 | Selikhova M, Williams DR, Kempster PA, Holton JL, Revesz T, Lees AJ (2009) A clinico-pathological study of subtypes in Parkinson’s disease Brain 132: 2947 2957 |
2 | Jankovic J, McDermott M, Carter J, Gauthier S, Goetz C, Golbe L, Huber S, Koller W, Olanow C, Shoulson I (1990) Variable expression of Parkinson’s disease: A base-line analysis of the DATATOP cohort. The Parkinson Study Group Neurology 40: 1529 1534 |
3 | Wickremaratchi MM, Knipe MDW, Sastry B, Morgan E, Jones A, Salmon R, Weiser R, Moran M, Davies D, Ebenezer L (2011) The motor phenotype of Parkinson’s disease in relation to age at onset Mov Disord 26: 457 463 |
4 | van Rooden SM, Heiser WJ, Kok JN, Verbaan D, van Hilten JJ, Marinus J (2010) The identification of Parkinson’s disease subtypes using cluster analysis: A systematic review Mov Disord 25: 969 978 |
5 | Szewczyk-Krolikowski K, Tomlinson P, Nithi K, Wade-Martins R, Talbot K, Ben-Shlomo Y, Hu M (2013) The influence of age and gender on motor and non-motor features of early Parkinson’s disease: Initial findings from the Oxford Parkinson Disease Center (OPDC) discovery cohort Parkinsonism Relat Disord 20: 99 105 |
6 | Rolinski M, Szewczyk-Krolikowski K, Tomlinson PR, Nithi K, Talbot K, Ben-Shlomo Y, Hu MT (2014) REM sleep behour disorder is associated with worse quality of life and other non-motor features in early Parkinson’s disease J Neurol Neurosurg Psychiatry 85: 560 566 avi |
7 | Tomlinson CL, Stowe R, Patel S, Rick C, Gray R, Clarke CE (2010) Systematic review of levodopa dose equivalency reporting in Parkinson’s disease Mov Disord 25: 2649 2653 |
8 | Schneider LS, Olin JT, Doody RS, Clark CM, Morris JC, Reisberg B, Schmitt FA, Grundman M, Thomas RG, Ferris SH (1997) Validity and reliability of the Alzheimer’s Disease cooperative study - Clinical global impression of change Alzheimer Dis Assoc Disord 11: S22 S32 |
9 | Tully PJ, Winefield HR, Baker RA, Turnbull DA, de Jonge P (2011) Confirmatory factor analysis of the Beck Depression Inventory-II and the association with cardiac morbidity and mortality after coronary revascularization J Health Psychol 16: 584 595 |
10 | Rubin DB (1976) Inference and missing data Biometrika 63: 581 590 |
11 | Hennig C, Liao TF (2013) How to find an appropriate clustering for mixed-type variables with application to socio-economic stratification J R Stat Soc Ser C Appl Stat 62: 309 369 |
12 | Hair JF (2010) Multivariate data analysis Prentice Hall Upper Saddle River, NJ |
13 | Caliński T, Harabasz J (1974) A dendrite method for cluster analysis Commun Stat Theory Methods 3: 1 27 |
14 | Duda RO, Hart PE, Stork DG (2001) Pattern Classification Wiley New York |
15 | Stebbins GT, Goetz CG, Burn DJ, Jankovic J, Khoo TK, Tilley BC (2013) How to identify tremor dominant and postural instability/gait difficulty groups with the movement disorder society unified Parkinson’s disease rating scale: Comparison with the unified Parkinson’s disease rating scale Mov Disord 28: 668 670 |
16 | Kenny DA, McCoach DB (2003) Effect of the number of variables on measures of fit in structural equation modeling Struct Equ Modeling 10: 333 351 |
17 | Martinez-Martin P, Rodriguez-Blazquez C, Kurtis MM, Chaudhuri K (2011) The impact of non-motor symptoms on health-related quality of life of patients with Parkinson’s disease Mov Disord 26: 399 406 |
18 | Braak H, Tredici KD, Rüb U, de Vos RA, Jansen Steur EN, Braak E (2003) Staging of brain pathology related to sporadic Parkinson’s disease Neurobiol Aging 24: 197 211 |
19 | Schenck CH, Boeve BF, Mahowald MW (2013) Delayed emergence of a parkinsonian disorder or dementia in 81% of older men initially diagnosed with idiopathic rapid eye movement sleep behavior disorder: A 16-year update on a previously reported series Sleep Med 14: 744 748 |
20 | Gjerstad MD, Boeve B, Wentzel-Larsen T, Aarsland D, Larsen JP (2008) Occurrence and clinical correlates of REM sleep behaviour disorder in patients with Parkinson’s disease over time J Neurol Neurosurg Psychiatry 79: 387 391 |
21 | Lavault S, Leu-Semenescu S, Tezenas du Montcel S, Cochen de Cock V, Vidailhet M, Arnulf I (2010) Does clinical rapid eye movement behavior disorder predict worse outcomes in Parkinson’s disease? J Neurol 257: 1154 1159 |
22 | Yoritaka A, Ohizumi H, Tanaka S, Hattori N (2009) Parkinson’s disease with and without REM sleep behaviour disorder: Are there any clinical differences? Eur Neurol 61: 164 170 |
23 | van der Heeden JF, Marinus J, Martinez-Martin P, van Hilten JJ (2014) Importance of nondopaminergic features in evaluating disease severity of Parkinson disease Neurology 82: 412 418 |
24 | Dujardin K, Defebvre L, Duhamel A, Lecouffe P, Rogelet P, Steinling M, Destee A (2004) Cognitive and SPECT characteristics predict progression of Parkinson’s disease in newly diagnosed patients J Neurol 251: 1383 1392 |
25 | Erro R, Vitale C, Amboni M, Picillo M, Moccia M, Longo K, Santangelo G, De Rosa A, Allocca R, Giordano F, Orefice G, De Michele G, Santoro L, Pellecchia MT, Barone P (2013) The heterogeneity of early Parkinson’s disease: A cluster analysis on newly diagnosed untreated patients PLoS One 8: e70244 |
26 | Gasparoli E, Delibori D, Polesello G, Santelli L, Ermani M, Battistin L, Bracco F (2002) Clinical predictors in Parkinson’s disease Neurol Sci 23: Suppl 2 S77 S78 |
27 | Graham JM, Sagar HJ (1999) A data-driven approach to the study of heterogeneity in idiopathic Parkinson’s disease: Identification of three distinct subtypes Mov Disord 14: 10 20 |
28 | Lewis SJ, Foltynie T, Blackwell AD, Robbins TW, Owen AM, Barker RA (2005) Heterogeneity of Parkinson’s disease in the early clinical stages using a data driven approach J Neurol Neurosurg Psychiatry 76: 343 348 |
29 | Liu P, Feng T, Wang YJ, Zhang X, Chen B (2011) Clinical heterogeneity in patients with early-stage Parkinson’s disease: A cluster analysis J Zhejiang Univ Sci B 12: 694 703 |
30 | Post B, Speelman JD, de Haan RJ, group CA-s (2008) Clinical heterogeneity in newly diagnosed Parkinson’s disease J Neurol 255: 716 722 |
31 | Reijnders JSAM, Ehrt U, Lousberg R, Aarsland D, Leentjens AFG (2009) The association between motor subtypes and psychopathology in Parkinson’s disease Parkinsonism Relat Disord 15: 379 382 |
32 | Schrag A, Quinn NP, Ben-Shlomo Y (2006) Heterogeneity of Parkinson’s disease J Neurol Neurosurg Psychiatry 77: 275 276 |
33 | van Rooden SM, Colas F, Martinez-Martin P, Visser M, Verbaan D, Marinus J, Chaudhuri RK, Kok JN, van Hilten JJ (2011) Clinical subtypes of Parkinson’s disease Mov Disord 26: 51 58 |
34 | Williams-Gray CH, Foltynie T, Brayne CE, Robbins TW, Barker RA (2007) Evolution of cognitive dysfunction in an incident Parkinson’s disease cohort Brain 130: 1787 1798 |
Figures and Tables
Fig.1
Flow chart of patient entry into study.
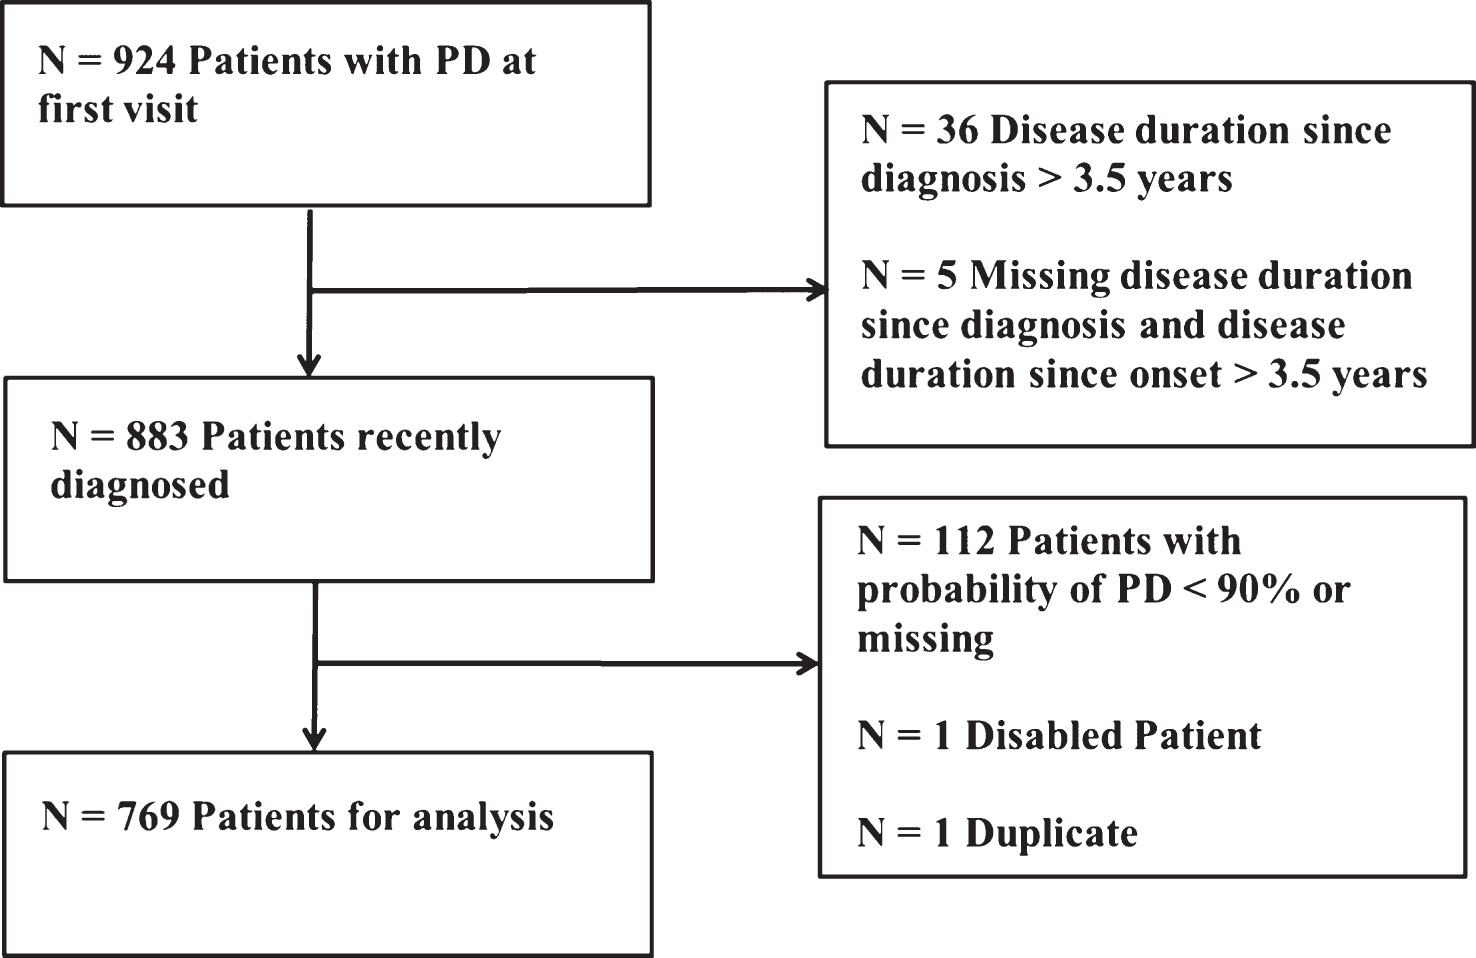
Fig.2
Within cluster means of the standardised variables for the 5 cluster solution. Positive is worse than average and negative better than average. For laterality positive is more bilateral than average and negative more unilateral than average.
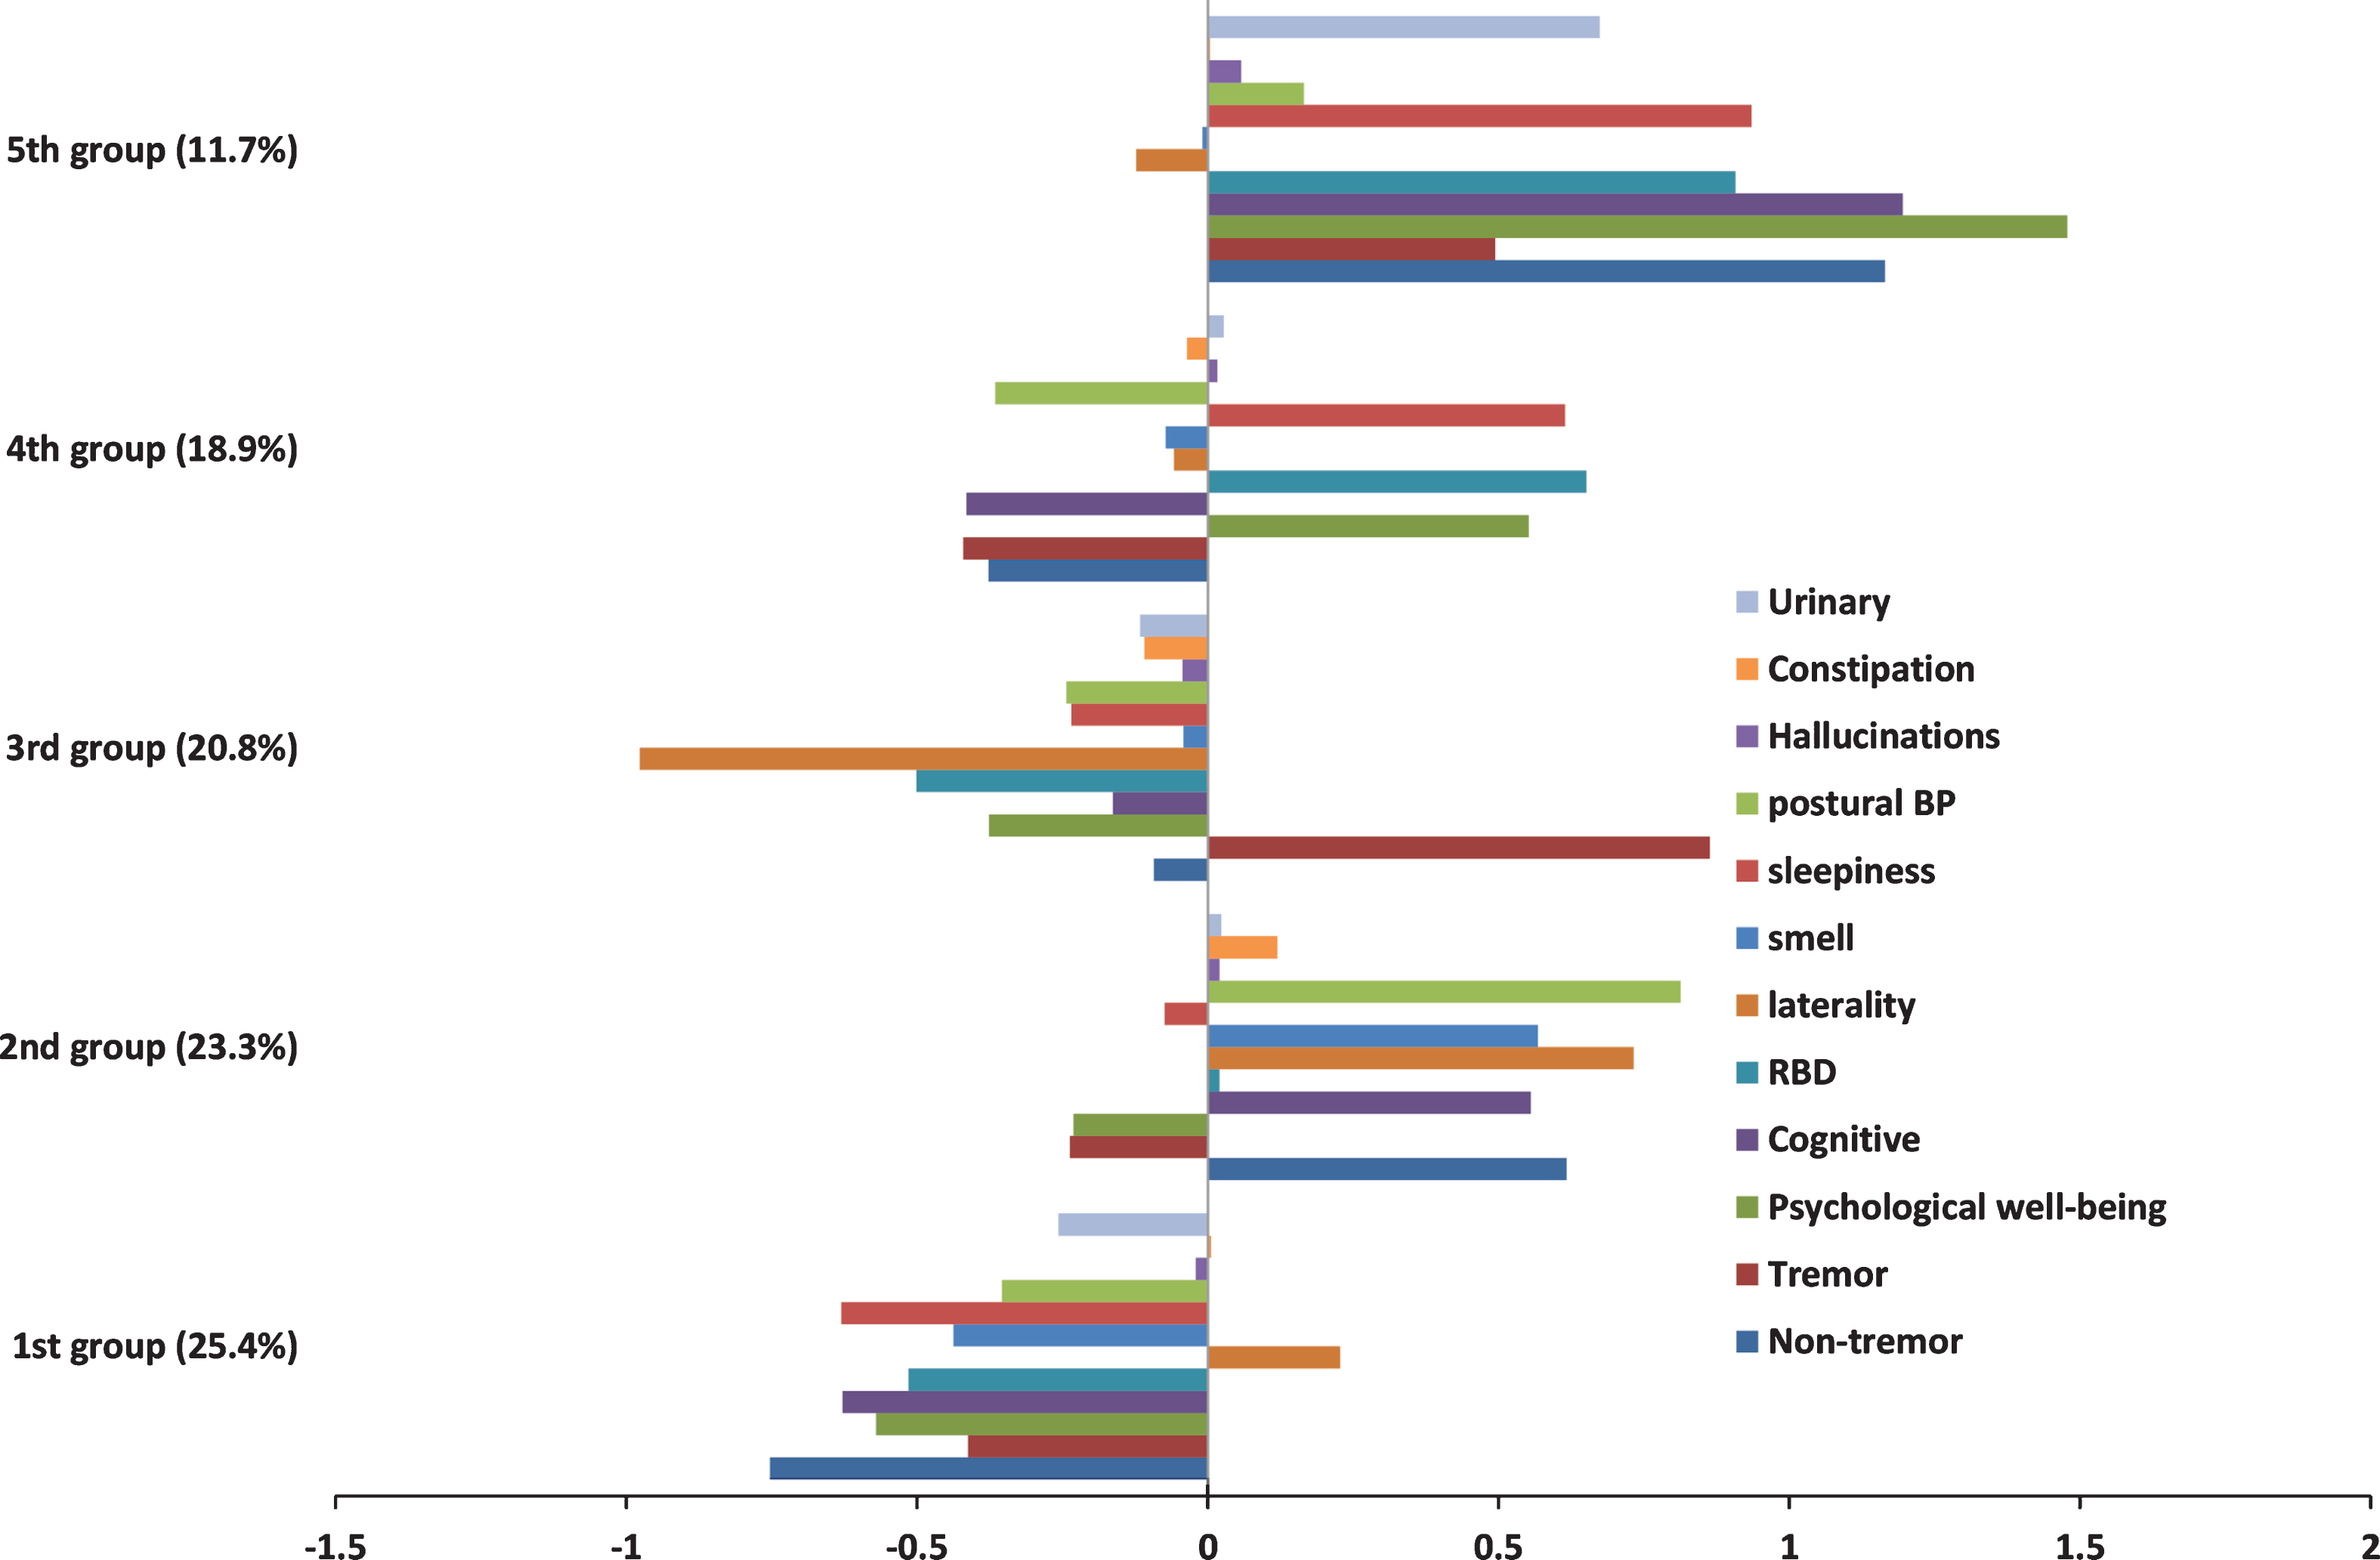
Table 1
Basic baseline descriptives of patients
| Variable | Observed N | Mean (sd; range) or n (%) |
| Female | 769 | 261 (33.9%) |
| Ethnicity (non-white) | 764 | 11 (1.4%) |
| Age onset (years) | 765 | 64.77 (9.74; 28.17–87.45) |
| Disease duration from onset (years) | 765 | 2.92 (1.86; 0.16–13.90) |
| Disease duration from diagnosis (years) | 765 | 1.32 (0.96; 0.01–3.50) |
| Delay from first motoric symptom onset to diagnosis (years) | 762 | 1.61 (1.64; 0–13.5) |
| MDS-UPDRS part Ia | 759 | 8.62 (5.16; 0–33) |
| MDS-UPDRS part IIa | 763 | 8.67 (6.13; 0–35) |
| MDS-UPDRS part IIIa | 768 | 26.33 (11.00; 5–77) |
| MDS-UPDRS part IVa | 767 | 0.26 (0.97; 0–11) |
| MDS-UPDRS total (parts I+II+III+IV)a | 758 | 43.87 (17.85; 7–123) |
| MOCA (adjusted for education years)a | 764 | 24.98 (3.36; 13–30) |
| Untreated | 766 | 97 (12.7%) |
| Levodopa equivalent daily dose (mg) | 762 | 284.38 (212.83; 0–1267.5) |
| Hoehn and Yahr: median (IQRb); mean (range) | 768 | 2 (2-2); 1.84 (1–3) |
aChanged denominator where 80% or more of questions were answered. bInter-quartile range. Motor assessments (UPDRS and Hoehn and Yahr) were rated in the clinically-defined ‘on medication’ state for treated PD patients.
Table 2
Confirmatory factor analysis standardised factor loadings of variables selected from exploratory factor analysis
| Variable | Factor 1 psychological well-being | Factor 2 Non-tremor motor | Factor 3 cognitive |
| UPDRS apathy | 0.581 | ||
| UPDRS fatigue | 0.675 | ||
| UPDRS pain | 0.589 | ||
| BFI –neuroticism | 0.529 | ||
| Leeds anxiety | 0.718 | ||
| Leeds depression | 0.756 | ||
| BDI | 0.850 | ||
| QUIP | 0.353 | ||
| UPDRS speech | 0.452 | ||
| UPDRS rigidity | 0.429 | ||
| UPDRS bradykinesia | 0.560 | ||
| UPDRS postural | 0.721 | ||
| Purdue peg board | −0.662 | ||
| Purdue assembly task | −0.656 | ||
| Get go | 0.757 | ||
| Flamingo | 0.600 | ||
| MOCA | 0.778 | ||
| MMSE | 0.593 | ||
| Phenomic fluency | 0.622 | ||
| Semantic fluency | 0.727 | ||
| CFI = 0.786 | |||
| TLI = 0.875 | |||
| RMSEA = 0.082 |
CFI = Comparative Fit Index, TLI = Tucker-Lewis Index, and RMSEA = Root Mean Square Error of Approximation. CFI, TLI and RMSEA are all measures of model fit.
Table 3
Association of clusters with variables not included within the cluster analysis, along with a p-value derived from a hypothesis test that the variable is equally distributed (i.e. same mean or same proportion) amongst the five clusters. Note that these variables were derived from the complete case and there was some missingness associated with these variables
| Variable (Hypothesis test statistic; p-value) | Total | Cluster 1 | Cluster 2 | Cluster 3 | Cluster 4 | Cluster 5 |
| (N = 769) | (N = 195, | (N = 179, | (N = 160, | (N = 145, | (N = 90, | |
| 25.4%) | 23.3%) | 20.8%) | 18.9%) | 11.7%) | ||
| Femalea (12.1; p = 0.0166) | 261 (33.9%) | 82 (42.1%) | 45 (25.1%) | 56 (35.0%) | 49 (33.8%) | 29 (32.2%) |
| Disease duration from onsetb (2.5; p = 0.0423) | 2.9 (1.9) | 2.7 (1.6) | 2.8 (1.7) | 3.0 (1.9) | 3.1 (2.0) | 3.3 (2.2) |
| Disease duration from diagnosisb (3.7; p = 0.0052) | 1.3 (1.0) | 1.1 (0.9) | 1.4 (1.0) | 1.3 (1.0) | 1.5 (1.0) | 1.4 (0.9) |
| Age onsetb (30.0; p < 0.0001) | 64.8 (9.7) | 61.8 (8.7) | 70.4 (7.7) | 64.2 (9.7) | 61.0 (9.3) | 67.1 (10.8) |
| Age onset <50a (18.6; p = 0.0009) | 60 (7.8%) | 20 (10.3%) | 3 (1.7%) | 16 (10.0%) | 18 (12.5%) | 3 (3.4%) |
| UPDRS motor phenotypea (104; p < 0.0001) | ||||||
| Tremor dominant | 407 (53.8%) | 118 (61.5%) | 65 (37.1%) | 132 (83.5%) | 58 (40.6%) | 34 (38.6%) |
| Indeterminate | 95 (12.6%) | 22 (11.5%) | 24 (13.7%) | 12 (7.6%) | 25 (17.5%) | 12 (13.6%) |
| Postural instability gait difficulty | 254 (33.6%) | 52 (27.1%) | 86 (49.1%) | 14 (8.9%) | 60 (42.0%) | 42 (47.7%) |
| [Clinician global impression of change (CGI-C)]a (35.4; p = 0.0004) | ||||||
| Much or very much improved | 354 (48.7%) | 83 (46.1%) | 96 (55.5%) | 59 (39.6%) | 77 (55.8%) | 39 (44.8%) |
| Minimally improved | 188 (25.9%) | 49 (27.2%) | 42 (24.3%) | 34 (22.8%) | 34 (24.6%) | 29 (33.3%) |
| No change to much worse | 124 (17.1%) | 25 (13.9%) | 29 (16.8%) | 34 (22.8%) | 19 (13.8%) | 17 (19.5%) |
| No medication tried | 61 (8.4%) | 23 (12.8%) | 6 (3.5%) | 22 (14.8%) | 8 (5.8%) | 2 (2.3%) |
| Drug naívea (21.7; p = 0.0002) | 97 (12.7%) | 37 (19.1%) | 14 (7.8%) | 29 (18.2%) | 11 (7.6%) | 6 (6.7%) |
| LEDD totalb (11.3; p < 0.0001) | 284.4 (212.8) | 229.1 (191.8) | 314.8 (186.5) | 236.4 (214.8) | 357.5 (251.1) | 310.2 (185.7) |
| LEDD total on medicationbc (6.0; p = 0.0001) | 328.8 (194.3) | 287.5 (171.3) | 341.7 (168.9) | 295.9 (200.2) | 387.1 (238.2) | 336.7 (168.6) |
aChi-squared test. bAnova. cThe LEDD restricted to those who are taking dopaminergic medication.

