Article Text

Abstract
OBJECTIVES To determine the sensitivity, specificity, and positive predictive values of a selection of abnormal findings in the putamen and infratentorial structures on routine magnetic resonance imaging for distinguishing between multiple system atrophy, idiopathic Parkinson’s disease, and age matched controls.
PATIENTS AND METHODS Two neuroradiologists blindly and independently rated axial T2 weighted and proton density MRI of 44 patients with multiple system atrophy, 47 patients with idiopathic Parkinson’s disease, and 45 controls. High field (1.5 T) scans were available in 16 patients with multiple system atrophy, 15 patients with idiopathic Parkinson’s disease, and 16 controls. All other patients had 0.5 T scans.
RESULTS On both 0.5 and 1.5 T scans the following items had high specificity but low sensitivity: putaminal atrophy, a hyperintense putaminal rim, and infratentorial signal change. Finding any infratentorial abnormality gave higher sensitivity but lower specificity. Putaminal isointensity or hypointensity relative to globus pallidus, absolute putaminal hypointensity, and altered size of the olives were not useful discriminators. The overall sensitivity was 73% on 0.5 T and 88% on 1.5 T scans. The specificities of these findings for multiple system atrophy in comparison to idiopathic Parkinson’s disease and controls on 0.5 T were 95% and 100% respectively, and on 1.5 T were 93% and 91% respectively. Finding any of the described abnormalities on MRI gave a positive predictive value of 93% on the 0.5 T machine, and 85% on the 1.5 T scanner.
- multiple system atrophy
- magnetic resonance imaging
- diagnosis
Statistics from Altmetric.com
Multiple system atrophy is a degenerative disorder which involves to varying degrees the basal ganglia and the olivopontocerebellar system. A definite diagnosis is only possible at necropsy when cell loss and gliosis as well as glial cytoplasmic inclusions are found in the affected structures. Diagnosis in life is often difficult, especially in early stages of the disease, and differentiation from idiopathic Parkinson’s disease carries a high rate of misdiagnosis.1
Brain MRI may often disclose abnormalities of the putamen or infratentorial structures in multiple system atrophy, and it has been suggested that these findings may help to differentiate between multiple system atrophy and idiopathic Parkinson’s disease.2-6 Hypointensity of the putamen, especially in the posterior and lateral part, which equals or exceeds that of the globus pallidus on T2 weighted images on 1.5 T MRI, was first described in atypical and poorly levodopa responsive parkinsonism.2 3 5 7 8 However, there has been considerable overlap reported between individual patients with multiple system atrophy, idiopathic Parkinson’s disease, and control patients.4 9
Other abnormal putaminal findings reported in atypical parkinsonism and multiple system atrophy are the presence of putaminal atrophy on T2 weighted and proton density images4 6 8 10 11 and a hyperintense rim at the lateral putaminal edge, often accompanied by putaminal hypointensity.3 12 Testa et al 13 also described putaminal hyperintensity on T2 weighted 0.5 T scans which corresponded to putaminal hypointensity on 1.5 T images in patients with multiple system atrophy.13
Infratentorial atrophy may be seen on CT in multiple system atrophy, but in such cases cerebellar symptoms and signs are usually already clinically evident, so that this imaging abnormality does not itself additionally contribute to making a diagnosis.14 Using T2 weighted MRI, Savoiardo et al described hyperintensities in the pons, middle cerebellar peduncles, and cerebellum, corresponding to pontocerebellar tract atrophy, among a mixed group of patients with olivopontocerebellar atrophy including patients with multiple system atrophy.3 Schulzet al also reported hyperintensities in the pons and middle cerebellar peduncles in patients with multiple system atrophy as well as atrophy of the middle cerebellar peduncles, brainstem, and cerebellum, which were not seen in their patients with idiopathic Parkinson’s disease.4
However, the specificity and sensitivity of these putaminal and infratentorial abnormalities on routine MRI are unknown. In this study we therefore determined the sensitivity, specificity, and positive predictive value (PPV) of these findings in patients with multiple system atrophy in comparison with age matched patients with idiopathic Parkinson’s disease and normal controls.
Methods
SUBJECTS
We studied 44 patients with clinically probable multiple system atrophy, diagnosed according to criteria15 that do not incorporate, and are not influenced by, MRI findings, except when they point to an alternative diagnosis (table 1). Twenty eight were parkinsonism predominant (striatonigral degeneration (SND) type, MSA-p) and 16 were cerebellar predominant (olivopontocerebellar atrophy (OPCA) type, MSA-c). We also studied 47 patients with clinically diagnosed idiopathic Parkinson’s disease and 45 age matched subjects without clinical suspicion of parkinsonism or multiple system atrophy. Mean age was not significantly different between the groups, but duration of disease was longer in idiopathic Parkinson’s disease. Table 2 gives the demographic data on all subjects.
Multiple system atrophy: diagnostic criteria
Patient characteristics
MRI EVALUATION
All patients had axial T2 weighted and proton density scans. Twenty eight patients with multiple system atrophy, 32 with idiopathic Parkinson’s disease, and 29 control subjects were examined on a 0.5 Tesla (T) Vectra scanner (General Electric Medical systems, Milwaukee, USA) and 16 patients with multiple system atrophy, 15 with idiopathic Parkinson’s disease, and 16 control subjects on a 1.5 T Signa scanner (General Electric Medical systems, Milwaukee). On the 0.5 T scanner TR was 2400 to 3000 ms, TE 23 to 35 and 90 to 92 ms, slice thickness 6 mm and interslice gap 0.2 to 2 mm. On the 1.5 T scanner TR was 2800 to 4000 ms, TE 20 to 39 and 90 to 100 ms, slice thickness 5 mm, and interslice gap 1.5 to 2 mm. Two experienced neuroradiologists rated all the scans blindly and independently. The parameters evaluated for each side were the presence of lateral margination of the putamen (hyperintense or isointense to cortical signal), putaminal atrophy, putaminal signal relative to that of the globus pallidus (hyperintense, isointense, or hypointense in posterior, middle, and anterior putamen), and in comparison to cortical signal (absolute signal intensity). The infratentorial items evaluated were the presence of atrophy or signal change in the pons, middle cerebellar peduncles, and cerebellum, and atrophy of midbrain and olives. Visual rating was preferred to volumetric measurements as these were considered invalid in this retrospective study with varying slice positions, and furthermore are not in routine use.
STATISTICAL ANALYSIS
Statistical comparison was performed with the χ2test and Fisher’s exact test. Interrater reliability was calculated with Cohen’s κ (< 0.20 slight agreement to 0.81–1.00 excellent agreement).16 Comparison of means was performed with thet test for independent samples. Statistical comparison of each item between all three groups was performed separately for each rater and for the average of both raters’ findings, separately for 0.5 T and 1.5 T scans.
Results
INTERRATER RELIABILITY
Between rater reliability was excellent for atrophy of the middle cerebellar peduncles (0.95), cerebellar atrophy (0.94), hyperintensity of middle cerebellar peduncles (0.88), putaminal isointensity relative to globus pallidus (0.81), and substantial for absolute putaminal hypointensity (0.77), hyperintensity of transverse pontine fibres (0.77), hyperintensity of cerebellum (0.72), hyperintense rim (0.66), pontine atrophy (0.65), relative putaminal hypointensity (0.65), putaminal atrophy (0.65), and midbrain atrophy (0.65); it was moderate for the isointense rim (0.47), and only fair for putaminal hyperintensity (0.24).
PUTAMINAL FINDINGS
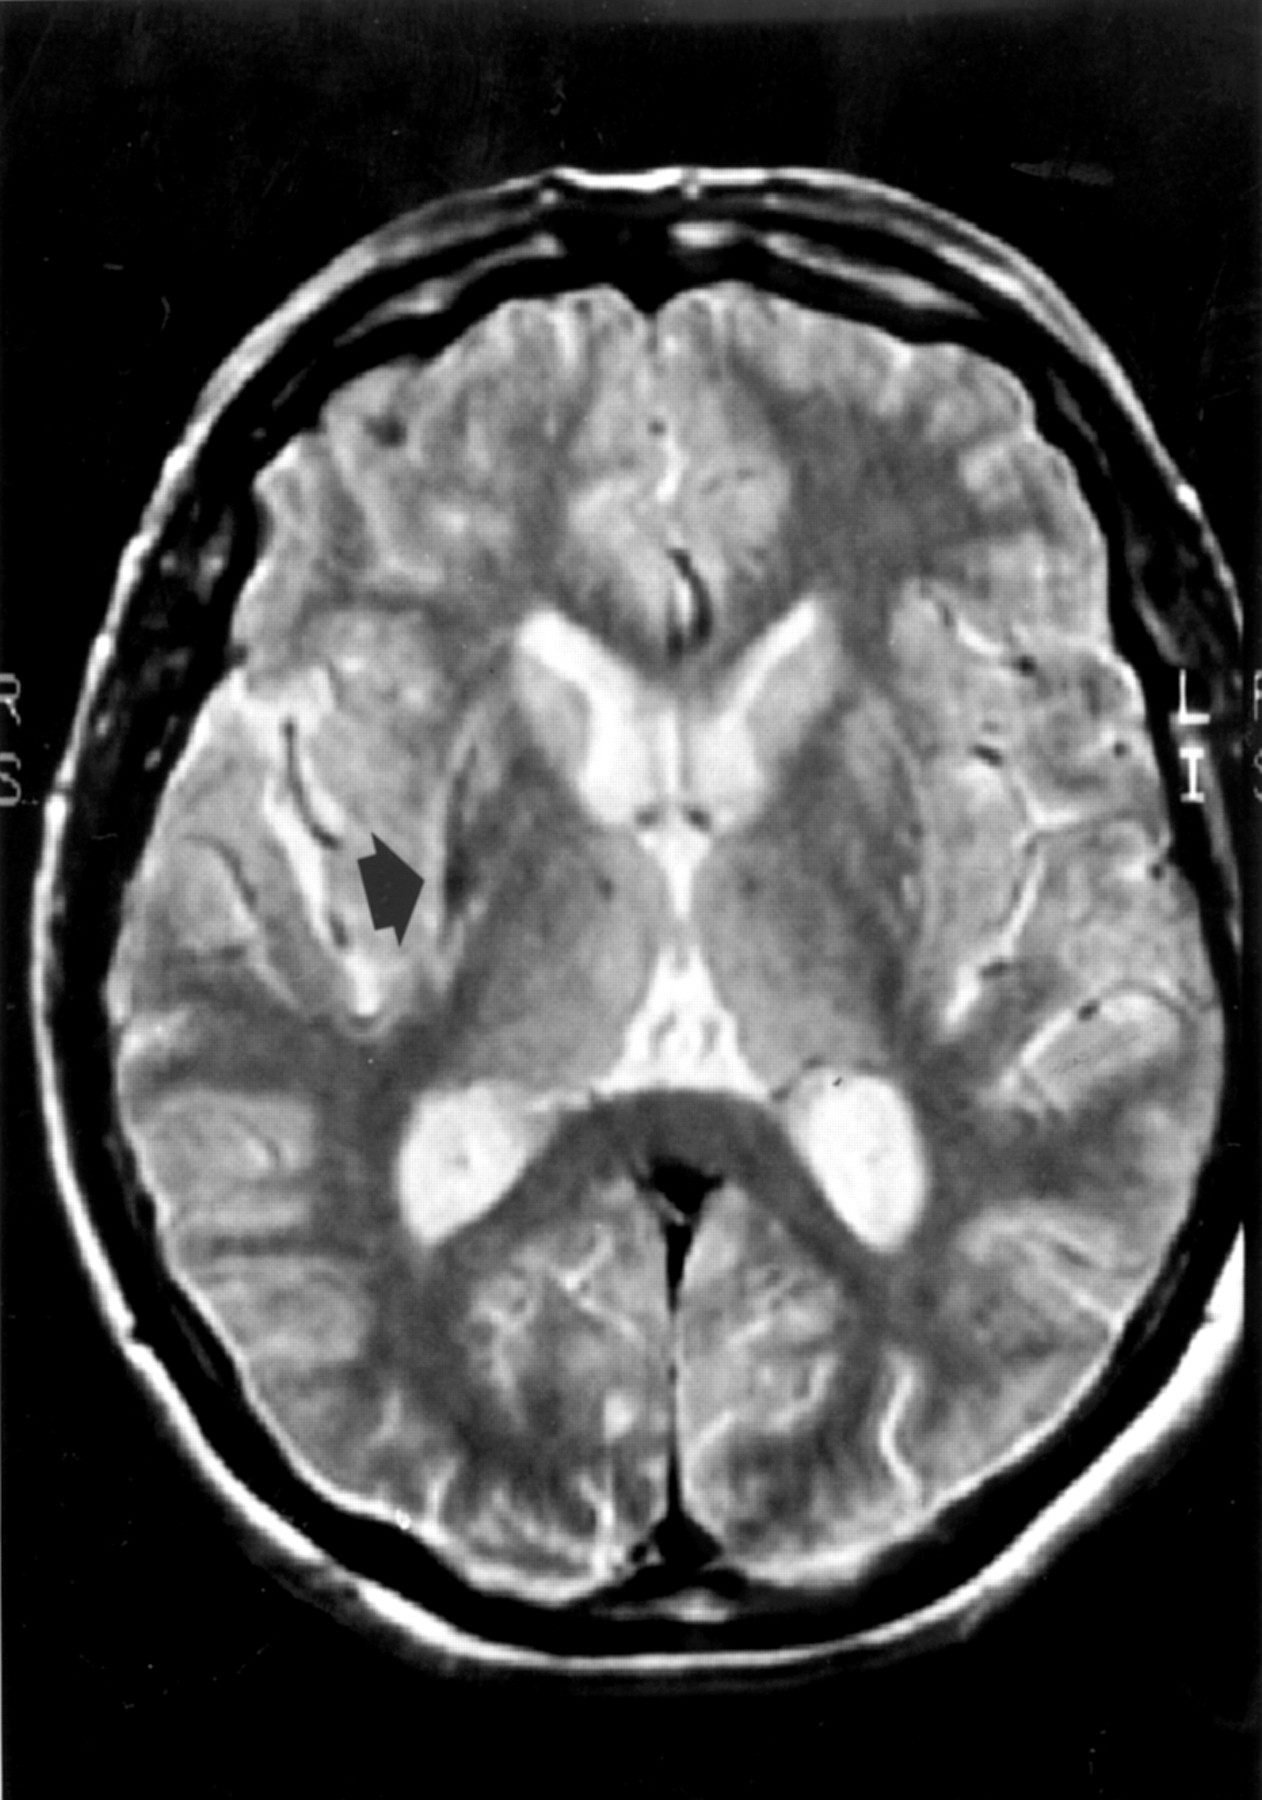
Putaminal findings (fig 1) that occurred significantly more often in patients with multiple system atrophy than controls and patients with idiopathic Parkinson’s disease, and were also exclusively seen in patients with multiple system atrophy, were a hyperintense rim at the lateral putaminal edge (30% of patients with multiple system atrophy on 0.5 and 41% on 1.5 T scans), putaminal atrophy (significant only on 0.5 T scans with 16%), and putaminal hyperintensity (seen only on 0.5 T scans, 23%). Relative putaminal hypointensity on 1.5 T scans tended to be more frequent in patients with multiple system atrophy (28.1%v 6.7% and 3.1% in patients with idiopathic Parkinson’s disease and control subjects, respectively), but this difference was not significant. Nor was the difference significant even if relative hypointensity of the putamen extending beyond its posterior part was compared between the groups. Putaminal isointensity relative to the globus pallidus was significantly more frequent in patients with multiple system atrophy than in patients with idiopathic Parkinson’s disease only on 0.5 T with one rater (CP). No significant difference was found for the presence of a margination of the putamen which did not exceed cortical signal and for absolute putaminal hypointensity.

Putaminal atrophy, hyperintense rim (arrow), and putaminal hypointensity in comparison with the globus pallidus on T2 weighted images (1.5 T) in a patient with multiple system atrophy.
INFRATENTORIAL ABNORMALITIES
Infratentorial abnormalities that occurred significantly more often in patients with multiple system atrophy were atrophy of the cerebellum (64% of patients with multiple system atrophy on 0.5 T and 66% on 1.5 T scans), middle cerebellar peduncles (59% and 47%), pons (52% and 38%) and midbrain (only significant on 0.5 T, 16% and 9%), and signal change of pons (30% and 31%), and middle cerebellar peduncles (only significant on 0.5 T, 13% and 22%). Consistent cerebellar signal change was seen only in patients with multiple system atrophy (11% and 16%) but did not reach significance versus the other groups. Change of size of the olives was unhelpful.
Infratentorial signal changes had characteristic appearances. The pontine hyperintensity was cruciform resembling a “hot cross bun” (fig 2), whereas those of the middle cerebellar peduncles and the cerebellar hemispheres were diffuse (fig 3). Hyperintensities of the middle cerebellar peduncles were usually much more pronounced than cerebellar hyperintensities, but both were often difficult to assess because of commonly coexisting atrophy and hence partial volume effect. Infratentorial signal changes were not seen without coexisting infratentorial atrophy, and were more easily appreciated on the proton density weighted images.

T2 weighted images (0.5 T) in a patient with pathologically proved multiple system atrophy showing infratentorial atrophy and signal change in pons (cross sign, arrow) resembling a hot cross bun (inset) baked for the last Thursday before Easter.

Infratentorial atrophy and signal change in the pons, middle cerebellar peduncles (arrow) and cerebellum on T2 weighted images (0.5 T) in a patient with multiple system atrophy.
The individual putaminal or infratentorial abnormalities were mostly associated within each area, but the groups of putaminal and infratentorial abnormalities were not associated with each other. There was no significant difference between patients with idiopathic Parkinson’s disease and control subjects in any item.
SENSITIVITY, SPECIFICITY, AND POSITIVE PREDICTIVE VALUE
Tables 3 and 4 show the results for sensitivity (proportion of patients with multiple system atrophy with abnormal MRI findings), specificity (proportion of patients with idiopathic Parkinson’s disease or controls with normal MRI parameters), and positive predictive value (likelihood of a person with an abnormal MRI finding to have multiple system atrophy) of putaminal and infratentorial abnormalities. This analysis included only findings that were significantly more common in patients with multiple system atrophy—that is, putaminal atrophy, hyperintense rim, and any infratentorial abnormality. The finding of putaminal hyperintensity was not included in the analysis as it was considered that the interrater reliability was too poor for this item to be included as a useful parameter. The sensitivity of MRI to disclose any of these particular abnormalities in multiple system atrophy was 73% on 0.5 T scans and 87.5% on 1.5 T scans in this series. The specificity of the method to differentiate between multiple system atrophy and idiopathic Parkinson’s disease was 95.3% on 0.5 T and 93.3% on 1.5 T scans, and to differentiate between multiple system atrophy and controls 100% and 90.6%, respectively. As putaminal hyperintensity was rarely an isolated abnormal finding, its inclusion or exclusion had no effect on sensitivity, specificity, and positive predictive value. Putaminal abnormalities were seen with a sensitivity of 36% on 0.5 and 50% on 1.5 T scans, and the positive predictive value was 100% for putaminal abnormalities on both machines. The sensitivity for infratentorial abnormalities was 66% and 72%, and the positive predictive value of these findings was 93% on 0.5 T, and 82% (compared with idiopathic Parkinson’s disease and controls) and 92% (compared with idiopathic Parkinson’s disease only) on 1.5 T.
Abnormal findings on 0.5 and 1.5 tesla MRI in idiopathic Parkinson’s disease (IPD), control, and multiple system atrophy (MSA) patients (average of rater 1 and rater 2)
Abnormal findings on 0.5 and 1.5 tesla MRI in idiopathic Parkinson’s disease (IPD), control, and multiple system atrophy (MSA) patients (average of rater 1 and rater 2)
Generally, on 1.5 T scans sensitivity was higher and specificity lower than on 0.5 T scans. A direct comparison of both methods was not possible as no patient had both investigations.
CLINICAL CORRELATION IN THE MSA GROUP
MRI findings in relation to clinical features
There was a significant correlation between the presence of ataxia and infratentorial abnormalities (p<0.001), but not with putaminal changes. There was no significant correlation of parkinsonism with the presence of either putaminal or infratentorial abnormalities. Autonomic failure, falls, response to levodopa, and pyramidal signs were not significantly correlated with any MRI abnormalities.
Out of the 28 patients with SND type multiple system atrophy 15 (54%) had infratentorial abnormalities and 15 (54%) putaminal changes. All of the 16 patients with OPCA type multiple system atrophy had infratentorial abnormalities and five (31%) also had putaminal changes.
Presence of parkinsonism (38 patients)—Twenty nine per cent of patients had normal MRI, 42% had putaminal abnormalities, 58% infratentorial abnormalities, and 29% had abnormalities in both areas.
Presence of cerebellar signs (27 patients)—No patient had normal MRI, 44% had putaminal abnormalities, 93% had infratentorial abnormalities, and 37% had abnormalities in both areas.
Presence of autonomic failure (43 patients)—Twenty three per cent of patients had normal MRI, 43% had putaminal abnormalities, 69% had infratentorial abnormalities, 35% had abnormalities in both areas.
Clinical features in relation to MRI findings
Putaminal abnormalities (19 patients)—ninety seven per cent of these patients had parkinsonism, 74% cerebellar ataxia, 97% autonomic failure, and 47% pyramidal signs.
Infratentorial abnormalities (30 patients)—Eighty per cent of patients had parkinsonism, 85% cerebellar ataxia, 100% autonomic failure, and 43% pyramidal signs.
No abnormalities on MRI—In four patients with SND type multiple system atrophy without cerebellar signs only one rater found any abnormality. None of the further seven patients in whom neither rater found an abnormality (six 0.5 and one 1.5 T scan) had cerebellar signs clinically, and three (43%) of them had predominant autonomic failure with mild parkinsonism, whereas only three (8%) of those with abnormal MRI had predominant autonomic failure (p<0.05). Duration of disease and response to levodopa did not discriminate between those patients with multiple system atrophy with normal and those with abnormal MRI.
PATHOLOGICAL CORRELATION
In one patient with multiple system atrophy who died aged 60, after four years of disease the diagnosis was confirmed at necropsy. He had SND type multiple system atrophy with a poor response to levodopa, autonomic failure, and frequent falls, and had additional pyramidal signs as well as limb ataxia at the time of the investigation 11 months before death. His 0.5 T MRI disclosed putaminal atrophy, a hyperintense rim at the lateral putaminal edges bilaterally, and putaminal hyperintensity, as well as cerebellar, midbrain, peduncular, and pontine atrophy, and signal change in pons and middle cerebellar peduncles (fig 3).
Macroscopic pathological examination disclosed considerable atrophy of the basis pontis and cerebellum. The putamen was shrunken with brown discolouration and there was little pigment remaining in either substantia nigra or locus coeruleus. Light microscopy disclosed widespread glial cytoplasmic inclusions. The putamen showed degeneration with severe depletion of neurons, astrogliosis, and rarefication of the neutropil, more pronounced laterally than medially, and slight increase of pigment. Gliosis extended to involve the external and internal segments of the globus pallidus, whereas the caudate was relatively spared. The brainstem showed few remaining pigmented neurons in the substantia nigra and locus coeruleus. Pontine neurons and myelinated transverse pontocerebellar fibres were severely depleted, resulting in pallor and considerable atrophy of the basis pontis and middle cerebellar peduncles. The fibres of the corticospinal tract, which run craniocaudally in the dorsal pons, the pontine tegmentum, and the superior cerebellar peduncles ventrally, were all preserved, this differential involvement therefore being responsible for the cruciform appearance on MRI. The inferior olive was heavily gliotic with few remaining neurons and collapse of the olivary hilum. The cerebellar hemispheres and vermis were equally severely affected throughout, with marked atrophy of the cerebellar folia, Purkinje cell depletion, and reduced folial and hemispheric white matter. Appearances were characteristic of multiple system atrophy with OPCA and SND.
Discussion
In general, specificity and positive predictive value of MRI findings in multiple system atrophy were very high on both 0.5 and 1.5 T scans. On the other hand, sensitivity was low for individual parameters, but became high for SND type and OPCA type multiple system atrophy on 1.5 T scans, as well as for OPCA type multiple system atrophy on 1.5 T scans if any of the abnormal parameters was found. However, sensitivity for SND type multiple system atrophy was only moderate on 0.5 T scans. 1.5 T scans were generally slightly more sensitive but less specific than 0.5 T images. Hyperintense putaminal rim and putaminal atrophy on 0.5 and 1.5 T, and putaminal hyperintensity on 0.5 T scans, were only found in patients with multiple system atrophy and in none of the patients with idiopathic Parkinson’s disease or control subjects (positive predictive value of 100%). However, these abnormalities were only present in a minority of patients with multiple system atrophy, and are therefore not very sensitive markers. On the other hand, by contrast with reports of other groups, we found that relative putaminal hypointensity on 1.5 T was not a useful discriminator between patients with multiple system atrophy and those with idiopathic Parkinson’s disease, or controls, as the difference between the groups did not reach significance (although this may be partly due to the small number of patients in the 1.5 T group).
Infratentorial signal change was also a very specific marker (only seen in one control patient by one rater), but of limited sensitivity. However, when considered in combination with infratentorial atrophy the sensitivity of infratentorial abnormalities was much higher but specificity lower. Atrophy of the middle cerebellar peduncles was not seen in patients with idiopathic Parkinson’s disease or controls, but was frequent in patients with multiple system atrophy, and so may be the single most useful marker to differentiate between the two diseases. When any infratentorial or basal ganglia abnormality is seen, the sensitivity of the method is 73% on 0.5 T and 88% on 1.5 T scans. However, a substantial minority of all the patients with multiple system atrophy (27% at 0.5 T and 12% at 1.5 T) and even more of the patients with SND type MSA (44% and 18%) had entirely normal MRI despite fulfilling diagnostic criteria for clinically probable multiple system atrophy.
In our only necropsied case MRI atrophy and hyperintensities in the pons and middle cerebellar peduncles correlated with degeneration of pontine nuclei and afferent pontocerebellar fibres. There was no putaminal hypointensity on 0.5 T, but there was atrophy and hyperintensity of the entire putamen, especially at the lateral edge. This correlated with severe neuronal loss and gliosis, more marked in the lateral than medial putamen, and only a slight increase of pigment in macrophages and free in the neuropil in the putamen.
We did not compare our findings in multiple system atrophy with those in other types of cerebellar ataxia, so that the specificity of the infratentorial abnormalities on MRI in relation to other cerebellar degenerations remains unknown. However, these infratentorial findings—in particular signal change or atrophy of middle cerebellar peduncles, midbrain, and pons—are highly specific pointers in favour of multiple system atrophy as opposed to idiopathic Parkinson’s disease.
The patients with multiple system atrophy in this series already had symptoms and signs sufficient to allow a diagnosis of clinically probable multiple system atrophy at the time of the MRI. The sensitivity of the method may be lower earlier in the disease course. Although we used published diagnostic criteria, it is possible that some of our patients may have been misdiagnosed as in only one patient was the diagnosis confirmed at postmortem. However, thus far, out of 15 of our own patients with clinically probable multiple system atrophy who have come to necropsy, only one (with idiopathic Parkinson’s disease) proved to have a false positive diagnosis.
Conclusion
The specificity of the combined infratentorial and putaminal abnormal findings in this series approached 100% for 0.5 T, and was between 90 and 100% for 1.5 T scans. However, the sensitivity of these findings was limited, as a sizeable minority of patients with SND type multiple system atrophy had no abnormality on MRI, although the diagnosis could be made clinically. We therefore conclude that, when specific changes are seen, MRI is useful to support a diagnosis of multiple system atrophy versus one of idiopathic Parkinson’s disease. However, the absence of any of these changes in patients with SND type multiple system atrophy does not exclude the diagnosis of multiple system atrophy.
Acknowledgments
We thank Dr Yoav Ben-Shlomo for his helpful review of this paper.