Article Text

Abstract
Objectives To present methods and baseline results for an online screening tool to identify increased risk for Parkinson's disease (PD) in the UK population.
Methods Risk estimates for future PD were derived from the results of a systematic review of risk factors and early features of PD. Participants aged 60–80 years without PD were recruited by self-referral. They completed an online survey (including family history, non-motor symptoms and lifestyle factors), a keyboard-tapping task and the University of Pennsylvania Smell Identification Test. Risk scores were calculated based on survey answers. Preliminary support for the validity of this algorithm was assessed by comparing those estimated to be higher risk for PD with those at lower risk using proxies, including smell loss, REM-sleep behaviour disorder and reduced tapping speed, and by assessing associations in the whole group.
Results 1324 eligible participants completed the survey and 1146 undertook the keyboard-tapping task. Smell tests were sent to 1065 participants. Comparing the 100 highest-risk participants and 100 lowest-risk participants, median University of Pennsylvania Smell Identification Test scores were 30/40 versus 33/40 (p<0.001), mean number of key taps in 30 s were 55 versus 58 (p=0.045), and 24% versus 10% scored above cut-off for REM-sleep behaviour disorder (p=0.008). Regression analyses showed increasing risk scores were associated with worse scores in the three proxies across the whole group (p≤0.001).
Conclusions PREDICT-PD is the first study to systematically combine risk factors for PD in the general population. Validity to predict risk of PD will be tested through longitudinal follow-up of incident PD diagnosis.
- Parkinson×s Disease
- Smell
- Sleep Disorders
- Scales
- Epidemiology
This is an Open Access article distributed in accordance with the Creative Commons Attribution Non Commercial (CC BY-NC 3.0) license, which permits others to distribute, remix, adapt, build upon this work non-commercially, and license their derivative works on different terms, provided the original work is properly cited and the use is non-commercial. See: http://creativecommons.org/licenses/by-nc/3.0/
Statistics from Altmetric.com
Introduction
Parkinson's disease (PD) affects 1% of individuals over the age of 60 years.1 ,2 The clinical diagnosis of PD is often made late and current treatments address symptoms and not the underlying disease process.3 A key priority in PD is early detection and treatment with drugs that have disease-modifying effects.4
Many initiatives have been set up to identify individuals or groups at risk of PD.5 These include longitudinal studies in groups that have an excess background risk of PD and studies using proposed screening tests to delineate risk.6–10 Due to the cost and availability of these tests, a non-invasive, widely available and inexpensive method to select groups for further investigation would be desirable.
A large number of historical risk factors and early non-motor features of PD have been reported from observational studies. Recently, our group reported a systematic exploration of factors that can be screened for in a primary care setting.11 In parallel to this, we initiated the PREDICT-PD study; an internet-based study in the UK general population to identify a group at higher risk of PD, using an algorithm that estimates the possible risk of developing PD from information that can be collected using online tools. We describe here the development of the preliminary algorithm derived from the results from the systematic review of published literature.11 The performance of this preliminary algorithm was assessed by comparing the occurrence of a combination of proxies for future PD, including three of the strongest individual markers of increased PD risk (smell loss, report of REM sleep-behaviour disorder (RBD) and finger-tapping speed), in those estimated to be at higher risk of PD alongside those estimated to be at lower risk. Confirmation of validity will be tested in the longitudinal follow-up of study participants, using incident PD diagnosis as the outcome.
Methods
The study was approved by Central London Research Committee 3 (reference number 10/H0716/85). Participants were recruited via the study website following a limited advertising campaign on local radio and in magazines with an older readership, and by email to members of the Parkinson's UK charity. Participants submitted an online consent form before passing to the secure test area. Inclusion criteria in this phase were residency in the UK and age 60–80 years. Exclusion criteria were pre-existing PD, movement disorder, stroke, motor neuron disease, dementia or drug usage known to be associated with iatrogenic Parkinsonism.
Participants completed a survey with demographic questions and items related to early non-motor features and risk factors for PD, which incorporated validated questionnaires, that is, the Hospital Anxiety Depression Scale, the RBD Screening Questionnaire (RBDSQ), and a number of individual questions that had been used in good quality observational studies that previously reported risk factors for PD.12 ,13 For the RBDSQ, we used a cut-off score of ≥5, which has previously been shown to have a sensitivity of 96% and specificity of 56% for diagnosis of RBD confirmed by polysomnography.13
The overall survey length was 56 items and it took approximately 20 min to complete, based on prior testing by members of the research team and 10 independent healthy volunteers aged 60–80 years, whose data were not included in the results.
Immediately after the survey, participants were invited to undertake a keyboard tapping task, the bradykinesia akinesia incoordination test (BRAIN test), which is used to assess upper limb motor function.14 ,15 The BRAIN test has recently been redeveloped to run in all internet browser software and has been validated in patients with PD and controls (manuscript in preparation, permission granted by AJN 2013). Participants use the index finger of a single hand to alternately strike the ‘S’ and ‘;’ keys on a standard computer keyboard, as fast and accurately as possible. The test is repeated for the other hand. The BRAIN test reports four variables calculated from key taps; (a) kinesia score (KS30), the number of key taps in 30 s; (b) akinesia time (AT30), the mean dwell time on each key in milliseconds (ms); (c) dysmetria score (DS30), a weighted index using the number of incorrectly hit keys scored in a target fashion; and (d) arrhythmia score (AS30), the variance of the time interval in milliseconds between keystrokes. Of these KS30 is the most sensitive parameter for diagnosis of PD and determining PD severity.14 The BRAIN test can be accessed at http://www.predictpd.com/braintest and applications to use this can be directed to AJN via the same web link.
Participants were also sent the US version of the University of Pennsylvania Smell Identification Test (UPSIT) via post. The UPSIT is a 40-item scratch and sniff smell test (composed of four booklets, each with 10 test pages) that has been used extensively in the investigation of smell disturbance in neurological disease.16 In line with the ongoing Parkinson's At-Risk Study, which uses smell loss to identify individuals at risk of future PD, we used the lower 15th centile of UPSIT scores as the cut-off to denote hyposmia.6 The answers were entered on the study website by most participants. A minority (n=155) returned results completed in the test booklets only.
Analysis
Based on the results of our recent systematic review, which provided risk estimates for each early non-motor feature or risk factor significantly associated with altered risk of PD, we developed a preliminary algorithm to provide PD risk scores for each participant.11 In this algorithm we included age, gender, smoking status, family history of PD, coffee use, alcohol use, hypertension, non-steroidal anti-inflammatory drug use, calcium channel blocker use, β blocker use, constipation, previous head injury, anxiety or depression and erectile dysfunction (in men only). Most factors were sought in binary terms (ie, presence or absence) except for bowel movement frequency (seven possible answers for frequency with a cut-off of less than one movement per day denoting low frequency), erectile dysfunction (three options with ‘poor’ or ‘fair’ indicating dysfunction) and mood (a cut-off score of 8 or above in either the anxiety or depression components of the Hospital Anxiety Depression Scale questionnaire denoting mild forms of these disorders). In order to keep the survey simple, pesticide exposures, proxies for organochemical exposure and more complicated factors were not included. Any subject that reported a neurological diagnosis listed in the exclusion criteria was removed from the analysis.
Importantly, we did not include smell loss and RBD, which are reported to be two of the strongest estimated risk factors for future PD (along with finger tapping in selected risk groups8). These were instead used as outcome measures or proxies for preliminary validation of the basic algorithm (see below). For each individual, the age-related risk (expressed as an odds) of developing PD was determined based on results from the Physician's Health Study.1 The equation determined from these data was:
As these data were from an all-male cohort, and prevalence of PD is approximately 1.5 times greater in men, the age risk for women was reduced accordingly.17 An individual's risk was increased or decreased by each of the above factors according to the strength of association with PD reported in the systematic review.11 For example a male, current smoker with a 1:100 age-related risk of developing PD was calculated to have a risk of 0.44×1:100=1:227. If that individual also had a family history of PD their risk was calculated as 4.45×1:227=1:51. The risks for all participants were ranked and the 100 with the highest risk and 100 with the lowest risk scores were identified.
The preliminary validity of this recruitment and risk estimation method was tested by comparing three of the potentially strongest individual markers of increased PD risk (smell loss, RBD and finger-tapping speed) between the 100 participants calculated to be at highest and lowest risk. Several lines of evidence (including pathology and imaging) suggest that loss of smell may be a sensitive (albeit not specific) predictor of PD.9 ,10 ,18–22 RBD is rare in the general population but its presence carries a high risk of conversion to PD in longitudinal cohort studies making it relatively specific albeit not sensitive.23–25 Bradykinesia is a core feature of PD and subtle motor signs can precede the diagnosis of PD by several years, suggesting that finger tapping may be a sensitive early feature of PD risk.8 ,26 ,27
We hypothesised that if the preliminary algorithm were successful, those in the higher-risk group would have significantly lower UPSIT scores, higher rates of RBD and slower tapping speeds than the lower-risk group. Confirmatory findings would suggest that the algorithm was enriching a population for increased risk of PD.
Statistics
UPSIT, RBDSQ and BRAIN test scores between the 100 highest and 100 lowest risk individuals according to the algorithm were compared using t tests and described using means, where data were normally distributed. Where data did not follow a normal distribution, medians and the Mann-Whitney U test were used. Comparisons for data split into categories were made using the χ2 test. The relationships between UPSIT, BRAIN and RBDSQ scores with predicted risk of PD in the whole dataset were also examined using median, linear and Poisson regressions, respectively. All analyses were performed using Stata V.10.
Results
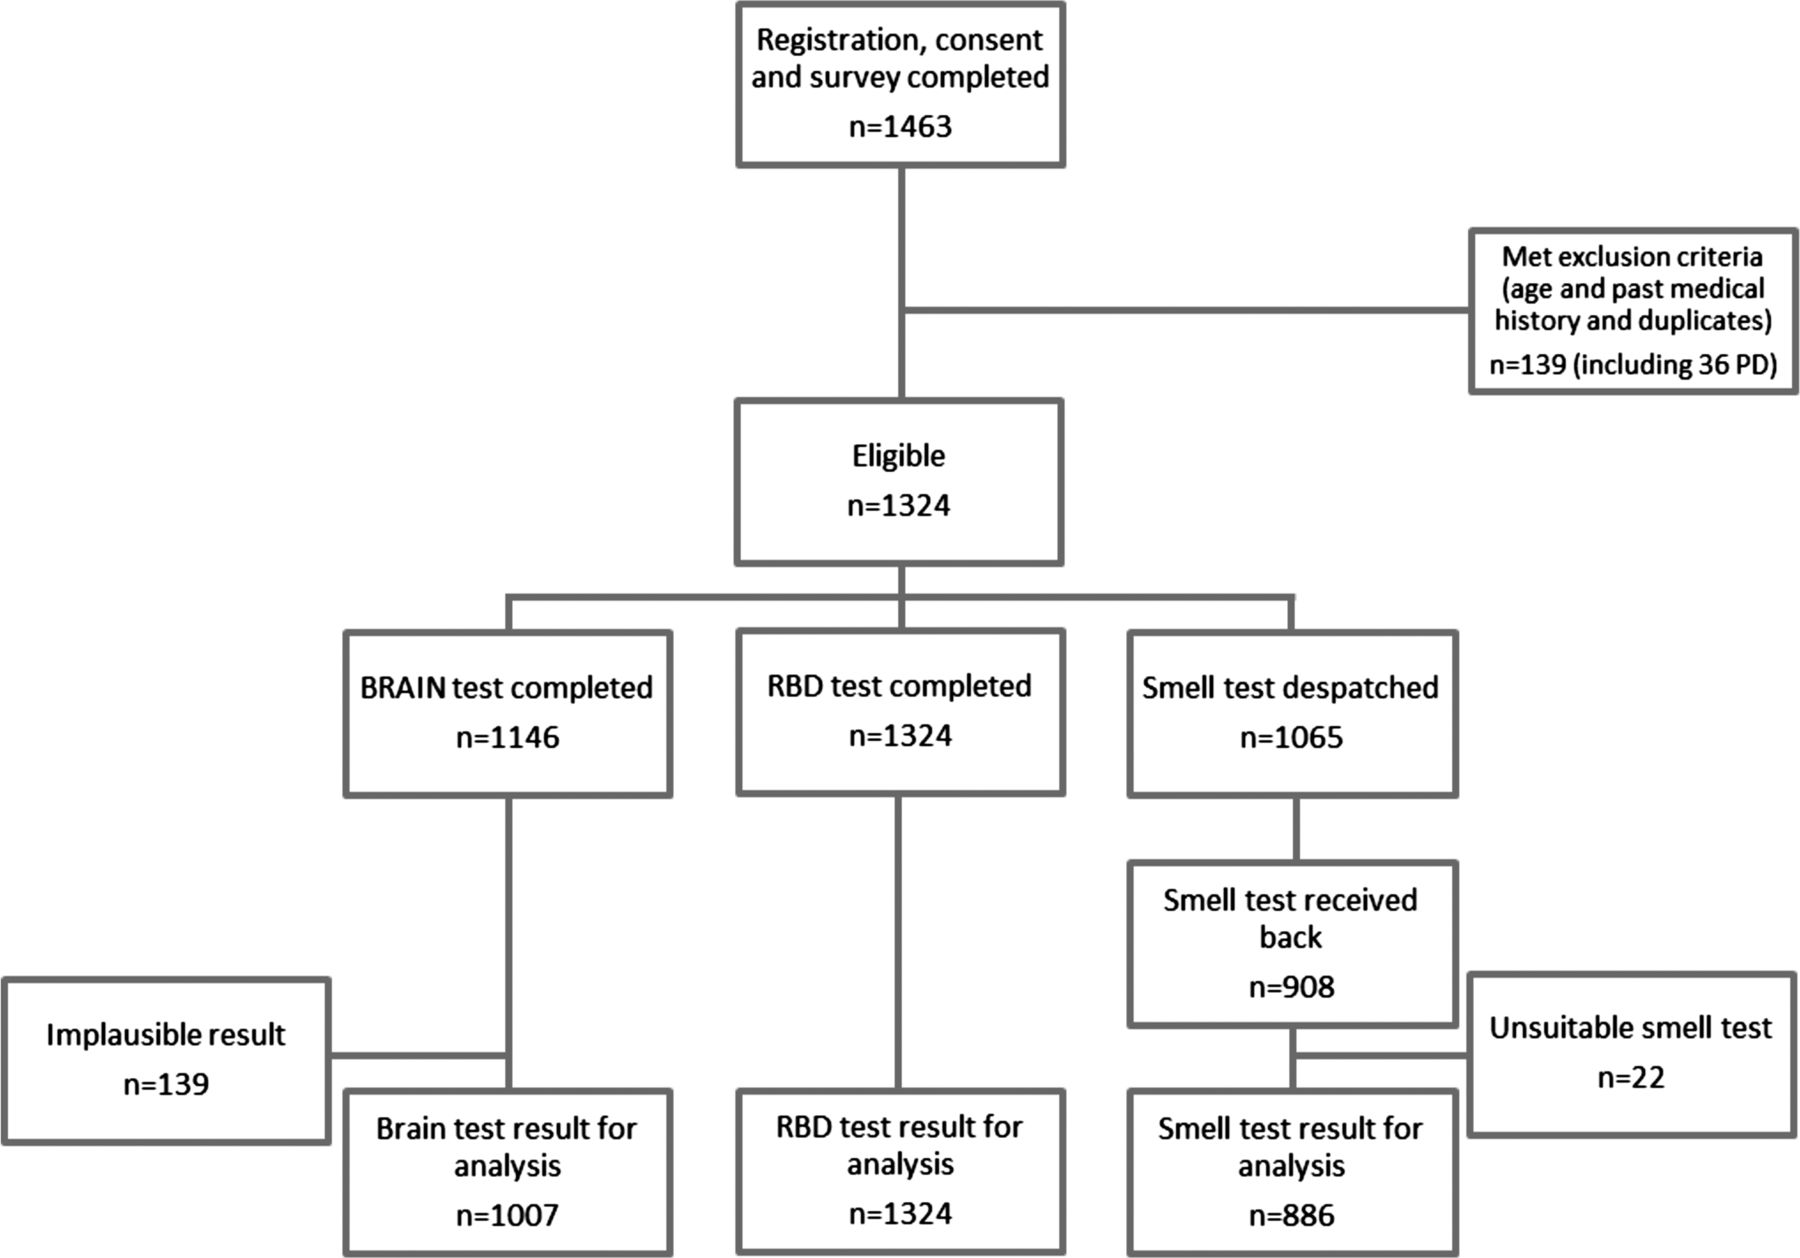
Figure 1 shows the flow of participants in the study. Of the 1463 individuals that registered, consented and completed the survey, 139 met exclusion criteria in light of their past medical history (including existing PD and other neurological diagnoses), country of residence or age. This left 1324 eligible survey responders, of whom 1146 undertook the BRAIN (keyboard tapping) test and submitted results for at least one hand. Upon analysing these data, 139 BRAIN test results were deemed unsuitable for inclusion leaving 1007 results for the final analysis. Most excluded BRAIN test results were because of implausibly low (<15) or implausibly high (>100) KS30 scores since they indicated that the test instructions had been misunderstood or, that the test was performed using two hands together rather than separately. Other cases were excluded if their dysmetria score was greater than or equal to 1.5, indicating at least half the keystrokes were to the wrong key. These cut-offs were assigned based on previous BRAIN test data (manuscript in preparation). The funding enabled 1065 participants to be sent smell tests. Results were received for 908 of these either via the website or as a hard copy, of which 22 were incomplete and 886 were suitable for inclusion in final analysis. Thus 75.9% of eligible individuals who successfully undertook the survey completed a suitable BRAIN test, and 83.1% of people that were sent a smell test completed it and submitted results that could be used in the analysis.

Flow of participants in the study.
The prevalence of factors that contributed to individuals’ predicted risk of PD is presented for the whole group, for the 100 individuals with the highest and for the 100 with the lowest predicted risks in table 1. The results for the three proxies (UPSIT, RBDSQ and BRAIN test scores) were also determined in these three groups (table 2). Additional demographic data that did not contribute to the risk score including occupation, ethnicity and education are listed in the online supplementary material (table 3), along with further analyses of associations between risk factors (see online supplementary table 4).
Prevalence of factors that contributed towards the risk score
UPSIT, RBDSQ and KS30 scores in all participants and those with the highest and lowest predicted risks of Parkinson's disease
In the 100 individuals with highest estimated risk as calculated using the algorithm, the median UPSIT score was 30 (IQR 28–33) and in the 100 with the lowest estimated risk it was 33 (IQR 31–36; p<0.001). Using the lower 15th centile as a cut-off corresponded to an UPSIT score of 27.6 Six per cent (4/65) of the lower-risk and 20% (13/65) of the higher-risk participants had an UPSIT score below 27 (p=0.019). We did not use age-specific and gender-specific 15th centile cut-offs for the UPSIT since age and gender were factors included in the algorithm. The median RBDSQ in both the lowest and highest risk groups was two (IQR 0–3 and 1–4, respectively), but the sum of the ranks was larger in the higher-risk group than in the lower-risk group (p=0.016). Using the RBDSQ cut-off score of ≥5, more people had RBD in the higher-risk group compared with the lower-risk group (24% vs 10%, p=0.008).13 For the BRAIN test, the mean KS30 scores in the higher-risk and lower-risk groups were 54.7 and 58.1, respectively (p=0.045). There were no significant differences in the other three BRAIN test variables (data not shown). Further analyses using only subjects that had complete outcome measure data sets were also undertaken and gave similar significant findings (see online supplementary table 5).
UPSIT, RBDSQ and KS30 scores were plotted against estimated risk of PD in all participants (figure 2). Estimated risk of PD as calculated by the algorithm doubled with a decrease of UPSIT scores by 0.53 points (95% CI 0.29 to 0.77, p<0.001), an increase of RBDSQ scores by 8.0% (95% CI 4.5% to 11.7%, p<0.001) and a decrease of KS30 scores by 0.75 points (95% CI 0.32 to 1.19, p=0.001).

(a) UPSIT, (b) RBDSQ and (c) KS30 scores plotted against estimated risk of PD with regression lines.
Discussion
This is one of largest cross-sectional studies to date examining methods to identify a group of individuals with risk factors for developing PD. The methodology is based on a comprehensive systematic review of the literature on early features and risk factors of PD that can be identified through history taking, and on calculating estimates of risk through combination of these factors.11 We found confirmation for our hypotheses that those deemed to be at higher risk of PD would have poorer smell sense, increased rates of RBD and slower finger tapping speed, when compared with the lower-risk group. Ultimately, confirmation of the validity of this algorithm requires recording an increased rate of incident PD in the higher-risk group, and this information will only become available during longitudinal follow-up.
Internet-based recruitment allowed us to gather a large sample size without high expenditure; the participants were recruited relatively easily, and completion rates for individual stages of the study, and the study as a whole, were high. The penetration of the internet has increased over the last decade, including use in the over 60 years age group.28 This means that similar research can be undertaken via the internet as a means of accessing large populations, with frequent retesting and relative convenience, while making dramatic savings to cost, when compared with traditional longitudinal studies. The longitudinal component of this study will also seek to incorporate additional risk factors in light of new research and data collected within the study, including the role of occupation, self-reported motor symptoms and other markers of bowel function (eg, laxative use and stool hardness). Our methods relied on self-recruitment, which introduces potential for recruitment bias, and also on self-reporting without confirmation of results (except smell testing and tapping speed). This method, even with future modifications, is therefore unlikely, on its own, to be a reliable measure of prediagnostic PD. However, the purpose of this ongoing longitudinal study is to provide a mechanism by which a group at increased risk can be identified from the general population for inclusion in more detailed studies that will be more demanding in terms of time, resources and effort by participants and researchers, including those using imaging and laboratory biomarkers (figure 3).

Schematic indicating how a screening process might channel into detailed biomarker and risk-determination studies in groups identified as being higher risk than the background population.
Our results are in keeping with recent reports of combined screening measures to predict future PD in other longitudinal studies of prediagnostic PD.5 We found a significant difference in the average UPSIT score between the higher-risk and lower-risk groups identified through the algorithm, and a significant difference in proportion in the higher-risk and lower-risk group that had a score below the lower 15th centile cut-off of 27. Analogous results were recently reported in the Parkinson's At-Risk Study where patients with hyposmia were significantly more likely to report non-motor features, including anxiety and depression, constipation and rapid eye movement sleep behaviour disorder symptoms, and to report changes in motor function.6 RBD, as suggested by an RBDSQ score of ≥5, was significantly more frequent in the high-risk than the low-risk group, and tapping speed was significantly lower in the high-risk group, indicating that at least some of the individuals in the high-risk group may be in the very earliest stages of motor impairment. Subtle changes in movement control have previously been reported in video footage of the footballer Ray Kennedy several years before onset of diagnosed PD and in patients with confirmed RBD.8 ,27 Of note also is the fact that the scores for all three proxies for PD were significantly worse with increasing predicted risk of PD across all participants. Individually, none of these three outcomes is specific and sensitive for early PD. However, evidence from pathological, epidemiological and imaging studies suggest that each of them is associated with an increased risk of PD, and consistent correlation of these markers with higher risk as defined by the algorithm is in keeping with this algorithm being able to identify a higher-risk group.29–31 Taken together, these results all indicate that this evidence-based algorithm has the potential to be a useful tool to identify groups at higher risk of future PD for inclusion in studies to identify biomarkers for early PD.
Study limitations
First, many of the participants volunteered following advertising by a Parkinson's charity. Therefore many had a family history of PD and may have been fearful about their own risk of the disease. This is a measurable bias in part and increases the likelihood of finding those at high risk. Second, in using proxies for future PD risk, it is unknown currently what proportion of those that are at higher risk will go on to develop PD. The numbers are likely to be small given the number of participants in the study to date and the incidence of PD in the general population. Nonetheless, the conversion of individuals in the higher-risk group and not the lower-risk group to clinically established PD would offer strong evidence of the predictive nature of the algorithm. Third, for this analysis it was assumed the predictors are independent, and this is unlikely to be the case. Although the figures from the systematic review were adjusted for confounders, further analysis showed some association between factors (see online supplementary table 4). The simple additive model we are using may therefore not fully replicate the early stages of the disease. Currently there are insufficient data in the literature to account for robust interactions and one aim of the longitudinal study is to modify the results based on emerging prospective data. Fourth, RBD and other reports of clinical features were not confirmed using polysomnography (although the RBDSQ has been validated against polysomnography13) or other objective tests. This is likely to reduce the accuracy of these predictive factors but the purpose of this methodology is to be easily available and non-invasive, which objective confirmatory tests often are not. Fifth, due to the design of the study, there is an additional bias in that we have identified participants that are English-speaking and computer literate (data in online supplementary table 3 showed that the majority of participants were well educated and most were Caucasian). Finally, in order to test the initial validity of our approach we adopted a conservative method excluding the most promising risk factors of smell loss, RBD and tapping speed from the algorithm and used these as proxies to evaluate its performance. Our results were significant despite their exclusion and it is likely that subsequent inclusion of smell loss, RBD and tapping speed will improve the performance of the algorithm. However, doing this will require estimation of the magnitude of risk conveyed by each since absolute data are currently not available in the literature. Our hypotheses will be tested further when longitudinal results are available from this study in its current and expanded form, which will lead to modifications of this preliminary algorithm.
References
Supplementary materials
Supplementary Data
This web only file has been produced by the BMJ Publishing Group from an electronic file supplied by the author(s) and has not been edited for content.
Files in this Data Supplement:
- Data supplement 1 - Online tables
Footnotes
-
Contributors AJN: design and conceptualisation of the study, acquisition of data, analysis of the data, interpretation of the data, drafting the manuscript, approval of final version. JPB: design and conceptualisation of the study, analysis of the data, interpretation of the data, drafting the manuscript, approval of final version. LS-M: design and conceptualisation of the study, interpretation of the data, revision of the manuscript for intellectual content, approval of final version. CHH: design and conceptualisation of the study, interpretation of the data, revision of the manuscript for intellectual content, approval of final version. CHK: design and conceptualisation of the study, interpretation of the data, revision of the manuscript for intellectual content, approval of final version. JH: design and conceptualisation of the study, interpretation of the data, revision of the manuscript for intellectual content, approval of final version. GG: design and conceptualisation of the study, interpretation of the data, revision of the manuscript for intellectual content, approval of final version. SN: acquisition and interpretation of the data, revision of the manuscript for intellectual content, approval of final version. CO: acquisition and interpretation of the data, revision of the manuscript for intellectual content, approval of final version. AJL: design and conceptualisation of the study, interpretation of the data, revision of the manuscript for intellectual content, approval of final version. AS: design and conceptualisation of the study, analysis of the data, interpretation of the data, drafting of the manuscript, approval of final version.
-
Funding This work was supported by Parkinson's UK (Innovation Grant reference number K-1006: £35 000).
-
Competing interests AJN: Travel support from the National Institute of Health Research for presentations at MDS Congresses and Association of British Neurologists Meetings; Grants from Parkinson's UK Innovation Grant (K-1006), Parkinson's UK Career Development Award (F-1201), National Institute of Health Research Academic Clinical Fellowship; Consultancy for Élan/Prothena Pharmaceuticals. JPB reports no disclosures. LS-M: Reta Lila Weston Trust, UNICAMP, Parkinson's UK, Parkinson's Foundation, FAEPEX, FAPESP; travel support, Britannia, UCB; honoraria, Britannia. SN reports no disclosures. CO reports no disclosures. CHH: Joint chief editor of Multiple Sclerosis and Related Disorders; Speaking fees from Teva Lundbeck; Royalties from Cambridge University Press. CHK: Speaker fees and consultancy for Shire Movetis and Medtronic Inc. JH reports no disclosures. GG: Consultancy fees from Merck-Serono, Biogen-Idec, Ironwood, Genentech, Teva, GSK, Sanofi-Aventis, Novartis, Roche, UCB Pharmaceuticals, Vertex, Eisai, Élan, Fiveprime, Bayer-Schering, Synthon BV and Genyme; Grants from Biogen-Idec, Bayer-Schering, GW Pharma, Merck-Serono, Merz, Novartis, Teva, Sanofi-Aventis. AJL: Board membership for Novartis, Teva, Meda, Boehringer Ingelheim, GSK, Ipsen, Lundbeck, Allergan, Orion, BIAL, Noscira, Roche; Consultancy for Genus; Grants from PSP Association, Weston Trust–Reta Lila Howard Foundation; Speaking fees from Novartis, Teva, Meda, Boehringer Ingelheim, GSK, Ipsen, Lundbeck, Allergan, Orion, BIAL, Noscira, Roche. AS: Consultancy fees from Solvay, Boehringer Ingelheim, Neurosearch and Osmotica Pharmaceuticals.
-
Ethics approval Central London Research Ethics Committee 3.
-
Provenance and peer review Not commissioned; externally peer reviewed.
-
Data sharing statement It is the intention of the authors to make study data available for sharing.