Article Text

Abstract
Objectives Biomarkers for the diagnosis of motoneuron diseases (MND) are urgently needed to improve the diagnostic pathway, patient stratification and monitoring. The aim of this study was to validate candidate markers for MND in cerebrospinal fluid (CSF) and specify cut-offs based on large patient cohorts by especially considering patients who were seen under the initial differential diagnosis (MND mimics).
Methods In a prospective study, we investigated CSF of 455 patients for neurofilament light chain (NfL), phosphorylated heavy chain (pNfH), tau protein (Tau) and phospho-tau protein (pTau). Analysed cohorts included patients with apparently sporadic and familial amyotrophic lateral sclerosis (ALS) and primary lateral sclerosis (PLS) (MND, n=253), MND mimics (n=85) and neurological control groups. Cut-off values were specified, and diagnostic performance and correlation with progression were analysed.
Results Nfs were significantly higher in the MND group compared to the control groups, whereas Tau and pTau did not differ. At a cut-off level of 2200 pg/mL for NfL, a 77% diagnostic sensitivity (CI 71% to 82%), 85% specificity (CI 79% to 90%) and 87% positive predictive value (PPV) (CI 81% to 91%) were achieved. For pNfH, we calculated 83% sensitivity (CI 78% to 88%), 77% specificity (CI 71% to 83%) and 82% PPV (CI 77% to 86%) at 560 pg/mL. There were no significant differences between sporadic and genetic ALS or PLS. Nf levels were elevated at early disease stage, and correlated moderately with MND progression and duration.
Conclusions Neurofilaments in CSF have a high relevance for the differential diagnosis of MNDs and should be included in the diagnostic work-up of patients. Their value as prognostic markers should be investigated further.
Statistics from Altmetric.com
Introduction
Motoneuron diseases (MND) are a group of neurodegenerative disorders, the most common form of which is amyotrophic lateral sclerosis (ALS), characterised by degeneration of the upper and lower motoneurons. ALS has a median survival of 3 years from symptom onset.1 Currently, riluzole is the only licensed disease-modifying drug and the focus of management is palliative.
One study suggested that around 7% of those initially diagnosed as ALS ultimately turned out to have a different disease.2 By the time the patients fulfil the El Escorial criteria for clinically definite ALS they are usually in the advanced stage of disease.3 Validated neurochemical biomarkers that distinguish early between ALS and its differential diagnoses are lacking, but urgently needed.4
Several CSF biomarker candidates have been proposed, but none of these have successfully been translated into clinical routine. Neurofilaments (Nf) represent promising biomarkers that might enable the diagnosis and prognosis of ALS.4–6 It is mainly the retrospective studies of small patient cohorts, which have provided evidence that neurofilament light chain (NfL) and phosphorylated heavy chain (pNfH) concentrations are significantly increased in the CSF of patients with ALS, and that this correlates with disease stage, progression and/or prognosis.7–15 We have now performed a monocentric prospective study with the aim of determining diagnostic values for these biomarker candidates in CSF for a well-characterised patient sample comprising of 253 patients with MND and control groups, including patients with the initial diagnosis of MND but later revision (MND mimics), and patients with other neurodegenerative diseases, as well as groups without neurodegeneration.
Material/methods
Participants and clinical characterisation
A total of 455 participating patients were seen in a prospective manner at the Department of Neurology in Ulm from May 2010 to June 2014 (table 1). Patients provided written informed consent for the study according to institutional guidelines. The study was approved by the ethics committee of the University of Ulm (proposal number 20/10, year 2010). Clinical database lock was in September 2014.
Patients’ demographic characteristics and CSF parameter in the diagnostic groups
The overall aim of the study is to find biomarkers for neurological diseases. All patients who enter into our department (inpatients and outpatients) were asked to participate in this study. Only patients not willing to participate were not included. Depending on the initial differential diagnosis a standardised procedure of investigations was performed. Patients were then followed up every 6 months. Allocation to diagnostic groups was performed according to the latest available clinical information. For patients who were seen in the 2014 follow-up, time could only be short. For all patients who were seen as controls, a minimum follow-up time of 6 months was available, apart from some exceptions.
Demographic characteristics of the patient cohorts are shown in table 1.
We investigated 253 patients with MND, 85 MND mimics with other diseases (table 2), two groups with neurodegenerative diseases: Alzheimer's disease (AD, n=28)16 and Parkinson's syndrome (PS, n=26),17 another group with polyneuropathies (PNP, n=33), and a group with facial palsies (n=30).
Biomarker concentrations and routine CSF parameters for MND-mimics (patients who were seen under the differential diagnosis of an MND)
The MND group comprised 222 patients who were diagnosed as clinically definite or probable ALS according to the revised El Escorial diagnostic criteria,18 11 patients with primary lateral sclerosis (PLS) and 20 genetic ALS (familial ALS) cases.
DNA was available from 122 patients with MND and was screened for mutations in C9orf72, FUS and SOD1 mutations according to established protocols.19 ,20 In total, 11 patients carried a C9orf72 GGGGCC-repeat expansion on one allele, 2 patients harboured a heterozygous FUS mutation (p.Asp502Thrfs*27, p.Lys510Arg) and 7 carried heterozygous SOD1 mutations (p.His43Arg (n=2), p.Arg115Gly (n=2), p.Gly72Ser, p.His48Arg, p.Gly108Val).
Severity of physical symptoms was classified as per the revised ALS functional rating scale (ALS-FRS-R) with a maximum of 48 points, where lower values represent a more severe disease stage.21 From 230 of 253 patients with MND, ALS-FRS-R values were available at the time of lumbar puncture. ALS-FRS-R was in the range of mild to moderate disease stage (median 42, range 6–48 points); disease duration ranged from 2 to 310 months (median 13).
A standardised neuropsychological assessment was available from 99 patients with MND. As a screening tool, we used the Montreal Cognitive Assessment (MOCA) or Edinburgh Cognitive and Behavioural Amyotrophic Lateral Sclerosis Screen (ECAS).22 ,23 Depending on the clinical interview or the screening, a detailed neuropsychological assessment with the CERAD-Plus (Consortium to Establish a Registry for Alzheimer's Disease) was made.24
In 10 of these patients, the diagnosis of ALS with behavioral variant frontotemporal dementia (bvFTD) was performed. In 2 of these 10 ALS-FTD cases, Alzheimer's dementia was also considered in the differential diagnosis.
Within the standardised clinical-neurological work-up of patients, 75 patients with MND underwent an additional MRI/diffusion tensor imaging (DTI) protocol which has been extensively used for the neuroimaging characterisation of MND.25 Fifty three patients with MND underwent a DTI protocol on a clinical 1.5 T scanner (Magnetom Symphony, Siemens Medical) and 25 patients with MND underwent a DTI protocol on a 3.0 T scanner (Magnetom Allegra, Siemens Medical). The DTI analysis software Tensor Imaging and Fiber Tracking software were used for postprocessing and statistical analysis.26 The averaged fractional anisotropy (FA) along the corticospinal tract (CST) was calculated by tractwise FA-statistics. FA in the CST (as the initial tract correlate to be affected during the disease course26) was then used as a surrogate marker for the integrity of the neuronal tracts.
Laboratory markers
CSF was obtained by lumbar puncture, centrifuged, aliquoted and stored within 2 h at −80°C until analysis. Serum was processed likewise. The concentration of albumin, IgG, IgA and IgM in CSF and sera was determined as described earlier.27
Commercially available ELISA kits were used for NfL (IBL, Hamburg, Germany) and pNfH (Biovendor, Heidelberg, Germany) according to the manufacturers’ instructions, and for Tau and pTau (Fujirebio, Hanover, Germany) as published earlier.5 ,28
Patient's sera were applied to the pNfH assay and two separate analyses were performed with the statistics covering all values, including those below the lowest calibrator determined by extrapolation, or with statistics also involving samples without any measurable pNfH concentration.
For quality control, the same six samples were run on each plate and reproducibility of results was assessed by calculating the coefficient of variation (CV). The mean interassay CV was <20% for the NfL, pNfH, Tau and pTau ELISAs.
Calculations and statistics
Standard measures of diagnostic test validity, such as sensitivity, specificity and predictive values accompanied by their CIs stated at the 95% confidence level, were calculated for varying biomarker cut-off levels. The optimal cut-off level for dichotomising values was selected as the situation maximising the Youden index.25 The receiver operating characteristics (ROC) curve is used for a graphical visualisation of the impact of the variation in the cut-off values. Two-tailed unpaired Mann-Whitney t test and Kruskal-Wallis test at a significance level of 5% were used to determine statistical differences between two groups or more groups, respectively. Dunn's post hoc comparison was applied following Kruskal-Wallis test in case of significant differences. Correlation between parameters was calculated by Spearman rank correlation r at a 5% significance level. The Kaplan-Meier method was used for estimating survival curves, which subsequently were compared using the log rank test. Calculation and graphics were done using graph pad prism and JMP-SAS-software.
Results
Patient characteristics
Patient characteristics are given in table 1. There was no age difference between the MND group and the control groups. Within the control groups, patients with facial palsy were younger than patients with AD.
Concentrations of biochemical markers
The concentrations of NfL and pNfH were significantly higher in the CSF obtained from patients with MND compared to all other patients taken together and to each of the analysed diagnostic groups (p<0.0001, respectively; table 1, figure 1A, B).
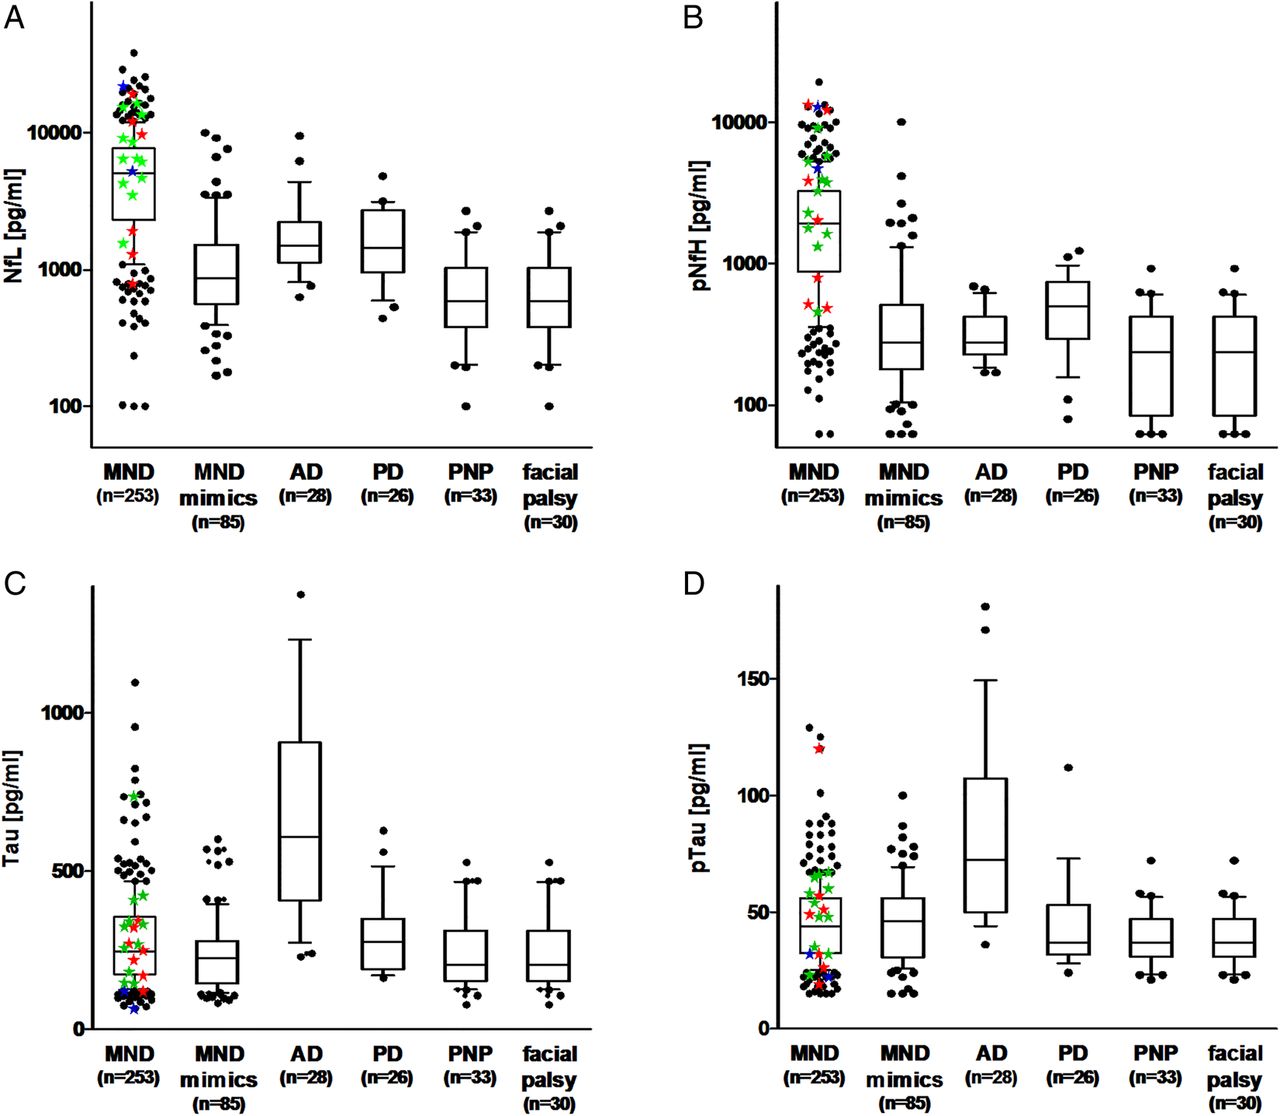
Biomarker concentrations in the CSF of the diagnostic groups. Boxplots showing the distribution of concentrations of NfL (A), pNfH (B), Tau (C), and pTau (D). Given are the median concentrations, 25% and 75% centile, and 5% and 95% whiskers. The black symbols represent outlier, coloured stars represent concentrations measured in the genetic ALS cases (blue: FUS mutation, red: SOD1 mutation, green: C9orf72 mutation). AD, Alzheimer's disease; ALS, amyotrophic lateral sclerosis; CSF, cerebrospinal fluid; MND, motoneuron diseases; NfL, neurofilament light chain; PD, Parkinson disease; PNP, polyneuropathy; pNfH, phosphorylated heavy chain; pTau, phospho-tau protein; Tau, tau protein.
The concentrations of Tau and pTau in the CSF were significantly higher in AD patients than in all patients with non-AD diagnoses taken together as well than in each diagnostic group (p<0.0001). There was no difference between MND and all other patients or the examined diagnostic groups, except AD.
Neurofilaments in serum samples
With the commercial ELISAs we measured 38 MND sera and 60 MND mimics sera. We were not able to detect NfL in any of the tested serum samples (data not shown). Serum pNfH could be quantified in 20/38 (53%) MND sera and 39/60 (65%) MND mimics sera. The concentrations were scattered over a wide range, with higher values in the MND serum samples (see online supplementary figure S1). Statistical analysis revealed significant differences when only samples with measurable pNfH concentrations are included (p=0.0068). However, when all values including those samples under detection limit are considered, the test failed to be significant (p=0.2648).
Correlation between neurochemical markers
Correlation of age and CSF NfL (r=0.219), pNfH (r=0.212), Tau (r=0.42), or pTau (r=0.37) was low to moderate.
NfL and pNfH concentrations in the CSF were highly correlated within all groups (MND r=0.88, MND mimics r=0.82, facial palsy r=0.90, PD r=0.65, PNP r=0.60), except the AD group (r=0.012).
Neither NfL nor pNfH showed a correlation with total CSF protein (NfL: r=0.20, pNfH: r=0.19) or Qalb as an indicator of the blood-CSF-barrier function (NfL: r=0.22, pNfH: r=0.20).
All correlations of biomarkers with each other and with age, CSF protein and Qalb determined for each diagnostic group are given in online supplementary table S1.
Application of cut-offs for NfL and pNfH
An NfL concentration above 2200 pg/mL yielded the optimal discrimination between MND and MND mimics, at sensitivity of 77% (CI 71% to 82%) and 88% specificity (CI 79% to 94%), with a positive predictive value (PPV) of 95% (CI 91% to 98%), and negative predictive value (NPV) of 56% (CI 48% to 65%). Applying this cut-off to all other control groups, a diagnostic specificity of 85% (CI 79% to 90%) was obtained, with a PPV of 87% (CI 81% to 91%) and NPV of 75% (CI 69% to 80%).
For pNfH, the best diagnostic performance was achieved at a cut-off of 560 pg/mL. Here, the diagnostic sensitivity is 83% (CI 78% to 88%), the specificity is 80% (CI 70% to 88%), with a PPV of 93% (CI 88% to 95%) and NPV of 62% (CI 52% to 71%). The diagnostic performance at this cut-off level against all control patients reaches a specificity of 77% (CI 71% to 83%), with a PPV of 82% (CI 77% to 86%) and NPV of 79% (CI 72% to 84%).
The ROC curves are shown in figure 2A. We calculated the corresponding areas under the curves (AUCs) for NfL to be 0.866±0.023 (CI 0.821 to 0.911) and 0.851±0.019 (CI 0.813 to 0.888), respectively, when analysing the MND group in comparison to the MND mimics group or in comparison to all non-MND patients. The respective AUCs for pNfH are 0.841±0.025 (CI 0.791 to 0.890) and 0.871±0.017 (CI 0.837 to 0.905), respectively. The AUCs obtained for the ROC curves for Tau and pTau, shown in figure 2A, are 0.520±0.028 (CI 0.466 to 0.574) and 0.519±0.027 (CI 0.465 to 0.572).

ROC curves, survival curves, and change during disease progression of NfL and pNfH. (A) ROC curves of NfL and pNfH CSF concentrations for discrimination between MND and MND mimics or all non-MND patients. For comparison, the ROC curves of Tau and pTau are shown. Relation and linear regression between the NfL (B) and pNfH concentrations (C) and the progression rate of patients with MND as calculated by the delay between onset and CSF sampling divided by the reduction in ALS-FRS-R. Follow-up data on concentrations of NfL (D) and pNfH (E) in the CSF from 11 patients with sporadic ALS, expressed as changes relative to baseline levels at first sampling time T1 and calculated per month. Survival curves for patients with MND with low (≤median), intermediate (median to 75% centile), and high (≥75% centile) NfL levels (F) and pNfH levels (G), respectively. AD, Alzheimer's disease; ALS, amyotrophic lateral sclerosis; CSF, cerebrospinal fluid; MND, motoneuron diseases; NfL, neurofilament light chain; PD, Parkinson disease; PNP, polyneuropathy; pNfH, phosphorylated heavy chain; pTau, phospho-tau protein; ROC, receiver operating characteristics; Tau, tau protein.
Biomarker levels in MND subtypes
There was no significant difference between ALS, PLS and genetically defined ALS for all biomarkers (NfL: p=0.095, pNfH: p=0.059; Tau: p=0.829, pTau: p=0.769).
Neurofilament levels of the patients with ALS-FTD were within the range of cognitively unaffected patients (NfL: p=0.57, pNfH: p=0.8). In 2 of these 10 ALS-FTD cases, AD was also considered as a differential diagnosis and both cases presented with high Tau and pTau values in CSF (Tau: 955 pg/mL, pTau 125 pg/mL; Tau 724 pg/mL, pTau 88 mg/mL).
Investigation of MND disease progression
There was a weak tendency of low ALS-FRS-R values to higher biomarker levels (NfL: r=−0.163, p=0.013; pNfH: r=−0.154, p=0.016; Tau: r=−0.167, p=0.011; pTau: r=−0.123; p=0.06).
A longer duration between disease onset and CSF sampling date correlated moderately with lower Nf levels (NfL: r=−0.3758, p<0.0001; pNfH: r=−0.4302, p<0.0001). Higher progression rates (time between onset and sampling (in months) divided by reduction in ALS-FRS-R) were associated with higher Nf concentrations in MND (figure 2B, C). At least one clinical follow-up investigation after 6 months was available from 97 patients. FRS-value changes varied from −31 to +5 points. We divided the groups into fast progressors (−31 to −6 points, n=33), medium progressors (−6 to −3 points, n=32) and slow progressors/stable patients (−2 to 5 points, n=32). No significant difference could be observed when all groups were investigated (for all markers). Comparing only the fast and the slow progression group indicated a nominally significant difference (NfL: p=0.47, pNfH: p=0.0261, see online supplementary figure S2).
Biomarkers during follow-up spinal tap
From 11 patients with MND at least one follow-up spinal tab was available. From three of these patients, an additional follow-up sample was available (see online supplementary table S2; n=14 follow-up measurements). Follow-up times ranged from 1 to 23 months (median 8 months). Decrease in ALS-FRS-R ranged between 0 points and 14 points (median −1). For NfL, a significant decrease could be observed during follow-up (p=0.007, figure 2D). pNfH (figure 2E) and Tau levels were mainly stable, even in patients with fast progression (pNfH: p=0.520, Tau: p=0.413, pTau: p=1.0).
Biomarkers and survival times
Two hundred and fifty three patients with MND, including 45 patients with known date of death, were included in the log rank analysis. Survival times ranged from 1 to 29 months (median 9 months). Patients were subdivided into three groups according to Nf levels, with low (≤ median), intermediate (median to 75% centile) and high (≥75% centile) concentration (figure 2F, G). Significant differences were found for NfL (p=0.0261) and pNfH (p=0.0024).
Correlation with MRI findings
Averaged FA values along the CST ranged between 0.297 and 0.385 (median=0.332), and did not differ in cross-sectional comparison between 1.5 and 3.0 T protocols; therefore, FA values were pooled for correlation analysis with neurochemical markers. No correlation could be found between biomarker levels and FA-CST values (see online supplementary figure 2).
Investigation of control groups
MND mimics
PNPs comprised the largest diagnostic group within the group of patients seen under the differential diagnosis of an MND (table 2). This was followed by myopathies and hereditary spastic paraplegia. False positive cases: 11 patients had high values for NfL (>2200 pg/mL) and pNfH (>560 pg/mL) (myopathy (n=2), CIDP (n=3), PNP (n=2), benign fasciculation, encephalitis, radiculopathy, myositis), and 5 for pNfH only (benign fasciculation, myositis, endocrine myopathy, chronic pain and spinocerebellar ataxia). Twenty five patients had Qalb >8, of whom seven had high values for NfL and/or pNfH. Of 9 patients with Qalb >10 up to Qalb=50, 4 had high values for NfL and pNfH with the diagnoses of chronic inflammatory demyelinating PNP (n=2), PNP and polyradiculomyelitis. Four patients with normal Qalb and high values for NfL and pNfH presented the diagnoses of benign fasciculations, encephalitis, radiculopathy and myositis. Of note, these diagnoses were based on the latest available diagnosis. For the patient who was diagnosed with benign fasciculation, no further follow-up was available.
Other neurodegenerative diseases (AD and PS)
AD patients had high Tau and pTau levels. Among the control groups, AD and PS have the highest NfL and pNfH levels. In the PS group (table 3), 13 patients had high NfL and/or pNfH, of whom 7 had the diagnoses of Parkinson's disease dementia (n=3), multiple system atrophy (n=2) and progressive supranuclear palsy (n=2). Six patients had idiopathic Parkinson's disease, three patients with high NfL and/or pNfH also had Qalb >8.
Biomarker concentrations and routine CSF parameters for patients with diagnoses Parkinson syndrome, polyneuropathy and facial palsy
Polyneuropathy
As PNP is a major differential diagnosis, we investigated patients of this group in more detail (table 3). In the PNP group (n=33), four patients had high values for NfL and pNfH (NfL >2000 pg/mL, pNfH >560 pg/mL). Six patients had high values for pNfH only. Eleven patients had Qalb >8, of whom 8 had high values for NfL and/or pNfH. Of 5 patients with Qalb >10, 2 had high values for NfL and pNfH with the diagnoses of spondylodiscitis and polymyalgia rheumatica, 1 had high NfL with the diagnosis of Miller-Fisher syndrome and 2 had high pNfH with the diagnoses of axonal and demyelinating PNP. Patients with normal Qalb and high values for NfL and/or pNfH presented the diagnoses of axonal (n=1) and axonal paraneoplastic PNP (n=1).
Facial palsy
In the facial palsy group (n=30), only two patients with the diagnosis of idiopathic facial palsy presented with high NFL and/or pNFH and normal Qalb.
Discussion
Following our roadmap for finding a biomarker for ALS,29 we used the most promising candidate markers in this prospective study. We found that CSF levels of NfL and pNfH are elevated in MND, thus enabling a sensitive and specific discrimination of patients with initially clinically suspected MND that turn out to be some other disease later on during the course; this confirms findings gathered in mostly small-scale and retrospective studies.7 ,8 In particular, a high positive predictive value could be found for these biomarkers qualifying them as confirmation markers for suspected MND. This not only holds true for patients within the direct differential diagnosis, but also within a wider diagnostic spectrum. Negative results for these markers, however, do not rule out MND diagnosis.
NfL and pNfH are of value in the differential diagnosis of MND as single biomarkers since sensitivity and specificity are within the CIs of each other. In our limited number of follow-up measurements, NfL tends to decrease in the CSF of patients with MND. Additionally, Nf levels are high shortly after disease onset. These data suggest that Nfs can be used even for early diagnosis.
Nf levels were associated with MND disease progression and disease duration, and potentially qualify as prognostic markers, which is in accordance with earlier studies.9 ,10 ,13 ,15 ,30 The broad range of Nf values in the MND group, however, might speak against a general applicability of CSF-Nf as disease stage biomarker when longitudinal values are missing. This should be investigated further. As our main interest was to find a diagnostic marker for MND, we focused on CSF biomarkers especially as there are now commercial immunoassays available that are consistently sensitive and validated for CSF in multicentre studies5 and more importantly, as standardised procedures for obtaining and processing CSF are now recommended and commonly accepted.4 ,31
The benefit of longitudinal data especially in the prognosis makes serum measurements favourable. Recently, data on the predictive validity of increased NfL levels in the blood of patients with ALS was published.32 In this two-centre study, the NfL serum or plasma levels measured with an electrochemiluminescence assay (as yet not purchasable) strongly correlated with CSF levels, remained stable during disease progression, and correlated with the survival. The Nf ELISAs used in our study were not suitable for measurement of serum samples due to higher detection limits and matrix effects. It has to be investigated whether NfL blood levels are also qualified for the discrimination of MND and relevant differential diagnoses as has been shown for NfL and pNfH in our present study. We also have to raise the question of the origin of Nf in CSF. The highest concentrations of Nf are found in large myelinated axons33 and these are presumably shed into the extracellular space and CSF following neuroaxonal damage. Consequently, the extent of neuroaxonal damage should be reflected by elevated Nf concentrations and there should be a correlation of Nf with the disease state. This should also hold true for Tau, another cytoskeletal axonal degeneration marker, for which increased levels in ALS and a correlation with disease stage have been published.34 ,35 We, like others,8 ,36 found no increase of Tau or pTau in the CSF of patients with MND and no correlation of Nf or Tau levels with FA-CTS as a marker of axonal integrity, in contrast to recently published results;37 this suggests that more complex conditions influence the levels of Nf and Tau in the CSF. Instead of a continuous degeneration, a cell-specific increase and stable turnover of Nf may occur.38 Additionally, disease specific dysregulation of kinases and phosphatases,39 and involvement of axonal transport mechanisms may play a role, which in combination with synthesis and proteolysis might contribute to different patterns of cytoskeleton molecules in the CSF.
One control case with a very high albumin ratio presented with very high Nf levels and therefore, we had a closer look at false positive Nf cases and the albumin ratio. There was no correlation of Nf levels with the albumin ratio, although high albumin levels and high Nf levels can occur in the differential diagnosis of a chronic inflammatory PNP. Therefore, we suggest also measuring these standard CSF markers to exclude other diseases. In contrast to recent observations on a much smaller cohort of patients with ALS (n=51),34 pTau and Tau concentrations did not show a specific profile in our large cohort and were only elevated in patients with AD. These deviating findings are most likely due to the small sample size as well as the selection of patients with tauopathy as controls. Comparing the diagnostic performance of Nf for MND to Tau, pTau and Abeta (amyloid beta) peptides in AD, the values are similar (perhaps even better) for the diagnostic application of Nf in MND.16 ,40
In conclusion, we suggest that Nf measurements are included in the diagnostic work-up of patients with ALS, not only to ensure that the diagnosis is likely even at disease onset but also to direct the differential diagnosis towards other disease if Nf levels are not elevated. Nfs correlate with MND progression and the applicability of Nf as prognostic marker in clinical routine should be investigated further.
Acknowledgments
The authors especially thank Alice Pabst, Dagmar Schattauer, Sandra Hübsch and Mehtap Bulut-Karaca for their technical assistance and our patients for participating in these studies.
References
Supplementary materials
Supplementary Data
This web only file has been produced by the BMJ Publishing Group from an electronic file supplied by the author(s) and has not been edited for content.
- Data supplement 1 - Online supplement
Footnotes
PS and EF contributed equally to this study.
Contributors All authors made substantial contributions to conception and design, and/or acquisition of data, and/or analysis, and interpretation of data. The first draft was written by MO, PS and EF, followed by critical revision of all authors. All authors gave final approval of the version to be submitted. All authors agree to be accountable for all aspects of the work in ensuring that questions related to the accuracy or integrity of any part of the work are appropriately investigated and resolved. PS, EF, JW, JB, HT, PMA, CAFvA, SB, JK, CK, DL, H-PM, EP, PO, AR, SA-S, AEV, PW, ACL, MO were involved in the sample collection, phenotyping and data management; MO, ACL were involved in the study management and coordination; PS, EF, RM, MO were involved in the statistical methods and analysis; PS, EF, MO were involved in the manuscript writing.
Funding This work was supported by BMBF (Ministry of Science and Technology): Competence net neurodegenerative dementias (project: FTLDc), competence net multiple sclerosis (KKMS), MND-Net, the JPND networks for standardisation of biomarkers (BiomarkAPD, Sophia) and the JPND project NEEDSinALS, PreFronals, the EU (NADINE), foundation of the state of Baden-Württemberg and foundation Thierry Latran and BIU (Boehringer Ingelheim Ulm University BioCenter).
Competing interests None declared.
Ethics approval Ethics committee of the University of Ulm (proposal number 20/10, year 2010).
Provenance and peer review Not commissioned; externally peer reviewed.
Linked Articles
- Editorial commentary