Article Text

Abstract
OBJECTIVES To assess whether multiple sclerosis lesion volume measurements derived using the fast fluid attenuated inversion recovery (fFLAIR) sequence show better reproducibility or correlation with disability than those derived using the conventional spin echo (CSE) sequence.
METHODS Part I: twenty five patients with multiple sclerosis were scanned with CSE, fast spin echo (FSE), and fFLAIR. Lesion volume was determined twice for each sequence using a local threshold segmentation technique. Part II: fifty six patients with multiple sclerosis were scanned with CSE and fFLAIR. Total and regional brain lesion volumes were compared with the Kurtzke extended disability scale (EDSS) and functional systems scores (FSS).
RESULTS Part I: analysis times were significantly longer for CSE than for FSE or fFLAIR. There was no significant difference in the reproducibility of the three sequences. Part II: total lesion volumes were similar but posterior fossa lesion volumes were significantly greater for CSE and subcortical lesion volumes significantly greater for fFLAIR. There was a significant correlation between total volume and EDSS with both sequences (CSEr=0.49; fFLAIR r=0.44). Correlations for the two sequences showed minor differences when anatomical region and FSS were considered separately.
CONCLUSIONS CSE, FSE, and fFLAIR are equally reproducible; FSE yields lower volumes than CSE; fFLAIR gives similar volumes to CSE but underscores the posterior fossa. Overall clinical correlations are similar for CSE and fFLAIR.
- multiple sclerosis
- magnetic resonance imaging
- FLAIR
- fast spin echo
- conventional spin echo
- lesion volume
- disability
Statistics from Altmetric.com
- multiple sclerosis
- magnetic resonance imaging
- FLAIR
- fast spin echo
- conventional spin echo
- lesion volume
- disability
In recent years, measurement of the total lesion load or volume detectable lesions on MRI has become a widely used outcome measure for assessing the efficacy of new therapies in multiple sclerosis.1-3 Ideally, the MR sequence used for measurement of multiple sclerosis lesion volume in a clinical trial should be practical to acquire, convenient to analyse, reproducible (poor reproducibility will obscure small changes in volume), and the change in measured lesion volume should be predictive of outcome.
Currently the MR sequence most widely accepted for use in assessment of lesion volume in multiple sclerosis is a conventional moderately T2 weighted spin echo (CSE). Fast spin echo (FSE) gives similar images to CSE with shorter acquisition times but has been reported to give poorer reproducibility of lesion volume measurements.4 The fast fluid attenuated inversion recovery sequence (fFLAIR) is sensitive to white matter pathology,5-8 because the inversion pulse can be chosen to null the signal from CSF, and reduces the signal from grey matter allowing optimisation of lesion contrast with surrounding brain.9 Thus several groups have reported better lesion/brain contrast7 10 and greater lesion detection,6 particularly in the subcortical regions, using FLAIR sequences but, to our knowledge, no work has been published concerning the correlation of fFLAIR lesion volumes with disability. This has prompted our investigation of the suitability of the fFLAIR sequence in measuring total lesion volume in clinical trials of multiple sclerosis. In a preliminary study11 we found that although CSE and fFLAIR detect similar numbers of lesions overall, CSE detects more posterior fossa lesions and fFLAIR detects more cortical/subcortical lesions.
The investigation is in two parts: firstly, the ease and reproducibility of lesion volume measurement was compared with that of CSE and FSE; and secondly, the volumes obtained using fFLAIR and CSE were compared for their correlation with patient disability.
Patients and methods
PATIENTS AND SCANS
Reproducibility study
Twenty five patients with clinically definite multiple sclerosis12 underwent brain MRI using a 1.5 Tesla Signa (General Electric, Milwaukee, WI). In each case, contiguous 5 mm oblique axial slices (parallel to the inferior margins of the corpus callosum) were acquired using three sequences: CSE, FSE, and fFLAIR (table 1). All sequences used a 2562 matrix and a 28 cm field of view. The FLAIR sequence was developed from the sequence described by Rydberg et al,7 and fulfilled criteria for optimisation of multiple sclerosis lesion/brain contrast.9 Regional non-uniformity of the images (arising from local magnetic field inhomogeneities) was corrected using information from oil phantom scans following the method described by Wicks et al.13
Summary of sequences used
Correlation study
The subjects were 56 patients with clinically definite multiple sclerosis12: 31 of these patients were included in a previous study.11 Table 2 shows details of patients’ age, disease type, and disease duration. Each patient was examined clinically within two weeks of the scan and their Kurtzke expanded disability status scale (EDSS), and functional systems scores (FSS)14 determined. Each was scanned using CSE and fFLAIR (as above). Regional non-uniformity correction was performed (as above).
Clinical details of patients included
The study was approved by the local medical ethics committee, and all subjects gave informed consent.
LESION VOLUME ANALYSIS
Reproducibility study
Lesions were identified by a radiologist (MGC) and marked with a rough outline on the computer images (RO marking). Guidelines were used to aid lesion identification: for CSE, the guidelines were formulated by a European collaborative group (Filippi et al, in preparation) and are described in the ; for fFLAIR the guidelines are described by Gawne-Cain et al.15
In all three sequences, lesion volume was determined twice (MGC, sessions separated by at least two weeks) using a local threshold segmentation technique, known as “contouring” (David Plummer, University College, London, UK).16
Because of concern that noise in the fFLAIR images might make volume measurements less reproducible, the analysis was repeated after image noise reduction (anisotropic diffusion, biased, 15%, ANALYZE version 7.5 Biomedical Imaging Resource, Mayo Foundation).
We thought that RO lesion identification might influence the reproducibility of the final measured volume, and investigated this by performing the fFLAIR part of analysis a third time using simple indication of the presence of each lesion (SI marked). For convenience, the marks were made on the hard copy (rather than electronically).
A subset of images (CSE, RO marked, and filtered fFLAIR, SI marked) were analysed twice by a second observer (BN).
Correlation study
Because of the results of the first part of the study, image noise reduction was not employed. Lesions were identified on electronic images and their volume measured by a single observer (MGC). Guidelines for lesion identification were used as above. Each lesion was classified as either brainstem, cerebellar, subcortical (lesion touching cerebral cortical grey matter), periventricular (touching lateral or IIIrd ventricle), or discrete (within cerebral white matter).
STATISTICAL ANALYSIS
All statistical analysis was performed using a standard statistical package (SPSS for Windows 6.1).
Reproducibility study
Coefficients of variation (CVs) were calculated in two ways. CV1 is the mean of CVs calculated for each individual patient using the formula CV=SD of volumes/mean volume.17Because the size of the error was proportional to the size of the measurements, CV2 was derived from pooled data after logarithmic transformation. CV2 = aςω-1where aςω is the antilog of the within subject SD of logarithmically transformed data. This was calculated using simple factorial analysis of variance (ANOVA).18 19 Comparisons between different sequences were made using the Wilcoxon rank test for paired data.
Correlation study
The EDSS is not a linear scale, thus correlations between measured lesion volume and disability were assessed using Spearman’s rank correlation.
Results
REPRODUCIBILITY STUDY
The CVs using RO marking were similar for all sequences (CV1 3.0–3.3, CV2 4.2–4.9%) and were higher using SI marking (CV1 6.9, CV2 10.5%, table3).
CV, measurement times, and lesion volume of CSE, FSE, and fFLAIR
With RO lesion marking, the highest lesion volumes for the 25 patients in this study were obtained using CSE (median 20.2, range 1.4–82.50 cm3). These volumes were similar to those for fFLAIR (without image noise reduction, median 20.1, range 1.7–87.8 cm3, p=0.06). The volumes obtained using FSE were significantly smaller than all other sequences (median 16.9, range 1.6–70.3 cm3, p<0.03). Noise reduction made no significant difference to the fFLAIR volumes (median 19.9 cm3, p=0.5) but hard copy marking resulted in higher volumes (median 22.7 cm3, p=0.0004).
Analysis times were significantly longer for CSE and hard copy marked fFLAIR than for other sequences (table 3).
CORRELATION STUDY
One patient’s CSE was excluded from analysis because of excessive movement artefact. Figures 1 and 2 show the distributions of EDSS scores. Figure 3 shows the differences between total disease volume according to CSE and fFLAIR measurements (first rating, MGC) plotted against the mean volumes. In this group of 56 patients the lesion volumes for CSE (median 17.32 cm3) and fFLAIR (median 15.19 cm3) did not differ significantly (p=0.5, Wilcoxont test for paired data) but the CV1 between the two sequences was high at 17% (SD 15%, table 4). On CSE scans, regional volumes were significantly greater for brainstem, cerebellum, and discrete cerebral white matter lesions, but fFLAIR measured a higher volume of cortical/subcortical lesions (table 4).

Histogram of all patients included in the correlation study (n=56), showing the number of patients with each Kurtzke extended disability status scale score. Scores range from 0 (normal neurological examination) to 8.0 (essentially restricted to chair/wheelchair all day). The maximum possible score is 10—death due to multiple sclerosis.
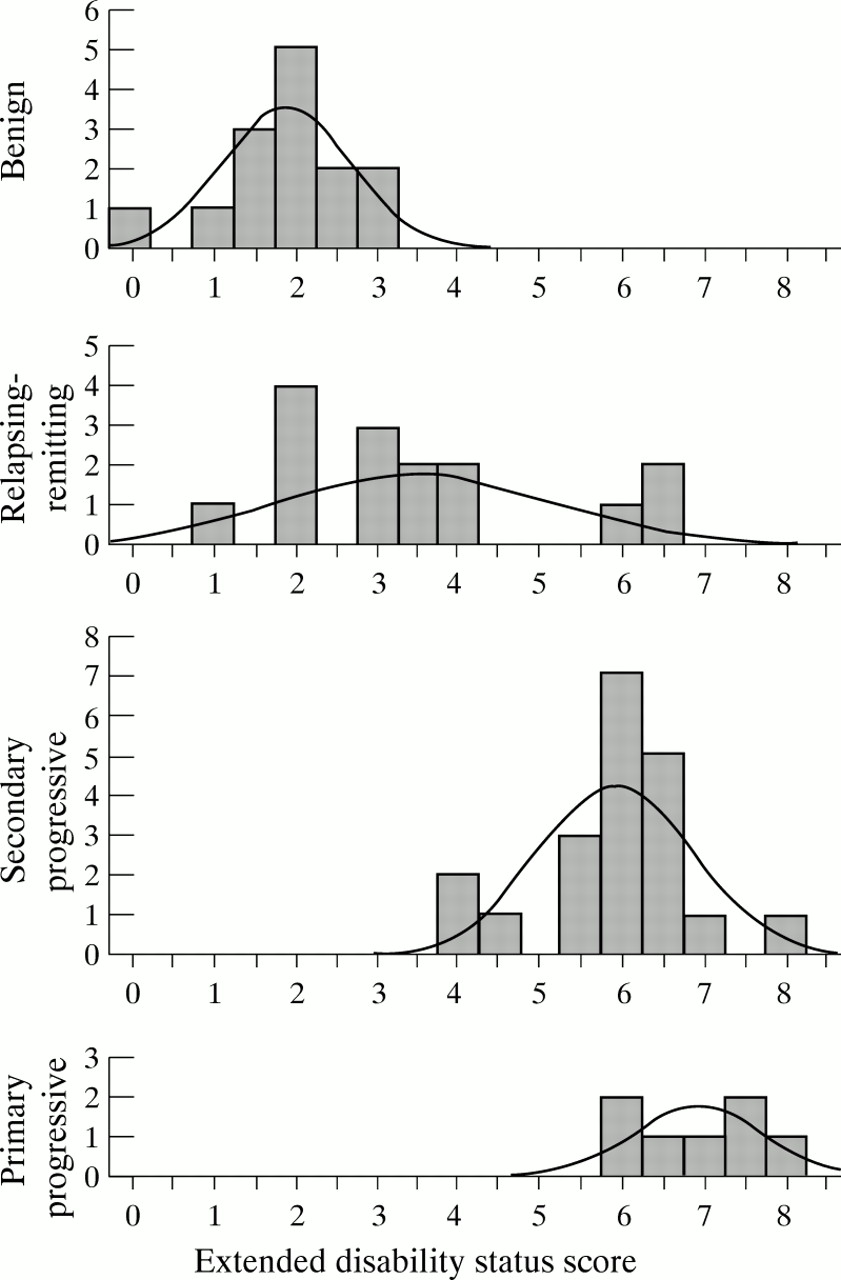
Breakdown of EDSS of patients according to disease subtype. The disability scores are lower (less disabled) for benign multiple sclerosis (which by definition has an EDSS score⩽3.0). The scores tend to be higher for progressive multiple sclerosis than for relapsing-remitting multiple sclerosis.

Differences between volumes measured using CSE and fFLAIR in the correlation study (n=56, measurements made by a single observer) plotted against the mean of the volumes measured using each method.
Comparison of volumes measured with CSE and fFLAIR
Considering all disease groups together, Spearman rank correlations between total lesion volume and EDSS were similar for CSE (r=0.49, p<0.001) and fFLAIR (r=0.44, p=0.001). When disease groups were considered separately, only the relapsing-remitting group showed significant correlations (CSEr=0.54, fFLAIR r=0.55, p<0.05, table 5). Cerebellar, brainstem, pyramidal, and sphincter functional scores each showed correlation with more than one regional volume, the strongest correlations being between cerebellar scores and posterior fossa volumes and between pyramidal scores and periventricular volumes (table6). The poorest correlations were with subcortical lesion volumes; CSE and fFLAIR gave similar results with some minor variations (table6).
Correlation of measured lesion volume with EDSS (Spearman’s rank correlation)
Correlation of regional multiple sclerosis lesion volumes with Kurtzke functional systems score and EDSS (Spearman’s rank correlation)
Discussion
Whereas CSE is a relatively straightforward sequence, describable by TR and TE, FSE and fFLAIR employ RARE technology and are more complicated, varying greatly in design even when the stated TI, TR, and effective TE are identical. This is why many workers have been slow to adopt them for trial purposes despite their faster acquisition times. As well as difficulties in standardisation between the various centres participating in a trial, there are suspicions that the images obtained might be in some way substandard: RARE images might give more flow artefact7 and blurring of boundaries20 21resulting in decreased lesion detection or poorer reproducibility. Our previous studies have confirmed that these sequences detect different lesions11 22 and have suggested that reproducibility of FSE measurements is poorer.4 For trial purposes, a most important aspect of a sequence’s performance is how the images correlate with the clinical situation—usually disability. The current study, therefore, examined the correlation of fFLAIR lesion volumes with disability, and also reviewed the reproducibility of fFLAIR and FSE images compared with CSE. The FSE images were used in this part of the study as an example of a RARE sequence without an inversion pulse.
REPRODUCIBILITY STUDY
Analysis time and absolute volumes
We found analysis time for fFLAIR and FSE to be faster than CSE (table 3, p<0.05), as have other workers.23 For the fFLAIR images this might be due to shorter editing times: CSE images often require more editing because of over-inclusion of relatively bright grey matter. For the FSE images it might reflect the lower volumes measured. Our times may have been influenced by the order of analysis as CSE was the first sequence to be processed. The analysis times of this study (4–30 minutes) were unusually quick. Routine analysis of CSE at this centre usually takes 45–60 minutes which is very slow in the context of a large trial. Although these findings were for the “contour” technique, fFLAIR might be expected to have a similar advantage over CSE with other segmentation techniques employing local or general thresholding.
Volumes measured
FSE gave significantly lower volumes than CSE or fFLAIR. This is in agreement with an earlier study.4 fFLAIR volume derived from SI marking gave larger but less reproducible volumes. Possible reasons for this are discussed below. A larger lesion volume is not necessarily better: correlation with disability is more important.
Reproducibility
The CV of the three sequences did not differ significantly (table3). The reproducibility of a measurement technique is important, especially when it is to be used to detect small changes over time. The CV is used because it can be related to the clinical situation—it expresses error as a proportion of the true value. The CV2values were higher than CV1 and this increased value from pooled data has been noted before.24 All CV values were higher than previous reports using the same lesion outlining technique4 24 25 and this is likely to reflect rater and patient differences. Using the same outlining technique, greater within rater differences in CV are seen between different raters (compare mean CV1 of CSE of 3.0 this study and 1.4 in Rovaris et al 4) or the same rater on a different set of patients (compare this study with median CV1 of CSE of 1.7% in Gawne-Cain et al 24) than between the different sequences in this study. As expected,between rater CVs were higher and it is our practice to use the same rater for analysis of serial scans. The findings of this study differ from our earlier report that CVs for FSE were significantly higher than those for CSE.4
Image preparation
Two variations of the image preparation protocol were examined. Firstly, because the fFLAIR sequence has been found to give rather noisy images,7 we assessed postacquisition image noise reduction. The “contour” algorithm (the segmentation technique routinely used at this centre) traces the signal intensity gradient along a lesion boundary and is most successful when that gradient is steep. Noise in the image will tend to reduce the gradient giving less sharp boundaries. In some sequences this can be a problem when a lesion lies close to normally higher signal structures, such as grey matter, because the algorithm will tend to include this normal structure as “lesion” necessitating extensive editing by the rater and increased analysis time. For this reason we had hoped that noise reduction might give shorter analysis times, but unfiltered fFLAIR times were already shorter than those for CSE (see discussion above) and noise reduction gave no further improvement. As a result of this analysis, the correlation part of the study was performed without noise reduction.
The second variation was in the method of lesion marking. For many trial protocols, a radiologist is required to identify lesions. Lesion segmentation has two parts, lesion identification and boundary definition. SI marking leaves the rater more freedom in boundary definition than RO marking. We might predict that the method of marking would influence the reproducibility and this was confirmed by the finding that SI marking gave significantly higher CVs.
Why did SI marking result in longer analysis times and larger volumes? The decision about exactly where to put the lesion outline can be difficult, as there may be several alternatives.The guidelines used for this study (see ) are that the lesion boundary should be “conservative”. When no outline has been indicated the rater has to choose where it should be (giving longer analysis time) and, in attempting to avoid false negatives, may draw the lesion larger than the radiologist intended.
CORRELATION STUDY
Total volume
Change in MRI lesion volume is a well established secondary outcome measure in clinical trials of multiple sclerosis.1 3 26 27 Because new lesions and increase in disease volume have been associated (albeit weakly, r = 0.13–0.23) with increase in disability,28-30 it is expected that if a drug reduces the normal increase in disease volume it will have a beneficial effect on disease. Longitudinal studies take time, and a preliminary step in assessment of a technique is to examine the cross sectional correlation of measured lesion volume and disability. This is the first study to have examined this for the fFLAIR sequence. In a group of 56 patients with multiple sclerosis we have found a significant correlation. Our findings ofr=0.49 (CSE) and r=0.44 (fFLAIR), increasing to r=0.54 (CSE) and 0.55 (fFLAIR) when relapsing-remitting patients were considered separately, compare well with previous reports using CSE. Very early studies failed to find any correlation at all between CSE lesion load and disability.31 More recently, several groups, using more accurate measurement methods, reported correlation values of r=0.23–0.331 32-34for T2 lesion volumes in mixed multiple sclerosis populations and as high as r=0.57 for a homogenous cohort of relapsing-remitting patients.35 In the current study, the relapsing-remitting group showed a much greater range of EDSS scores than other groups and this may have improved the correlations; when other disease subtypes were also considered separately, no correlation was identified. The image identification guidelines used were developed to reduce between rater variation for lesion identification and the improved correlations achieved in this study may partly be due to their use. The next step in validating the fFLAIR sequence, an examination of the longitudinal correlation of lesion volume with disability, is now underway.
Correlations for T2 volumes remain weak, whatever the exact sequence used, and we should continue to seek alternative measures. For example, there have been promising reports of T1 weighted images giving better correlations than CSE.34
Regional volumes
In the earlier study of fFLAIR sensitivity for multiple sclerosis lesions,11 CSE detected more posterior fossa lesions and fFLAIR more cortical/subcortical lesions. It is not surprising, therefore, that in the current study, the volume of posterior fossa lesions is greater in CSE and the volume of subcortical lesions is greater in fFLAIR (table 4). It has been reported that heavily T1 weighted lesions in the periventricular regions may disappear on FLAIR images36 and in this context it is notable that we found no significant difference in periventricular lesion volumes. This may be because such high T1 lesions are embedded in high signal areas on fFLAIR images and are therefore measured. Our previous study found that the two sequences detected similar numbers of lesions overall, and the present study found that they measured similar total volumes. Our results differ from those of a smaller study (seven patients) which reported higher volumes with the fFLAIR sequence, and no difference between the sequences in the posterior fossa.23 The explanation for these discrepancies is uncertain. Two possibilities are that they reflect differences in fFLAIR sequence parameters or differences in sample size.
Do these differences between the two sequences have any impact on the relation of MR volumes with clinical disability? EDSS showed a correlation with lesion volumes in each separate anatomical region, the strongest being with periventricular and posterior fossa volumes and the weakest with subcortical volumes. The highest FSS correlation was with posterior fossa and cerebellar volumes. fFLAIR measured fewer posterior fossa lesions (lower volume) but the strength of the correlation was similar for both sequences suggesting that fFLAIR identified lesions which were clinically eloquent. Certainly, the lower volume of posterior fossa lesions detected by fFLAIR did not seem to be a disadvantage. The increased ability of fFLAIR to detect subcortical lesions conferred no advantage for correlation with motor disability.
Pyramidal function correlated with all anatomical regions in a manner similar to EDSS, which is perhaps not surprising as EDSS depends heavily on mobility. Our impression was that only a minority of patients had definite internal capsule lesions, but pyramidal function correlated particularly with the periventricular and posterior fossa regions. Not surprisingly there was no correlation of any volume with visual function and the lack of a relation with the cognitive scale probably reflects the acknowledged inadequacy of that functional score. Further studies correlating regional volumes with neuropsychological function would be of interest, specifically to determine whether the increased subcortical volumes seen on fFLAIR might improve the correlations.
Multiple sclerosis is a disease scattered throughout the neuraxis and Kurtzke37 showed that increasing DSS is associated with increased involvement and severity in each of the functional systems. We found correlations of volume in each anatomical region with overall volume and each FS score with EDSS, and it is therefore not really surprising that so many cross correlations of anatomical region volumes with FS scores were demonstrated. It seems that the measured lesion volume in one anatomical region is in general representative of the amount of disease elsewhere and this raises doubts as to whether routine measurement of regional volume in addition to total lesion volume is necessary.
The “contour” technique for lesion segmentation was used in this study because it has been found to give better reproducibility than manual outlining25 and is the technique currently being used in a large European multicentre treatment trial.2 It is readily applied to fFLAIR images, and gives analysis times and reproducibility comparable with other sequences. Using CSE images we have found global thresholding and clustering techniques disappointing because segmentation of normal structures with lesions leads to extensive editing. The reported increase in lesion/brain contrast possible with fFLAIR might reduce this problem of overinclusion and the suitability of fFLAIR for other segmentation techniques warrants further investigation.
In conclusion, we found fFLAIR images faster to acquire and process than CSE images, but they conferred no significant advantage in reproducibility or correlation with disability. The total lesion volumes measured were not significantly different. We confirmed our earlier report that fFLAIR gives a lower volume of posterior fossa and higher volume of subcortical lesions than CSE, but these differences do not significantly affect correlations of lesion volume with disability. Further longitudinal studies are underway to determine how well changes in measured lesion volume correlate with change in disability.
Acknowledgments
We acknowledge Drs SJ Riederer and JN Rydberg of the Mayo Clinic for providing the fFLAIR pulse sequence. The Institute of Neurology NMR Research Unit is funded by the Multiple Sclerosis Society of Great Britain. MGC and JOR’s posts were funded by Schering AG. We thank DG MacManus, SR Webb, and H Gallagher for performing the scans.
Guidelines for multiple sclerosis lesion outlining
derived from Filippi M, Gawne-Cain ML, Gasperini C,et al. The effect of training and different measurement strategies on the reproducibility of brain MRI lesion load measurements in multiple sclerosis. Neurology 1997 (in press).
(1) Posterior fossa—In the posterior fossa, flow related artefacts can easily mimic multiple sclerosis lesions. Thus, inclusion of areas of hyperintensity in lesion volume measurements when they are close to clearly evident artefacts should be avoided, unless a high degree of certainty is met using adjacent slices, or the corresponding T2 weighted images, or both.
(2) Periventricular regions—In periventricular regions, there are normal structures which appear hyperintense on PD weighted images. Nevertheless, multiple sclerosis lesions occur more often in these areas. Therefore the following areas of hyperintensity should be included in the measurements: (a) periventricular “caps” around frontal horns (they should by excluded only when they are very small and symmetric); (b) hyperintense rims around ventricles. The subcallosal/septum pellucidum hyperintensity should not be included.
(3) Cortical/subcortical areas—An equivocal area of hyperintensity in or close to the cerebral cortex should be considered as a lesion in the following cases:
(a) when they are as bright as grey matter if a rim of white matter is visible around them; (b) when they are brighter than the grey matter if directly adjacent to it.
In addition, the adjacent slices and the morphology of the area should be checked to minimise the likelihood that the region is in fact cortex.
(4) Definition of the number of lesions when two or more areas of increased signal are adjacent—Two or more regions of interest (ROIs) should be identified if a complete rim of normal appearing white matter separates two or more areas of hyperintensity. If not, only one ROI should be outlined.
(5) Presence of normal appearing white matter in the middle of large confluent lesions—If there is no connection between normal appearing white matter in the middle of large, confluent lesions and normal appearing white matter around the lesion, this should be included in the corresponding ROI.
(6) Definition of lesion boundaries—For the “contouring” method it is often possible to obtain two different outlines, one inner and one outer, according to where the pointer is clicked. The most conservative estimate—that is, the inner outline—should be used.