Article Text

Abstract
OBJECTIVE To determine non-invasively the relation between the degree of axonal loss and the extent of demyelination in chronic lesions visible on MRI in patients with different subgroups of clinically definite multiple sclerosis using 1H magnetic resonance spectroscopy (1H MRS) and magnetisation transfer imaging (MT). Conventional MRI is unable to differentiate between the various pathological processes occurring in the multiple sclerosis lesion. There are, however, newer MR techniques which show promise in this respect.
METHODS 1H MRS and MT were performed in 18 patients with clinically definite multiple sclerosis who had a wide range of disability and disease duration.
RESULTS A significant correlation was found between a reduction in the concentration of N-acetyl aspartate (NAA; an in vivo marker of axonal loss or dysfunction) and a reduction in MT ratio (a probable marker of demyelination) in patients who had entered the secondary progressive stage of the disease. Patients with minimal disability after a disease duration of greater than 10 years—so called benign multiple sclerosis—showed a relative preservation of NAA and MT.
CONCLUSIONS Because a reduction in MT seems to be a relative marker for demyelination and a reduction of NAA from chronic lesions is indicative of axonal loss, this study supports the hypothesis that demyelination and axonal loss occur in the same chronic multiple sclerosis lesions. In addition, the degree of axonal loss and demyelination correlates with clinical heterogeneity.
- magnetisation transfer
- 1H magnetic resonance spectroscopy
- N-acetyl aspartate
- multiple sclerosis
Statistics from Altmetric.com
Although conventional MRI is sensitive in detecting the lesions of multiple sclerosis, it is not able to show changes that are specific for individual pathological processes such as demyelination or axonal loss.1 Proton magnetic resonance spectroscopy (MRS) is a nuclear magnetic resonance technique which has the potential to detect axonal loss non-invasively during life. The normal proton spectrum is dominated by N-acetyl derived groups (NA) (the sum of N-acetyl aspartate and N-acetylaspartylglutamate). The predominant component of the NA peak is N-acetyl aspartate (NAA),2 an amino acid of unknown function, which has been shown in experimental studies on primary cell cultures from neonatal rat brains and optic nerves to be contained almost exclusively within neurons.3 Although NAA is also present in oligodendrocyte progenitor (O2A) cells, these are only present in very small numbers in healthy adult human brain4 and are thus unlikely to contribute significantly to the concentration of NAA. A loss of neurons (cell bodies and axons) would thus be predicted to cause a persistent reduction in the concentration of NAA. Such a reduction has been reproducibly demonstrated in several diseases characterised by neuronal loss.5-7 There is now an extensive literature showing a reduction of NAA from acute lesions (where it may be partly reversible, suggesting axonal dysfunction rather than loss),8-11chronic multiple sclerosis lesions,8 12 and from areas of normal appearing white matter.10 13-15 Furthermore, the degree of NAA reduction (and therefore axonal loss) seems to be most marked in those patient groups with greatest neurological disability.15-18 1H MRS is also able to detect myelin breakdown products after acute demyelination.10 19 20 These products resolve over time10 and it is not yet possible with this technique to gauge the degree of demyelination that has occurred nor indeed the extent of remyelination.
The tecnique of MT is a nuclear magnetic resonance technique which relies on the transfer of energy between highly bound protons within structures such as myelin and the very mobile protons of free water.21 This effect can be quantified as an MT ratio —and shows promise in being able to differentiate between the MRI changes of demyelination22 23 from that of oedema.22 Dousset et al 22 were able to show a modest reduction of the MT ratio from brain lesions in guinea pigs after the induction of experimental allergic encephalomyelitis (a condition in which there is inflammation and oedema in the absence of demyelination). By contrast, a significant reduction in the MTR was seen from lesions in patients with multiple sclerosis. Gass et al 23 have shown that the degree of MT ratio reduction in patients with multiple sclerosis correlates with clinical disability indicating that a low MT ratio is indicative of a more destructive pathological process. It has been proposed therefore that MT imaging provides information about the integrity of myelin.
A comparative study using MRS and MT was performed in chronic lesions to assess (1) whether axonal loss and demyelination occur together in the same lesions and (2) to determine the relation between the degree of axonal loss and demyelination and clinical heterogeneity.
As a pathological control we have also carried out MT and1H MRS in a patient with central pontine myelinolysis—a disorder which is characterised pathologically by demyelination in the absence of axonal loss.24
Patients and methods
Magnetic resonance imaging, MT imaging, and MRS were carried out in 18 patients with clinically definite multiple sclerosis.25 This group comprised patients with a wide range of disability (range 2.0–8.0. median 5.0) and disease duration (range 2–25 years, median 7 years, table).
Magnetic resonance imaging, MRS, and MT were performed with a 1.5 T. GE signa whole body scanner using a standard quadrature head coil. The study commenced with a T2 weighted fast spin echo imaging sequence (TR 5000 ms, TEf 80 ms) (5 mm slices with 2.5 mm gap, 256×256 matrix, echo train length 8). After imaging, a volume of interest localised to a periventricular white matter lesion was prescribed ranging in size from 3.5 to 5 ml. The size and shape of each volume was adjusted to minimise partial volume effects. Lesions were chosen which had not altered on conventional MRI for 12 months or more and which were large enough to fill 70% or greater of the spectroscopic volume.
An MRI of the voxel was then obtained to ensure accurate localisation. Water suppressed 1H spectra were obtained using a STEAM sequence.26 27
Magnetic resonance imaging, MRS, and MT were also carried out in the brainstem from one patient with a clinical diagnosis of central pontine myelinolysis. The findings in this patient were compared with MRS and MT results collected from the brainstem in five healthy controls.
Acquisition parameters were repetition time (TR) 2.135 ms, mixing time (TM) 12 ms, TE 135 ms; 256 averages were collected using an 8 step phase cycle in about 13 minutes. A total of 1024 points were collected, with a spectral width of 750 Hz. Spectroscopic data processing included 2 Hz line broadening for filtering, Fourier transformation, and zero order phase correction. Data processing included 1 Hz line broadening for filtering, Fourier transformation, and zero order phase correction. Peak areas were determined using a line fitting programme (“SA / GE”, GE Milwaukee WI, USA). Peaks were fitted to a gaussian line shape using a Marquardt fitting procedure. Absolute concentrations for the metabolites were calculated using the fully relaxed water signal as an internal standard of reference.28 Metabolite concentrations [met] were calculated from the equation:
[Met] = [H20] x 2/PI x T1corr×T2corr ×S0 MET / S0 H20×1/2R
Where S0 MET and S0 H20 denote the signal intensities for metabolites and water respectively and [H20] is the brain water concentration from the volume of interest. The water concentration from the voxel of interest was calculated by comparing the signal intensity from the proton density images in the putamen with the region of interest in the hemispheric white matter. The putamen was chosen as this region of the basal ganglia is not affected by heavy metal deposition in healthy controls. Furthermore, a study by Grimaud et al 29 has shown no evidence of hypointensity on T2 weighted images to suggest increased heavy metal deposition in the putamen of patients with multiple sclerosis. In the control groups the concentration of water in white matter has been taken as 39.75 M.30 The water concentration of grey matter has been taken as 45.5 M.30 T1corr and T2corr are T1 and T2 correction values based on published T1 and T2 times from parietal white matter for the metabolites studied.31Because absolute T1 and T2 values were not calculated for patients and controls, the term apparent concentration is used. 2/PI denotes the proton index and refers to the number of protons in each metabolite (three for NAA, three for creatine, nine for choline) The value of 2 represents the two protons in H2O. R=Rmetabolite−R water and accounts for different receiver attenuator settings.
Statistical analysis was performed with a Mann-Whitney confidence interval and test. Results are expressed as a median value together with the range and p value. A Spearman's rank correlation test was also used and results are expressed as an rvalue together with levels of significance.
MAGNETISATION TRANSFER
Magnetisation transfer images were obtained from the same lesions and areas of normal appearing white matter (NAWM) studied by spectroscopy in the patients with multiple sclerosis and in eight healthy age matched controls. Eight axial slices through the the hemispheres were obtained which covered the regions of brain from which MRS had been performed.
Dual spin echo images were obtained (spin echo=1,500/32/80, eight slices, 5 mm thickness, 2.5 mm gap, 256×128 matrix, scan time=10 min), with and without the application of a saturation prepulse to saturate the broad resonance of immobile macromolecular protons. The applied pulse was a four lobed, 64 ms sinc pulse, 2 kHz off water resonance. The energy deposited by this pulse ensured a good signal to noise in the calculated MT image. To ensure exact coregistration of the saturated and unsaturated images, scans with and without saturation were interleaved for each phase encoding step. From the two images—that is, without (Mo) and with (Ms) saturation pulse— quantitative MT ratio images were derived pixel by pixel according to the equation:
MT ratio = (Mo -Ms / Mo) x 100% units (pu)
Signal intensities in the calculated image represented the amount of MT between the free and bound water pool.21 32
Magnetisation transfer ratios were calculated on the proton density images from a volume corresponding to the spectroscopic volumes of lesions and NAWM described above.
Statistical analysis was performed with a Mann-Whitney confidence interval and test. Results are expressed as a median value together with the range and p value.
Results
There was a significant reduction of NAA and MT ratio value from the chronic multiple sclerosis lesions compared with the control group (median NAA 12.3 mM, range 10.77 mM-13.7 mM).
There was a significant correlation between a reduction in the absolute concentration of NAA from the chronic multiple sclerosis lesions (median 9.25 mM, range 3.5 mM-12.8 mM) visible on MRI and a reduction in the MTR (median 25.3 u, range 14.6–28.6 u) from the same lesion (p<0.002, r=0.71, fig1).
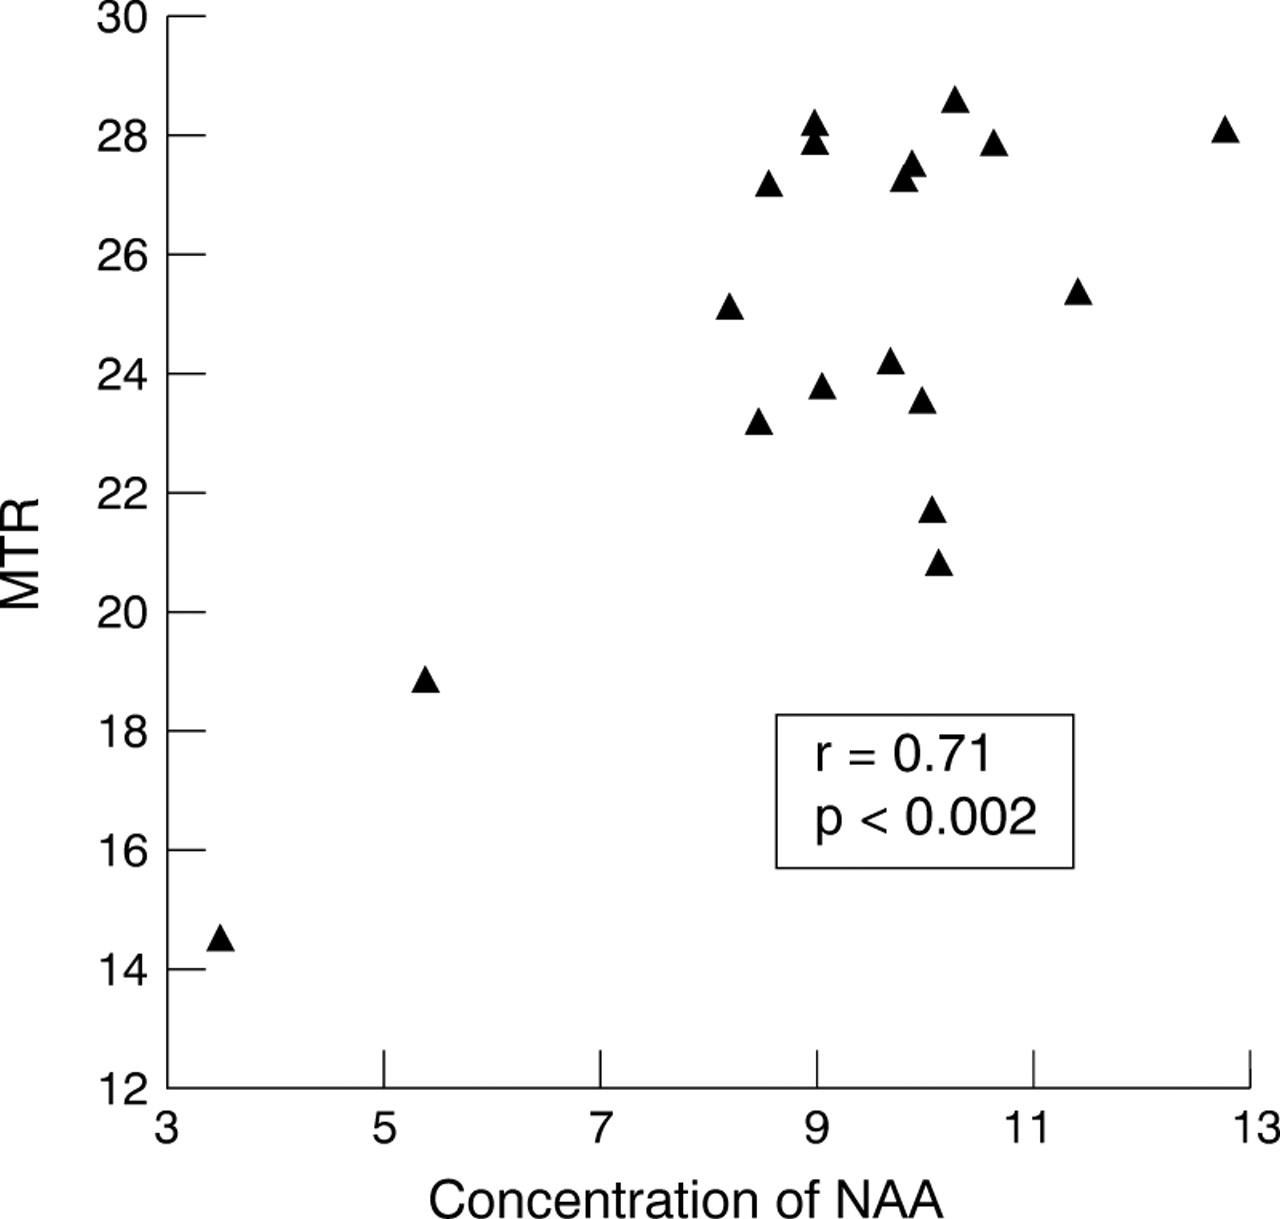
Scattergraph of concentration of NAA from chronic lesions visible on T2 weighted MRI from parietal white matter in all patients with multiple sclerosis (n=18) correlated against a reduction in the MT ratio (MTR) from the same lesions.
PATIENTS WITH SECONDARY PROGRESSIVE MULTIPLE SCLEROSIS
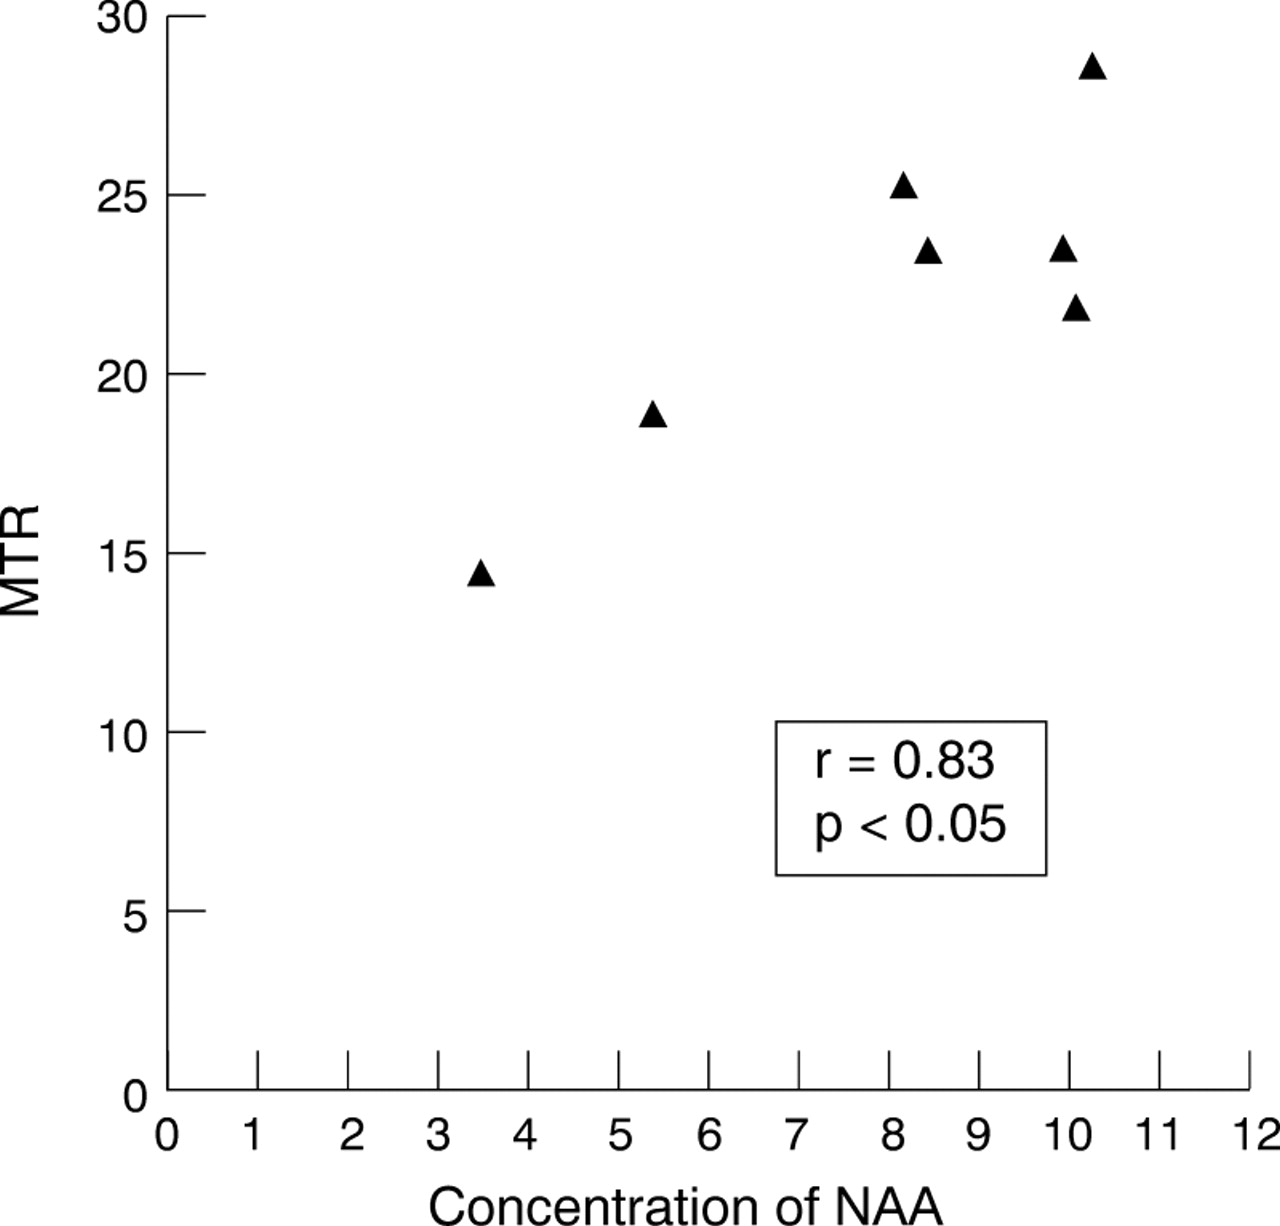
The patients with secondary progressive multiple sclerosis (n=7) showed a particularly strong correlation between concentration of NAA (median 8.47 mM, range 3.5 mM-10.3 M) and MT ratio (median 23.3 pu, range 14.6–28.6 pu) (r=0.833, p<0.05, figure 2).

Scattergraph of concentration of NAA from chronic lesions visible on T2 weighted MRI from parietal white matter in patients with secondary progressive multiple sclerosis (n=7) correlated against a reduction in the MT ratio (MTR) from the same lesions
PATIENTS WITH BENIGN MULTIPLE SCLEROSIS
The patients with benign multiple sclerosis (n=5) showed no significant correlation between concentration of NAA (median 9.9 mM, range 8.53 mM-12.8 mM) and the MT ratio (median 27.2 pu, range 25.4–28.2) (r=−0.16, p>0.5, fig3).
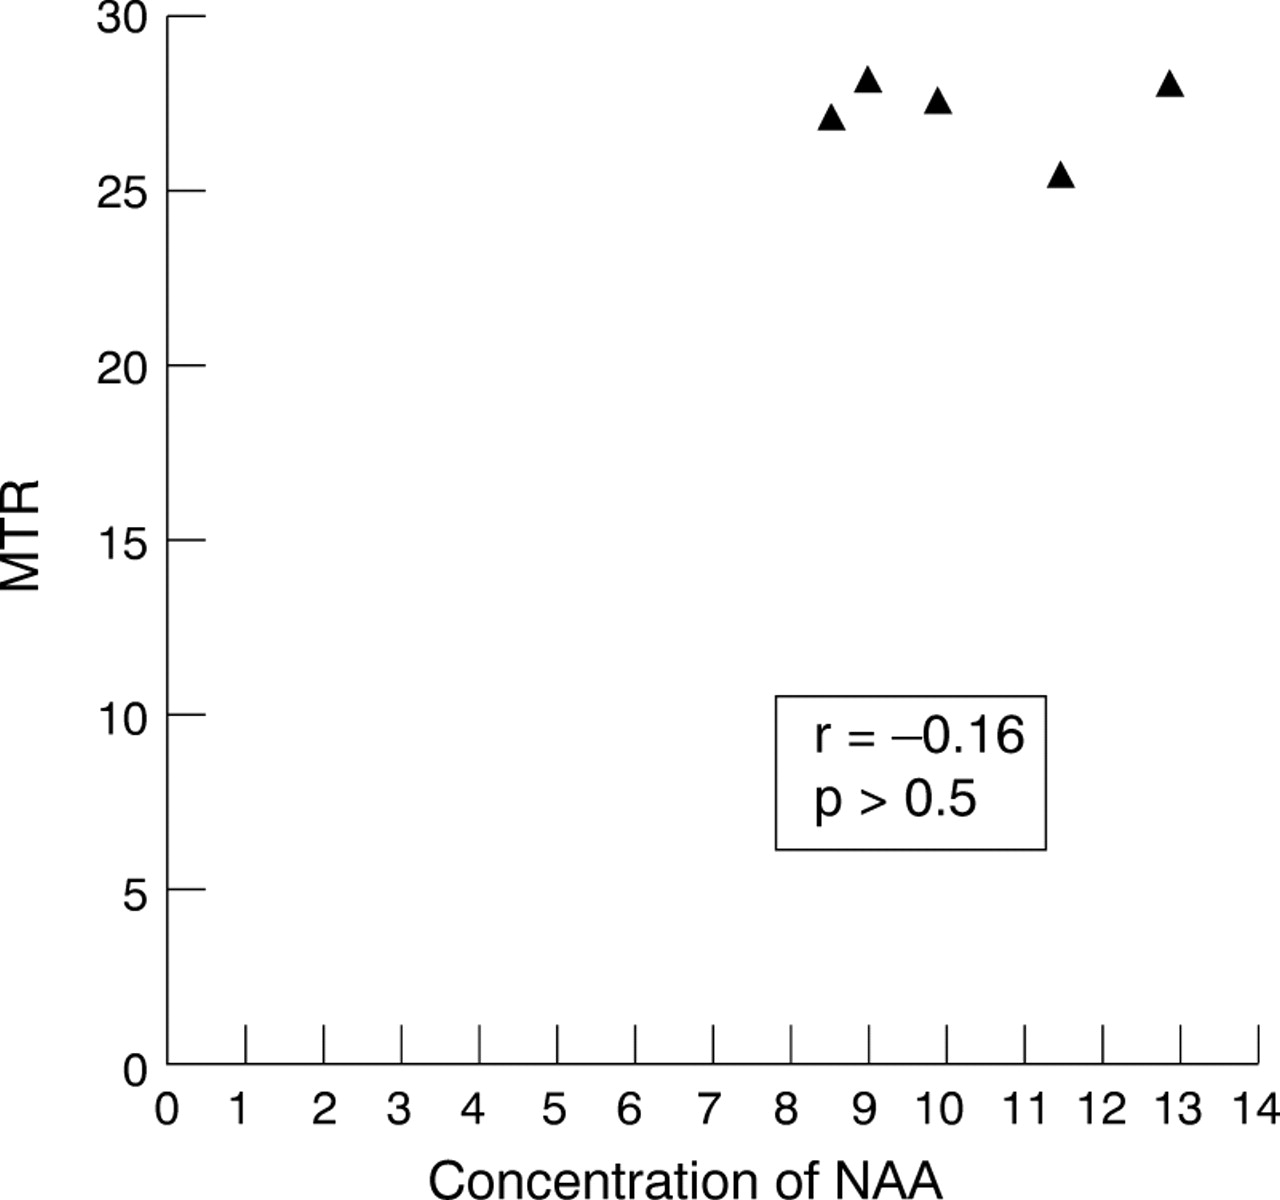
Scattergraph of concentration of NAA from chronic lesions visible on T2 weighted MRI from parietal white matter in patients with benign multiple sclerosis (n=5) correlated against a reduction in the MTR (MTR) from the same lesions.
CENTRAL PONTINE MYELONOLYSIS
1H MRS and MT was also performed in a patient with a clinical diagnosis of central pontine myelinolysis. A coronal T1 weighted image (fig 4) showed marked hypointensity in the pons. There was marked reduction of the MT ratio in the pons (mean lesion ratio,14.8, range 5.9–29.5 pu) compared with five age matched controls (mean 38.9 pu). However, there was preservation of the NAA/creatine ratio from the pons (fig 4) at 2.1 compared with five age matched controls (mean NAA/creatine 2.0, range 1.5–2.9) indicating axonal preservation in the patient with central pontine myelinolysis. It was not possible to calculate the absolute concentration of NAA from the pons in this patient because of insufficient information about relaxation parameters in this region of the brain.

MRI, MT, and MRS in a patient with central pontine myelinolysis. The top left image is an axial T2 weighted MRI showing high signal change within the pons. Top right is a T1 weighted coronal image showing very marked hypointensity from the same area within the pons. The 1H MR short echo spectrum (lower illustration) is taken from the localised volume (4 ml incorporating the area of signal abnormality within the pons. This shows normal signal intensity of NAA in keeping with axon preservation in the pons. There are also lipid resonances visible to the right of the NAA resonance consistentst with myelin breakdown products.
Discussion
The most important finding in this study is the strong correlation between a reduction in the absolute concentration of NAA and reduction in the MT ratio in chronic multiple sclerosis lesions from patients with secondary progressive multiple sclerosis. Furthermore, chronic lesions in patients with benign disease showed a relative preservation of NAA and MT ratio. These observations are contrasted with the findings in a known pure demyelinating lesion of central pontine myelinolysis in which the MT ratio was reduced33 and NAA/creatine ratio preserved.
A previous study by Hiehle et al 34 has looked at the correlation of1H MRS and magnetisation transfer in multiple sclerosis lesions and normal appearing white matter in multiple sclerosis. This was a study in 11 patients with clinically definite multiple sclerosis, nine of whom had relapsing-remitting disease, one had progressive multiple sclerosis, and one had benign disease. The authors failed to show a correlation between relative concentrations of NAA/creatine and MT ratio from multiple sclerosis lesions. This is perhaps not suprising given the results of the current study which show that the most marked correlation between a reduction in NAA and a reduced MT ratio occurs in patients with progressive disease. The positive correlation between MT ratio and NAA in patients with secondary progressive but not benign disease in the present study may indicate that the clinical pattern of disease in longstanding multiple sclerosis is a consequence of pathological heterogeneity within brain lesions.
The study by Hiehle et al 34 did show a significant correlation between the presence of so called “marker peaks” between 2.1 and 2.6 ppm in the spectrum35 and a fall in the MT ratio. The authors speculated that the increased signal between 2.1 and 2.6 ppm represented myelin breakdown products and that a marked reduction in MT ratio was thus a specific marker for demyelination. In a more recent study36 the same group have shown a positive correlation between a reduction in the NAA/Cr ratio and MT ratio value in focal high signal lesions visible on MR. The patients in this study were not subdivided on the basis of their clinical picture; therefore, it is unclear whether this correlation was predominantly in those patients with fixed neurological deficit. A recent study from our own group37 has shown that it is possible to demonstrate a reduction in the MT ratio in acute gadolinium enhancing lesions followed by a marked recovery of the MT ratio over time (though not quite back to control values). Although it is possible to hypothesise various mechanisms for this observation, one possibility is that an acute reduction of the MT ratio occurs as a consequence of demyelination. The partial resolution of MT ratio found in some lesions may represent remyelination, which we know from pathological studies can be extensive.38
The patients with benign multiple sclerosis showed a relative preservation of NA and MT ratio. This suggests axonal preservation within these lesions. The preserved MT ratio suggests that these lesions have never been demyelinating or perhaps more likely that they have preserved the mechanisms which allow them the capacity to remyelinate.
The results of the current study support the hypothesis that there is a failure of remyelination in the chronic lesions of patients with secondary progressive multiple sclerosis. There are various factors which may prevent remyelination. Firstly, gliosis is a prominent feature of the chronic multiple sclerosis lesion. Excessive production of glial cells may impede the migration of oligodendrocyte precursors to areas of demyelination. Secondly, remyelination may be prevented by the death of oligodendrocyte precucursor cells. Finally, the ability of a lesion to remyelinate is of course dependent on the physical integrity of axons. If axonal loss is a prominent feature within a lesion then the potential to remyelinate will be limited. Although axonal loss may occur within acute lesions it occurs to a far greater extent in chronic plaques. This final mechanism is supported by our finding of a reduced MT ratio in those lesions with greatest axonal loss as evidenced by a reduction in concentrations of NA.
The current study then supports the hypothesis that demyelination and axonal loss occur within the same lesions. This does not necessarily mean that there is a single causative factor for both pathologies. However it does seems likely that the potential for remyelination to occur within a lesion is dependent on the degree of axonal loss or dysfunction that has also occurred. The degree of remyelination is also likely to be influenced by other factors such as the development of gliosis, which is also known to be far more prominent within the chronic lesion. As yet there are no specific nuclear magnetic resonance markers to quantify the degree of gliosis that occurs in and around an multiple sclerosis lesion. It is also uncertain to what extent gliosis contributes to the MT effect.
In this study we were also also able to perform MT and 1H MRS in a patient with central pontine myelinolysis. This is an acute neurological condition characterised pathologically by demyelination in the absence of inflammation or axonal loss. This condition therefore represents an example of a relatively “pure” demyelinating model. The finding of a marked reduction in the MT ratio with only a relatively small decrease in NAA (an axonal marker) from an acute lesion is further evidence that MT can be used as a non-invasive marker for demyelination. This hypothesis is also supported by several other lines of evidence. Firstly, a reduction of MT has been found in models of experimental allergic encephalomyelitis, in which there was demyelination and preservation of axons.22 Secondly, a study by Thorpe et al 39 has shown an inverse correlation between the MT ratio in symptomatic optic nerve lesions and the latency of the visual evoked potential suggesting a linear relation between MT ratio and the extent of demyelination. As mentioned earlier Lai et al[37 ]have shown partial reversibility in the reduction of the MT ratio which occurs in the evolution of the acute gadolinium enhancing multiple sclerosis lesion. The recovery of the MT ratio in acute lesions (in which there is relative axonal preservation) implies that MT provides a more specific index of demyelination.
One confounding factor in the interpretation of a reduction in the MT ratio in a chronic multiple sclerosis lesion is that it is probably not specific for demyelination. A pathological study by Lexaet al 40 in a feline model after sectioning has shown continuing reduction in the MT ratio over time, which corresponded well with the histological phases of Wallerian degeneration. It therefore remains unclear to what extent axonal loss contributes to the persistent reduction of MT ratio in a chronic multiple sclerosis lesion. This problem is difficult to disentangle in human studies as a loss of axons will invariably be associated with myelin loss. The very low MT ratio occurring in the central pontine myelinolysis lesion (in which no axonal loss occurred) would suggest that myelin provides the principal component to the MT ratio. The combined use of NAA and MT ratio still seems a promising means of increasing pathological specificity, as MT ratio can be used as a marker of demyelination whereas a persistent reduction in NAA will determine the degree of axon loss. Their serial application in the earlier stages of multiple sclerosis may help elucidate the temporal profile of myelin and axonal damage.
This study then supports the hypothesis that demyelination and axonal loss occur in the same chronic multiple sclerosis lesions. However to confirm this, a study with pathological corrrelation is necessary to determine the absolute pathological specificity of 1H MRS and MT.
References
Clinical and MR data of all patients with multiple sclerosis
Linked Articles
- Editorial commentary