Article Text

Abstract
OBJECTIVES It has been shown that atrophy of medial temporal lobe structures such as the hippocampus and entorhinal cortex shown on MRI may distinguish patients with Alzheimer's disease from healthy controls. However, the diagnostic value of visual inspection and volumetry of medial temporal lobe atrophy (MTA) on MRI in a clinical setting is insufficiently known.
METHODS Medial temporal lobe atrophy in 143 patients was visually rated from hard copies, using a 0–4 rating scale and a comparison was made with the volumes (cm3) of the medial temporal lobe as estimated with volumetry, using a stereological method. All patients were recruited in an unselected way in a clinical setting in the centre for memory impairments at the Huddinge University Hospital. Patients with Alzheimer's disease (n=41), patients with other dementias (vascular dementia, frontotemporal dementia, and unspecified dementia; n=36) as well as non-demented subjects (n=66) were included. Medial temporal atrophy and volumetry were evaluated as a diagnostic tool by performing logistic regression analysis including age, sex, and mini mental state examination (MMSE) score and calculating the sensitivity and specificity and percentage correct classification.
RESULTS Visual and volumetric analysis yielded statistically significant differences between patients with Alzheimer's disease and non-demented subjects, as well as between those with other dementias and non-demented subjects. Combining MMSE scores and visually rated MTA ratings yielded a sensitivity of 95% for Alzheimer's disease, 85% for other dementias. Non-demented subjects were identified with a specificity of 96%. Volumetry did not have an added value over the MMSE score alone.
CONCLUSIONS Visual rating of MTA is a clinically useful method for differentiating Alzheimer's disease from controls and is both quicker and more accurate than volumetry.
- dementia
- volumetry
- medial temporal lobe
- magnetic resonance imaging
- Alzheimer's disease
Statistics from Altmetric.com
Magnetic resonance imaging (MRI) has become a complementary diagnostic tool in the evaluation of dementia.1 Many studies have shown that medial temporal lobe atrophy (MTA) is a sensitive marker for Alzheimer's disease.2 3 To estimate MTA several techniques are available—namely, volumetric assessment, linear assessment, and visual qualitative rating.4 Volumetric assessment techniques are mainly used in studies on selected groups of patients and controls. These measurement techniques rely on specifically developed software and are undertaken separately from the clinical examination procedures using postprocessing equipment.
The evaluation of MTA as a tool in the diagnostic procedure of dementia in a clinical routine setting is far from complete. A clinically accessible method for estimation of MTA must be rapid, simple, and reliable, to be used together with the clinical and neuroradiological examinations. Moreover, the method must be able to differentiate between Alzheimer's disease and other dementias as well as between Alzheimer's disease and non-demented subjects. A visual rating scale of MTA, with an acceptable within and between rater reliability, has been developed by Scheltens et al.5 6 In a recent study,7 this method was found to correlate well with stereological assessments of MTA in a large (n=194) sample of demented and non-demented subjects. Visually rated MTA was shown to have moderate sensitivity and specificity for Alzheimer's disease in small selected (five) and unselected (three) samples. Earlier volumetric work showed that volumetry could distinguish patients with Alzheimer's disease from controls with sensitivity and specificity figures over 80%,8 but the distinction with other types of dementia yielded lower figures.9 10
To investigate further the diagnostic capacity of the visually rated MTA and to compare it with volumetry we used both methods in a large number of consecutive patients screened for dementia. We compared specificity, sensitivity, and percentage correct classification of both methods using the ultimate clinical diagnosis at follow up as the gold standard.
Material and methods
SUBJECTS
The patients enrolled in this study have been described in detail previously.7 Here we present the results from a subsample of this population. The diagnostic procedure was as follows. All patients referred for dementia investigation at the geriatric clinic at Huddinge University Hospital from 1993 to 1995 were enrolled in the study. A validated Swedish version of the mini mental state examination (MMSE)11 was used as the standard screening instrument. The investigation further included a complete physical, psychiatric, and neurological examination as well as comprehensive psychometric tests. Brain MRI was performed as routine to exclude other brain pathology. In addition, in each patient blood and CSF samples were collected and an EEG and SPECT scan were performed. A cohort consisting of subjects selected as control persons in a study on car driving and dementia12 and of members of the family with an APP mutation who were not mutation carriers, were subjected to the same procedure (except for SPECT ).
After this procedure all subjects were diagnosed using the guidelines in DSM-III-R13 for assessing dementia, the NINDS-AIREN criteria for vascular dementia,14 the Lund-Manchester criteria for frontal lobe dementia,15 the ICD-10 criteria16 for unspecified dementia, and the NINCDS-ADRDA17 criteria for probable/possible Alzheimer's disease. If none of these diagnoses was applicable the subject was designated as non-demented. After the diagnostic investigation 10 patients had to be excluded because of a space occupying lesion and another nine were excluded because of poor MRI quality, yielding 143 subjects whose diagnoses were confirmed at follow up examinations 6 months after the initial investigation (table 1).
Demographic data on the study groups
MAGNETIC RESONANCE IMAGING
All examinations were performed with a Siemens 1.5 Tesla Magnetom. A standard examination was first performed obtaining 24 T2 and proton density weighted, transaxial images through the brain. The volumetric measurements were based on a 3D magnetisation prepared rapid gradient echo sequence (3D MP-RAGE, TR=10 ms, TE=4 ms, flip angle=10°). This sequence yields 64 continuous coronal slices covering the whole brain with a good separation of grey and white matter and between brain tissue and CSF (T1 weighted). The slice thickness was 2.8 mm and the partial volume effect was small. The coronal plane was chosen to be perpendicular to the line intersecting the anterior and posterior commissures in the midsagittal plane (the AC-PC line).
VOLUMETRIC ESTIMATION
A description of the method has been published previously.7 The volumetric measurements were performed using the method of stereology with a program, CV-Stereo, developed by Context Vision AB, Linköping, Sweden. The point counting stereological method used in this program is based on the Cavalieri theorem of systematic sampling. The computer program generated a grid which was randomly placed on the MRI slices, and the number of intersecting points over the area of interest were counted. The size of the grid depends on the the structure to be measured; as a rule of thumb the total number of test points should be around 100 to give a reasonable accuracy. The volume was estimated with the following formula: (number of measured points)×(area of a square in the grid)×(distance between slices). The requirements for this method is that the structure should be sampled at equal and perpendicular intervals, and the sampling should begin at random. The above described imaging technique meets the basic requirements for the stereological method, as the first slice intersects the brain at random.
The medial temporal lobe including the amygdala, hippocampus, and parahippocampal gyrus, was measured in 10 slices between the anterior commissure and posterior commissure, using a point distance of 0.5 cm in the test point grid. The intracranial volume (ICV) was defined as the whole volume inside the skull with the lower border defined by the caudal region of the cerebellum, temporal lobes, and orbitofrontal cortex. The brain stem was not included in the ICV. The ICV volume was measured in eight slices with a test point grid of 2 cm. The within rater variation between two measurements on the same image set was 3.5% The within rater variation defined as the mean difference between two measurements done by one operator on two different image sets of six subjects being examined twice in the MRI scanner with a time gap of 2 weeks, was 3.5%. As these variations were identical, the measurements seemed to be relatively independent for image quality and positioning of the patient in the scanner. The between rater variability between two raters on scans of six subjects was 4.5%. The stereological method has also been compared with a method using manual outlining plus thresholding.18 In 28 patients investigated for suspected dementia bilateral medial temporal lobe volumes were measured with both methods. The stereological method gave systematically lower medial temporal lobe (MTL) volumes with a mean volume in the patient group of 13,3 cm3 (SD 2.2) compared with 14.9 cm3 (SD 2.4) with manual outlining plus thresholding. This difference (−1.6 cm3) was statistically significant (p< 0,001, pairedt test). The correlations between the two methods were high (0.84, p<0,001, Pearsson correlation coefficient 0.71, p<0.001 within class correlation (Kendall τ)). Sex differences were also detected by the two methods. Men (n=11) had a 2.9 cm3 larger MTL than women (n=17) using manual outlining+thresholding and a 2.2 cm3 larger MTL using stereology. Both differences were statistically significant (p<0.01,t test). These data clearly showed that despite the not surprising systematic difference between the two methods there was a good agreement in ranking the relative relation between volumes within the group. This means that the faster stereology method should be comparable with manual outlining methods for sensitivity.
VISUAL RATING
The MTA was assessed visually by one rater (PS), who was blinded to the subjects' age, diagnosis, and sex. Scores ranged from 0 (no atrophy) to 4 (severe atrophy). The rating scale is based on a visual estimation of both the volume of the medial temporal lobe, including the hippocampus proper, dentate gyrus, subiculum, and parahippocampal gyrus and the volume of the surrounding CSF spaces, in particular the temporal horn of the lateral ventricle and the choroid fissure on both sides, left and right side separately.5 Rating was performed on T1 weighted coronal slices (hard copies) according to example images published earlier.6 This visual method of scoring has a reasonably good between and within rater reliability.6 For this study a modification was made to rate left and right MTA separately.
STATISTICAL METHODS
One way ANOVA and χ2 were used for group comparisons. Tukey-Kramer HSD was used for pairwise comparisons. The discriminative power of volumetry and visual rating between the pairwise combinations of groups (Alzheimer's disease-non-demented, Alzheimer's disease-other dementias, and other dementias-non-demented) were analyzed by using three logistic regression models (main effect models). The first model included MMSE score only, the second model MMSE score and volumetry and the third MMSE score and visual rating (left and right combined). We wanted to test the discriminative power only of MMSE, volumetry, and visual rating and not of age and sex. For this reason we decided not to include them into the models and found this to be justified by the finding that including age and sex into the models resulted in only marginal changes.
The volumetry variables were continuous and the visual rating variable comprised three categories: 0 (reference), 1, and >1. The cross classification was based on the estimated logistic probabilities from the three models. The chosen cut off point was 0.5. Those with predicted probabilities above 0.5 were classified into one group and those below 0.5 into a second group. The results are shown as sensitivity, specificity, and an overall rate of correct classification (percentage), calculated from the cross classification of observed and predicted group membership. In addition, 95% confidence intervals (95% CIs) were calculated according to the method described by Carrington Reid19 as follows: sensitivity±1.96 (sensitivity×(1−sensitivity)/n). A p value>0.05 was considered not significant.
Results
The demographic data of the study group is presented in table 1. The results of the visual ratings and volumetry are presented in tables2 and 3. Both methods yielded statistically significant differences between the diagnostic groups and non-dementias, but not between Alzheimer's disease and other dementias. The patients with Alzheimer's disease showed significantly smaller MTA volumes than those with non-dementias measured both visually and with volumetry. Also the other dementias group had smaller MTA than the non-dementias group.
Distribution of the rating of MTA in the study groups AD, OD, and ND (left/right)
Volumetry in AD, OD, and ND
Diagnostic value for volumetry and visual rating of MTA.
Diagnostic value of volumetry and visual rating of MTA
Diagnostic value of volumetry and visual rating of MTA
The first model including the variable for MMSE score was significant in all comparisons. In the second and third models, the variable for MMSE score and volumetry/visual rating were significant (comparing Alzheimer's disease and non-dementias, and other dementias and non-dementias). When comparing Alzheimer's disease and other dementias only the variable for MMSE score was significant. Thus the final diagnostic accuracy was calculated using the scond and third logistic regression models adjusting for MMSE score. In tables 4-6 the specificity, sensitivity, and percentage correct classification, based on the three models, are given. The tables show that visual rating yielded a diagnostic gain for Alzheimer's disease over the MMSE, whereas volumetry did not. In separating the other dementias from non-dementias, visual rating added almost 30% to the sensitivity, but nothing to the specificity, whereas volumetry did not add to the MMSE despite the significant variables. In distinguishing Alzheimer's disease from other dementias both MTA assessments had no further predictive value (non-significant variables) over MMSE score, adjusted for sex and age.
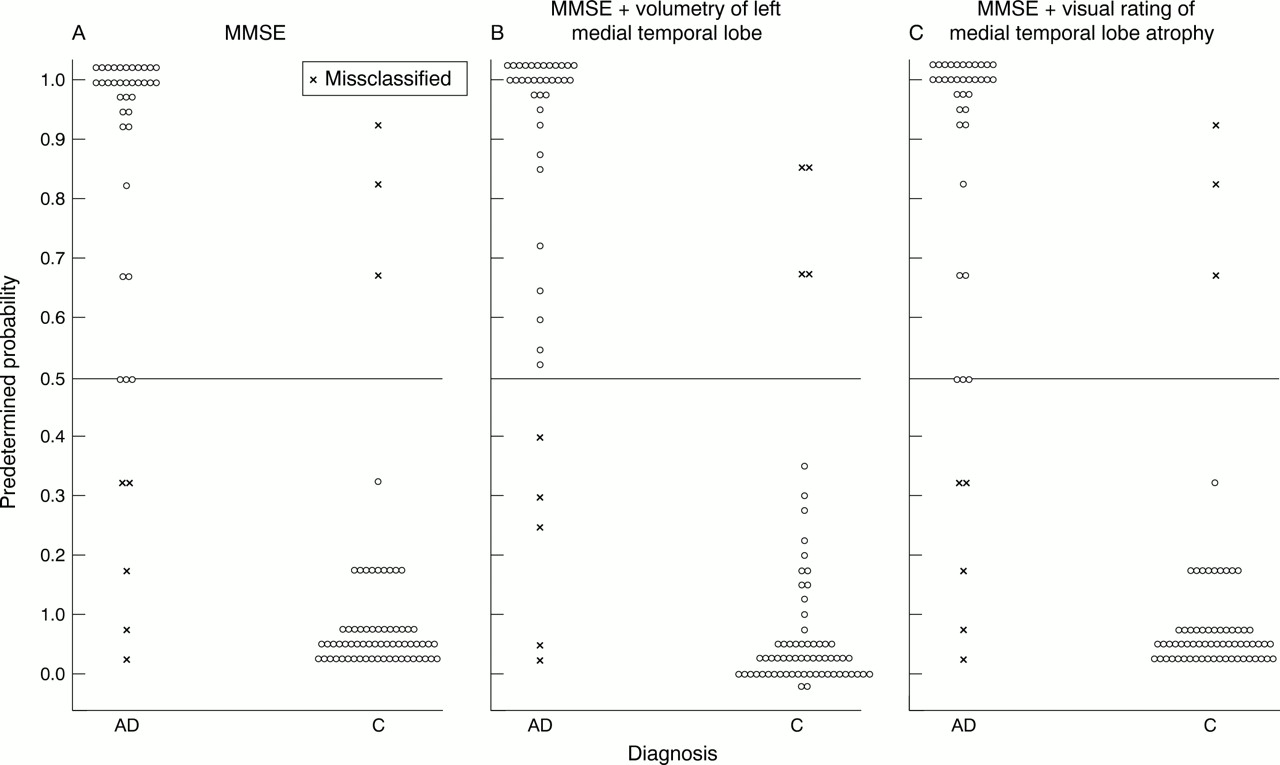
To further clarify the results of the logistic models we plotted the predicted probability for each subject to group membership (only Alzheimer's disease or control) in the figure A–C.
Plots of predicted probability (p values) using three logistic regression models to differentiate patients with Alzheimer's disease (AD) from controls (C). Each circle represents one subject. The cut off level used was 0.5, and the misclassified subjects are marked.
The actual time needed for volumetry (only the point counting of the medial temporal lobes and the volume) was 10–12 minutes/subject and for visual rating 1–2 minutes/subject.
Discussion
In this study we compared two methods for measuring medial temporal lobe atrophy in a large sample of patients evaluated for dementia. We found that both methods yielded significant differences in patients with Alzheimer's disease compared with patients with other dementias and non-dementias. However, in terms of diagnostic gain over the screening MMSE score only, visually rated MTA added to the sensitivity in separating Alzheimer's disease and other dementias from non-dementias. Visually rated MTA also added to the sensitivity in discriminating Alzheimer's disease from other dementias whereas volumetric MTA assessments had a limited value in this.
We investigated patients who were referred to our clinic for evaluation of suspected dementia. The patients were unselectively and consecutively recruited and no exclusions were made except for secondary dementias (n=10) and those patients for whom the MR images were of poor quality (n=9). By doing this we tested the methods in a true clinical setting. Using the clinical diagnosis made by clinicians not involved in this study at follow up and having the MR images evaluated by researchers unaware of the clinical data, we aimed to avoid investigation and review bias.19 In addition we focused on the clinical usefulness of the methods, defined in this context as a method that is both easy to use and gives satisfactory discriminative power. To this end we used a different way of evaluating the sensitivity and specificity for the methods by including a comparison with the discriminative power of MMSE scores, to reflect more the clinical decision making situation, in which the MMSE is usually done before ancillary studies are ordered. Moreover, a comparison was made between patients with Alzheimer's disease and patients with other dementias as well as between these two groups and non-dementias.
We found the diagnostic accuracy to be very high for the combination of MMSE and visual rating of MTA, differentiating Alzheimer's disease from non-demented patients with a sensitivity of 95% (95% CI 88–98%), a specificity of 98% (95% CI 95–100%), and a correct classification of 96% (95%CI 92–100%). Our volumetric method showed a slightly lower degree of correct classification (93% (95% CI 86–98%)) which is in agreement with findings of other groups. For instance, Laakso et al 8reported an overall correct classification of 92% discriminating Alzheimer's disease from controls using volumetry in a slightly larger sample.
Of special interest is the reasonably high sensitivity (82 (CI 75–69%)) of MTA for the diagnosis of other dementias, which included vascular dementia (n=21), frontal lobe dementia (n=4), and unspecified dementia (n=11), but were grouped together as other dementias for statistical reasons versus non-dementias. As could be expected the MMSE had low sensitivity for other dementias, but the added value of MTA suggests medial temporal lobe involvement in some of these non-Alzheimer's disease dementias.20 21 This also explains the weaker performance of MTA in discriminating Alzheimer's disease from other dementias. Few other studies have considered the problem of discriminating Alzheimer's disease from other dementias using MTA or MRI. Laakso et al 9have compared Alzheimer's disease with Parkinson's disease (with and without dementia) and vascular dementia and found no differences between the groups for medial temporal lobe volumes. Recently, Frisoniet al 10 compared volumetry of the hippocampus and entorhinal cortex in patients with Alzheimer's disease and patients with frontotemporal dementia and found equal atrophy in the entorhinal cortex but more severe hippocampal atrophy in Alzheimer's disease. However, in all these studies, including ours, coexistence of Alzheimer's disease and the other dementias could not be ruled out, despite a follow up period of 6 months in our study. In a recent study on patients with histologically confirmed dementia with Lewy bodies and patients with Alzheimer's disease; however, visually rated MTA on MRI was able to differentiate both groups with high accuracy.22
Our volumetry focused on the MTL, but visual rating probably also included more lateral parts, which were found to raise the correct classification of Alzheimer's disease from 80% to 91% in a study by De Leon et al.2 This is further supported by findings from Frisoni et al 23 in which a sensitivity of 85% and specificity of 95% were found in discriminating patients with Alzheimer's disease from controls, using a combination of the width of temporal horn, width of choroidal fissure, and height of hippocampus.
It is not fully evaluated which substructures of the medial temporal lobes best characterise Alzheimer's disease—the entorhinal cortex,24 the hippocampus,8 or both.25 Juottonen et al 25 evaluated the discriminative power of the entorhinal cortex and hippocampus. The sensitivity in detecting Alzheimer's disease was similar for both (80%) but the entorhinal cortex was 3% more specific (94%). Adding sex to the regression analysis increased the sensitivity to 90%, but had no influence on specificity. This illustrates that including other variables into the discriminant models may increase the diagnostic accuracy. We also included, apart from sex and age, MMSE scores into the discriminative model and when adding rating and volumetry this resulted in very high sensitivity and specificity.
It could be argued that the comparison of visual and volumetric analysis is hampered by using a less valid stereological method instead of semiautomated manual tracings and by using a slice thickness of 2.8 mm instead of the 1.5 mm typically seen in studies such as this. The first argument is dealt with in an earlier study18 in which we compared both methods and found that there was a good agreement in ranking the relative relation between volumes within the group under study. This means that the faster stereology method should be comparable with manual outlining methods for sensitivity. Using a smaller slice thickness would limit the investigation to highly selected research samples as both scan time and image analysis time would be significantly increased. There is also a trade off between high resolution (and longer scan time) and movement artifacts, especially in large clinical samples such as these. The slice thickness we chose may thus be regarded as a compromise. Most importantly, the present paper compared two different methods on the same set of images. Probably both methods could benefit from a smaller slice thickness. However, this was not regarded as a major objective of the present study.
Taking into account that visual rating is rapid (1–2 min/subject) and can be applied to all kind of (coronal) MRI images regardless of type of imager or protocol, the method could be implemented into the standard clinical routines in dementia investigations, provided that the rater has some experience in visual assessment of MTA.
Acknowledgments
The research of PS at the Karolinska Institute was funded by The Karolinska Institiute Research Funds and Hjärnfonden.