Article Text

Abstract
OBJECTIVES Temporal lobe atrophy as assessed by MRI can be measured in several ways. Volumetric measurements are quantitative but very time consuming and require extensive training to perform, so are not easily transferable to clinical practice. Visual rating scales, by contrast, are quick and widely applicable. Although medial temporal lobe atrophy is well described in Alzheimer's disease (AD), it is uncertain how early these changes can be detected and whether they discriminate AD from other neurodegenerative diseases, most notably frontotemporal dementia (FTD). The objectives were (1) to develop a widely applicable temporal lobe rating scale, and (2) to characterise and quantify the patterns of temporal lobe atrophy in AD versus temporal and frontal variants of FTD.
METHODS The temporal lobe assessments were made using an established hippocampal rating scale extended to incorporate additional temporal regions. This was firstly validated with volumetric analysis and then applied to 30 probable AD, 30 FTD (consisting of 17 temporal variant (semantic dementia) and 13 frontal variant) and 18 control coronal MRI images.
RESULTS Bilateral hippocampal atrophy was found in 50% of the patients with AD. Contrary to expectations, patients with semantic dementia also had hippocampal atrophy, which for the left side exceeded that seen in AD; other regions (temporal pole, parahippocampal gyrus, and lateral temporal lobe), spared in AD, were severely atrophied in this group. The patients with frontal variant FTD occupied an intermediate position and were largely indistinguishable from AD.
CONCLUSIONS Hippocampal atrophy is, therefore, not specific for AD. Semantic dementia can be distinguished from AD, by the presence of severe bilateral atrophy of the temporal pole, parahippocampal and lateral regions. These findings have implications for the differential diagnosis of dementias.
- frontotemporal dementia
- temporal lobe atrophy
- Alzheimer's disease
Statistics from Altmetric.com
The quantification of brain atrophy on MRI has been attempted using many different methods, including rating scales, linear and volumetric measurements of regions of interest, and coregistration techniques (for review see Fox1). Each method has advantages and disadvantages. Volumetric analysis provides an accurate and detailed measure of a predetermined circumscribed area. It is, however, a laborious, and labour intensive technique which needs extensive training. Rating scales, by contrast, are quick, and can be performed on large numbers of scans in a clinical setting, the disadvantage being that there is a loss of accuracy compared with volumetric analysis. We describe the development of a new temporal lobe scale which has been applied to patients with Alzheimer's disease (AD) and patients with frontotemporal dementia (FTD). These disorders represent the two most common causes of dementia in younger patients.2 This scale has been validated against detailed volumetric measures of multiple temporal lobe regions.
The differentiation of AD from other causes of dementias is of practical and theoretical importance. Here we consider the practical clinical issues. Atrophy of the medial temporal lobe in patients with a diagnosis of AD, has been established using various methods, including subjective rating scales,3 4-6 measures of hippocampal width and volumes7-10 and, more recently, measures of entorhinal cortical volume.11 The major impetus for the development of methods of temporal lobe assessment has been to improve the accuracy of early diagnosis in AD, yet it is unclear whether medial temporal lobe atrophy is specific for AD or can also be a feature of other dementias12 as few studies to date have compared patients with AD with those with other forms of degenerative disease. One notable exception is a pair of studies by Frisoniet al who compared AD and FTD using firstly linear measurements13 and subsequently volumetric techniques,14 and demonstrated medial temporal lobe atrophy. In both of these studies, however, patients with progressive aphasia or prominent temporal lobe pathology were excluded.
The classification of the non-Alzheimer focal lobar degenerations is debated, and there has been a plethora of terminologies.15In keeping with previous studies from our group16-19 and in line with international consensus criteria20 we have subdivided patients with FTD into those with a predominant frontal presentation, and those with semantic dementia (progressive fluent aphasia), a temporal presentation. Patients with progressive non-fluent aphasia have not been included in this study. The frontal variant of FTD (fvFTD) presents with progressive and insidious behavioural disturbance and personality change.18 The label semantic dementia has been adopted to describe the temporal variant of FTD21 22 because it captures the essential disorder of impoverished general knowledge about objects, people, and the meanings of words. The distribution of atrophy in this syndrome, which can easily be mistaken clinically for AD, has not been systemically investigated. Visual inspection of brain MRI has suggested that the hippocampal complex is preserved in semantic dementia compared with AD and although pathological studies suggest hippocampal involvement occurs eventually, it is uncertain whether this can be detected in vivo.15
The principal aim of the current study was to develop a reliable, but quick, method of temporal lobe assessment using MR images which might have wider applications in diagnosis. We developed a new temporal lobe rating scale which incorporates a well validated assessment of the hippocampus3 but extended this methodology to other temporal lobe structures. This method was validated against volumetric measures and assessed for reproducibility.
The temporal lobe rating scale was then applied to larger groups of patients with AD and both presentations of FTD—namely, semantic dementia and fvFTD—matched for overall disease duration. The aim was to characterise and quantify the pattern of atrophy in a range of carefully defined temporal lobe regions in patients presenting with FTD and mild to moderate stage AD. Based on prior clinical and neuropsychological studies (for reviews see Hodgeset al 17; Perry and Hodges16) we hypothesised (a) that patients with AD would show hippocampal, and possibly parahippocampal gyral atrophy, (b) that the semantic dementia group would have polar and inferolateral temporal lobe atrophy involving the fusiform gyrus, predominantly on the left, with relative sparing of the hippocampus, and (c) based on the work of Frisoniet al,13 14 that the fvFTD would show less severe hippocampal atrophy than the AD group.
Experiment 1: development and validation
METHODS
Imaging
Brain MRI was performed on a 1.5T GE Signa MRI scanner (GE Medical Systems, WI) between 1997 and 1998. In all subjects, contiguous MR images of the entire brain were obtained using a volumetric (3 D), inversion recovery prepared, fast gradient echo sequence and the following parameters: TR=13.5 ms; TE=4.2 ms; TI=650 ms; FOV=22 cm; slice thickness=1.5 mm; matrix 256×256; 1 NEX. The number of slices was chosen to encompass the whole brain and varied between 116 and 124 for different subjects. Total acquisition time was about 9 minutes. Straight coronal images perpendicular to the horizontal plane were obtained. After inspection, the acquired 3 D image data set occasionally needed resectioning to provide a consistent orientation relative to the brain anatomy across different subjects. This was due to patient movement between the pilot and 3 D acquisions. When needed, these small angular rotations were performed by the ANALYZE software package.
Visual rating assessment
Hard copies of the coronal MRI images of 20 patients of mixed diagnoses were assessed by blinded raters (CJG, BGA, and NA) with the names of the patients obscured. The scans were presented randomly. The method used built on the work of Scheltens et al,3 23 which we extended to incorporate non-hippocampal structures. For hippocampal rating, we used exactly the same scale described in detail by Scheltenset al. 3 In brief, it is a five point scale of hippocampal atrophy (normal=0, severe atrophy=4) which assesses visually the width of the choroidal fissure, width of the temporal horn, and the height of the hippocampal formation, using the best slice that depicts both hippocampal formations, usually at the anterior pons. This method has shown good interrater and intrarater reliability on a dichotomised scale (0–1 v2–4) and has been validated against both linear and volumetric measures using different MRI sequences.3 23-25
To assess the other temporal structures we designed our own four point scale (normal=0 severe atrophy=3) rating the anterior, non-hippocampal medial (parahippocampal gyrus), and lateral temporal structures. We initially piloted several measures for each temporal region, but narrowed the scale down to a single measure per region based on the initial measures which had the best agreement between raters in the pilot studies. Thus the final scale used the following three indices for the different temporal regions: (1) the CSF space between the sphenoid wing and anterior temporal lobe (on a representative slice before the closure of the lateral fissure) for the anterior temporal region (as illustrated in fig 1); (2) the depth of the collateral sulcus on the same slice on which the hippocampus is assessed, for the medial (parahippocampal) region (see collateral sulcus on fig 2); and (3) the depth of the lateral sulci on the same slice for the lateral temporal structures. The criteria of the scale is summarised in table1; figs 1 and 3 show examples of this scale. Assessments were undertaken of both temporal lobes separately.
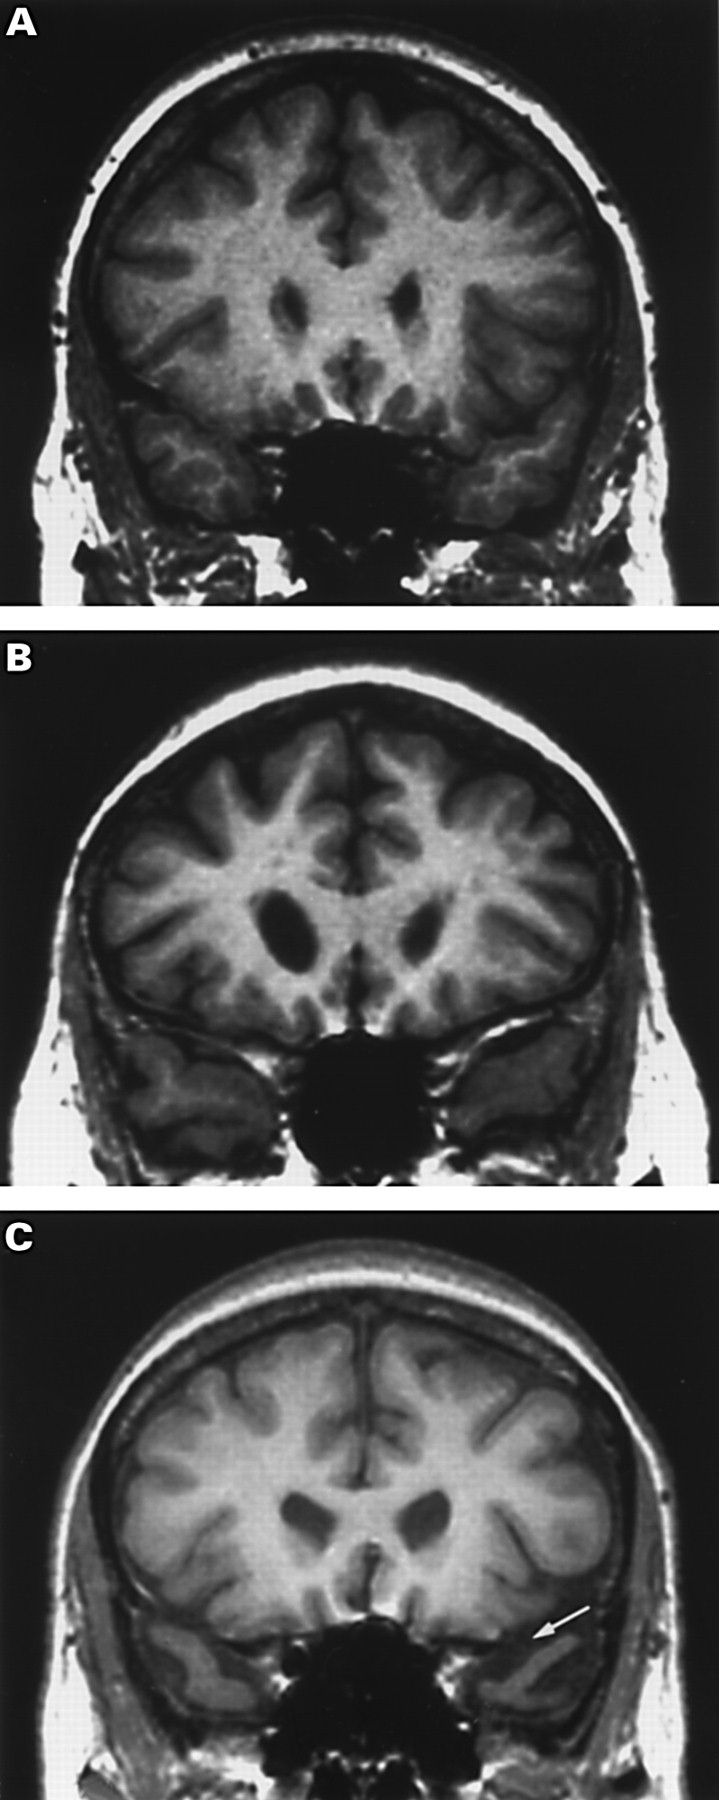
Examples of the visual rating scale for the anterior temporal lobe (temporal pole) on MR coronal images displayed conventionally with the letter on the right (as shown by arrow). This scale rates 0=normal; 1=minimal atrophy; 2=moderate atrophy; and 3=severe atrophy; (A) rating the CSF space between the sphenoid wing and the temporal cortex, this scan was rated 0 bilaterally, (B) this scan was rated 1 bilaterally, (C) this scan was rated 2 on the right and 3 on the left.

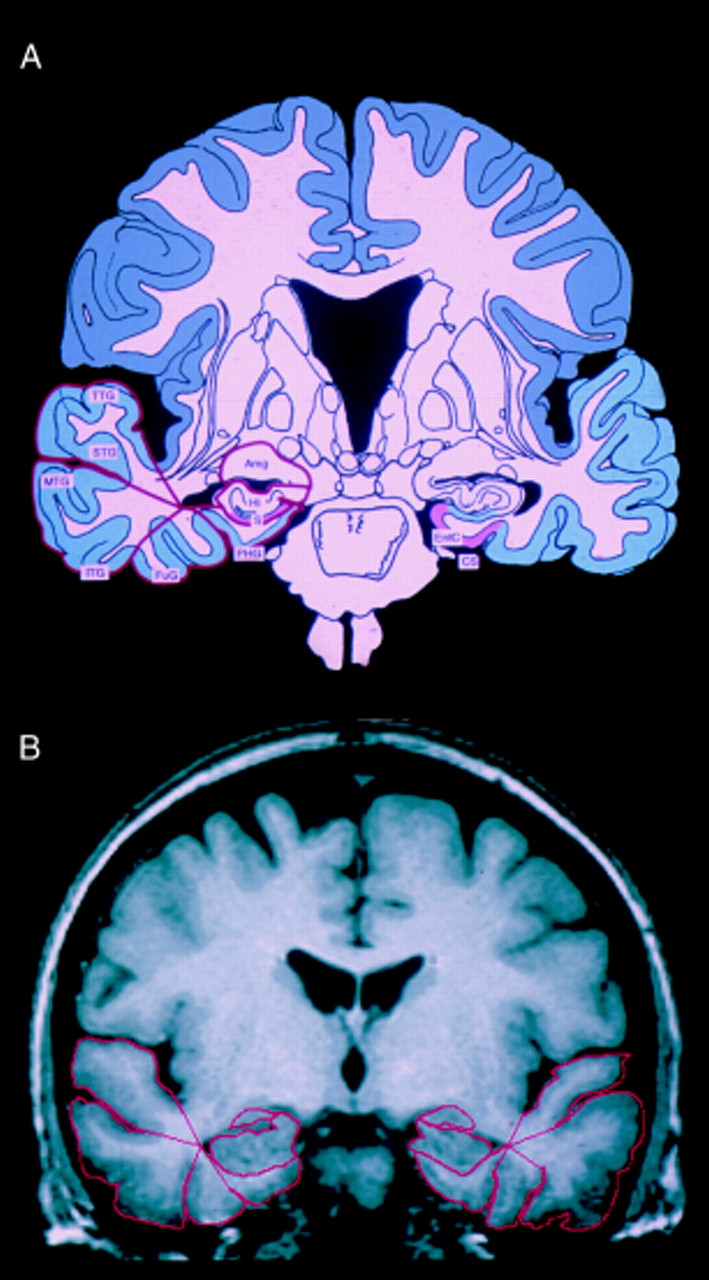
Illustration of the volumetric measures and correspondent anatomy. EntC=Entorhinal cortex; CS=collateral sulcus; Amg=amygdala; Hi=hippocampus; S=subiculum; PHG=parahippocampal gyrus; FuG=fusiform gyrus; ITG=inferior temporal gyrus; MTG=middle temporal gyrus; STG=superior temporal gyrus; TTG=transverse temporal gyrus (adapted from Mai et al26).
Summary of criteria for temporal rating scale

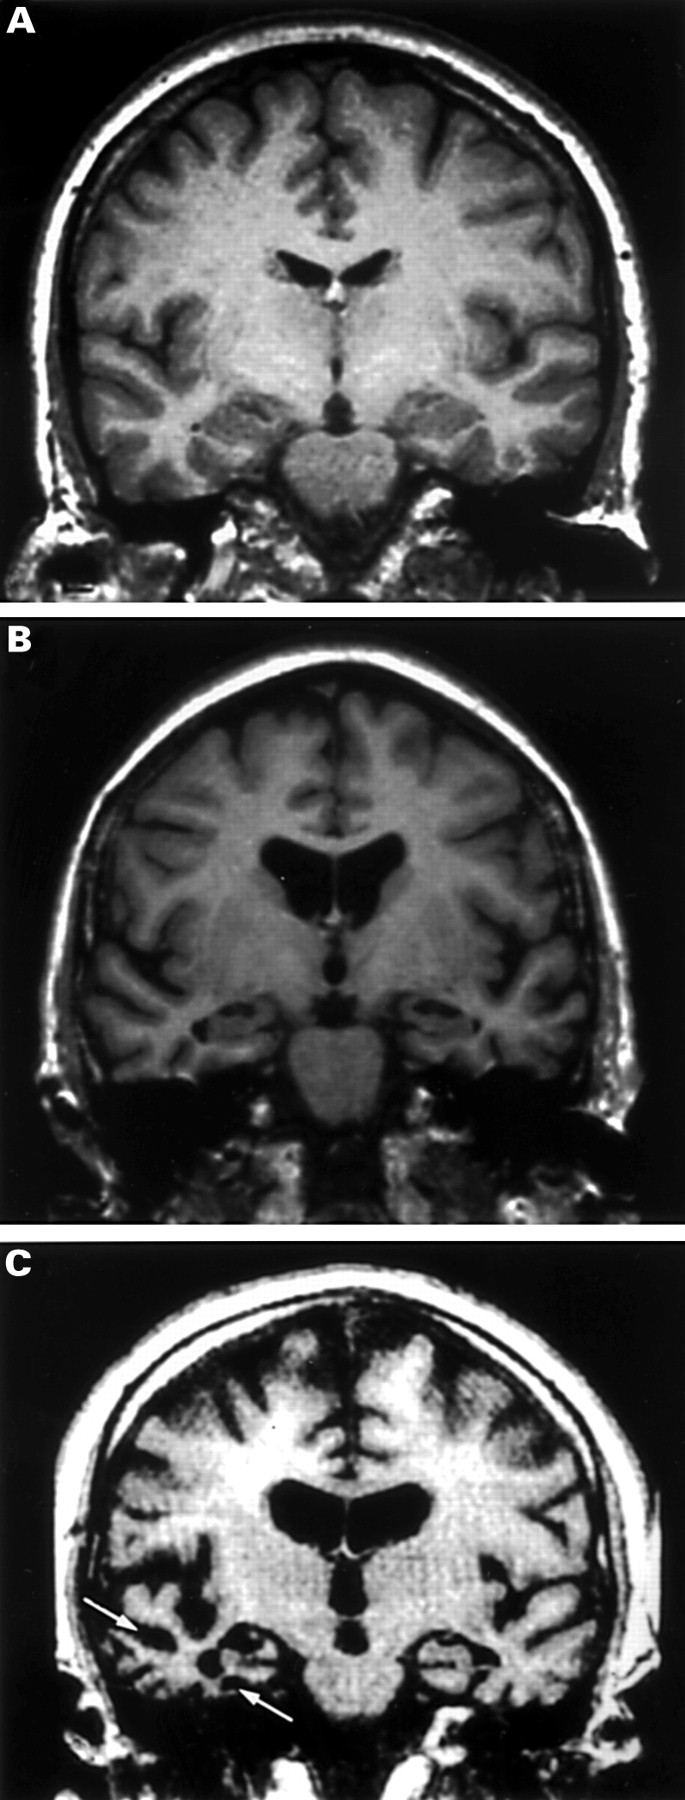
Examples of the visual rating scale for the medial and lateral temporal lobe on MR coronal images displayed conventionally with the letter on the right. This scale rates 0=normal, 1=minimal atrophy, 2=moderate atrophy, and 3=severe atrophy (see arrows); (A) normal medial and lateral temporal lobe structures (rated 0 bilaterally); (B) minimal atrophy of medial temporal lobe structures (rated 1 bilaterally;, (C) severe medial and lateral atrophy on the right (graded 3) and moderate on the left (graded 2).
Volumetrics
Volumetric analysis was performed on the same 20 subjects by a single observer (CJG) who was blind to the subject's details at the time of volumetric assessment. The segmentation and data collection took about 4 hours a patient. The regions of interest were manually traced on 1.5 mm contiguous coronal slices using ANALYZE (Biomedical Imaging Resource, Mayo Clinic, Rochester, MN) on a Sun Sparcstation 20. Tracing proceeded from anterior to posterior for all of the temporal subvolumes measured—namely, the anterior temporal pole, hippocampus, parahippocampal gyrus, and inferomedial gyri (fig 2). The intracranial cross sectional area (in mm2) was measured at the slice showing the anterior commissure to correct for head size. All anatomical landmarks were defined with reference to hippocampal and brain atlases.26 27 The definitions of the temporal subvolumes and their assumed anatomical correlates were:
Temporal pole—The anterior temporal structures (white and grey matter) were manually traced on all slices where distinguishable until the slice before closure of the lateral fissure. This encompassed predominantly temporal pole (Brodman area 38) but may include small sections of entorhinal cortex, fusiform, inferior, and middle temporal gyri, and superior temporal gyri (BA 28, 36, 20, 21, and 22).
Hippocampus—The hippocampus (including subiculum) was defined and segmented according to the technique in Watson et al 28 but with a few changes; the posterior extent of measurement was the slice with the sylvian aqueduct (cerebral aqueduct) visible and the fornix was not included in the posterior slices unless it was embedded in the hippocampal structure. The inferior border was the white matter of the parahippocampal gyrus. This measure is thought to include hippocampal fields CA1 to CA4, the dentate gyrus, and the subiculum.
The non-hippocampal medial and lateral temporal lobe structures were segmented using a “wheel and spoke” method based on that developed by Convit et al 9 (fig 2). The reference point for the segmentation was the most lateral point of the temporal horn on each slice. This technique was applied to all slices starting with the first slice on which the temporal horn of the lateral ventricle was visible, and ending at the same end slice for hippocampal measurements.
Parahippocampal gyrus—The anatomical correlates of this measure are thought to include most of the entorhinal cortex (BA 28) and some of the perirhinal cortex in the wall of the collateral sulcus (BA 35).
Inferior and middle temporal gyri—Due to variability across subjects these areas were taken together. The medial border was the line from the reference point to the inferior temporal sulcus and the superolateral border was the inferomedial border of the superior temporal gyrus measure. The assumed anatomical correlates for this measure were BA 20 and 21.
The inferred anatomical correlates of our measures are illustrated in fig 2. The validation of this method was undertaken with intrarater reliability measures by repeated measurements on five blinded scans. The coefficient of reliability,29 a measure of the observed disagreement/chance expected disagreement, was 0.99 for the anterior temporal pole, 0.85 for the amygdala, 0.95 for the hippocampus, 0.91 for the parahippocampal gyrus, 0.99 for the fusiform gyrus, 0.96 for the inferior and middle temporal gyri, and 0.96 for the superior temporal gyri. The coefficients of variation of these measures were all under 6% except for the amygdala, which was 9%. The volumetric data were normalised using the cross sectional area measure as described by Laakso et al 30as: (volume/intracranial area)×100. Control means (SD) for this method were determined in 20 normal subjects.
RESULTS
Intrarater and interrater reliablity
The validation of both the hippocampal and temporal lobe assessments was undertaken for the full scale and a dichotomised (normal to minimal atrophy (0–1) versus moderate to severe atrophy (>2)) version of the scales. Intrarater reliability was assessed by the κ statistic.31 For the hippocampal scale, the main assessor (CJG) had good repeatablity (κ=0.67) and interrater reliability was also good (PS v CJG κ=0.63). Focusing on the novel temporal lobe aspects of the scale, interrater and intrarater assessments likewise showed very good to good agreement between raters for almost all of the measures on the dichotomised scale and fair to good agreement on the full four point scale (table2).
Mean κ values (SD) for the full and dichotomised temporal rating scale
Rating scale v volumetric assessment
The visual rating scale assessments were compared with volumetric assessments of the temporal lobe areas using Spearman's rank correlation. As shown in table 3, the correlations between the volumetric analyses and the simplified and full visual scale reached significance in all regions measured (p<0.05). A graphical representation of the relations between the volume measures and the temporal scale is shown in fig 4.
Correlation of temporal rating scale with volumetric measures
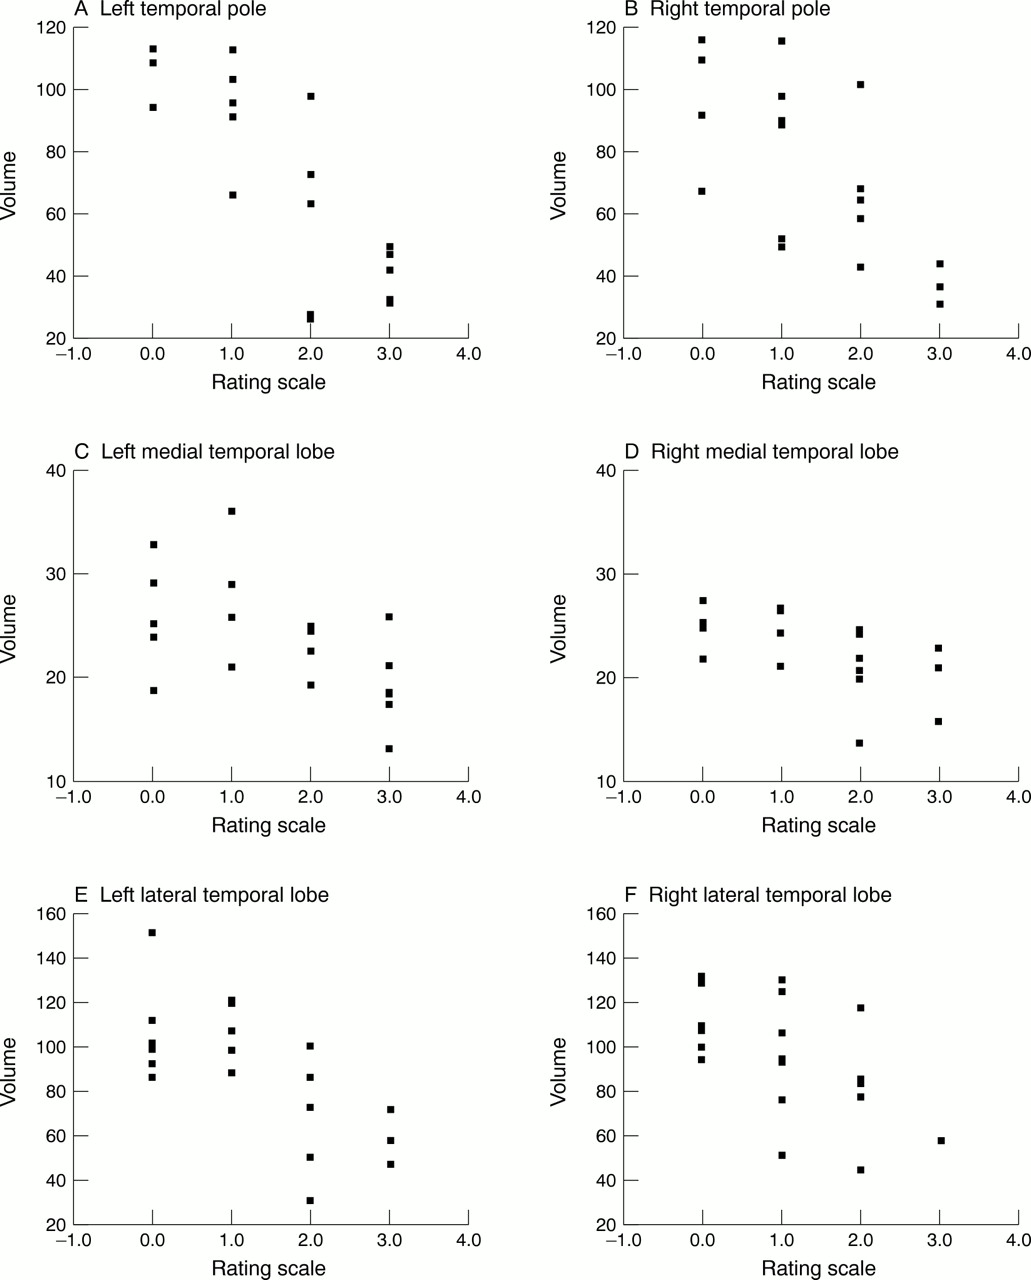
Scatterplots of volumetric measures versus temporal rating scale.
Experiment 2: comparison of Alzheimer's disease, semantic dementia, and frontal variant frontotemporal dementia
METHODS
Subjects
A total of 78 subjects participated: 30 with AD, 17 with semantic dementia, 13 with fvFTD, and 18 controls (table 4). Roughly a quarter of the subjects (25.6%) were those producing the scans used in experiment 1. The patients all presented to the memory clinic in Addenbrooke's Hospital, Cambridge over the period 1991–8 and are part of a longitudinal project. The study has been approved by the local ethics committee and informed consent was obtained from the patients and relatives before being studied. Screening for all patients included a psychiatric interview and medical examination. The AD group consisted of 30 patients with mild to moderate probable AD who fulfilled NINCDS-ADRDA criteria. The semantic dementia group (n=17) fulfilled criteria for semantic dementia at presentation20 22 and the fvFTD group (n=13) fulfilled criteria for FTD.20 32It should be noted that the criteria are based on behavioural and neuropsychological features and do not include the use of imaging. Classification was, therefore independent of the current study. The patients also underwent detailed neuropsychological assessment. As illustrated in table 4, the AD group were impaired on memory (Rey recall) and visuospatial tasks (Rey copy) compared with the other groups, whereas the semantic dementia group underperformed on semantic tasks (naming and pyramids and palm trees test33). The fvFTD group had significantly increased scores on the neuropsychiatric inventory34 compared with the other patient groups. The patients with semantic dementia and patients with fvFTD were significantly younger than both the AD and control groups, in keeping with the disease profile of FTD. Control subjects were all healthy volunteers obtained via the subject panel at the MRC Cognition and Brain Sciences Unit.
Demographic and neuropsychological data from the subject groups
Comparison of disease duration, used as a marker of severity, showed no significant difference in the duration of symptoms (defined as the time elapsed from the first symptoms as estimated by patient and spouse to the MRI) between the patient groups. There was also no difference in the clinical dementia rating35 between the AD and semantic dementia groups, AD mean 0.9 (SD 0.7), semantic dementia mean 0.9 (SD 0.5), suggesting that these groups are well matched in functional impact of disease. The clinical diagnosis in our patients has been validated with longitudinal follow up of at least 2.5 years including regular neuropsychological assessment and observed clinical deterioration. Although none of the patients in this study have come to post- mortem yet, 63 patients in our longitudinal project have had pathological examination. Of the 18 patients who had a clinical diagnosis of AD, all had AD pathology (with or without a mild degree of concomitant vascular or Lewy body pathology). Fourteen patients had a clinical diagnosis of semantic dementia or fvFTD, all of these had non-Alzheimer pathology; nine had Pick bodies, two had non-specific gliosis without Pick bodies, two had corticobasal degeneration, and one had ubiquitin positive inclusions characteristic of motor neuron disease dementia.
Statistical analysis
The data were analysed using the SPSS 8.0 package for Windows. Demographic and neuropsychological variables were compared using analysis of variance (ANOVA) with post hoc Tukey HSD tests when appropriate. The mean scores on the rating scales were also assessed using ANOVA and Tukey post hoc comparisons. The effects of age and sex on the results were not statistically significant, therefore unadjusted means were compared.
RESULTS
The results from both the hippocampal and temporal lobe visual rating scale measurements were dichotomised into normal to minimal atrophy or moderate to severe atrophy. Comparison of the proportion of patients in each group with moderate or severe atrophy (rated 2 or above) disclosed significant main effects of group for all temporal regions, significant at the p<0.0005 level in both temporal poles, the left hippocampus and bilateral parahippocampal gyri, and lateral temporal gyri (table 5). The results are illustrated in fig 5 as the proportion of cases with normal or minimal atrophy (grade 0–1). None of the controls had significant atrophy in areas other than the hippocampus and even in this region only 11% showed changes. Half of the AD group had moderate to severe bilateral hippocampal atrophy which was significantly greater than that seen in controls, but there were no significant differences in any other temporal areas relative to controls. The patients with semantic dementia showed a significantly greater degree of atrophy than controls in all four rated regions bilaterally—the temporal pole, hippocampi, parahippocampal gyrus, and lateral temporal lobe (p<0.05). The fvFTD group demonstrated atrophy in the temporal poles and hippocampi bilaterally and in the right parahippocampal gyrus compared with the control group. Comparison within the patient groups disclosed greater atrophy in the patients with semantic dementia for the temporal pole and left parahippocampal gyrus compared with the AD and fvFTD groups. There were no differences between the groups for hippocampal atrophy with the exception that the semantic dementia group had significantly more left hippocampal atrophy compared with the AD group. The semantic dementia group was significantly more atrophied in all regions, except the right hippocampus compared with the AD group. There were no significant differences between the AD and fvFTD group.
Proportion of cases in each group with moderate to severe atrophy (above grade 2)

Percentage of patients with minimal atrophy. Tp=Temporal pole; Hi=hippocampus; Phg=parahippocampal gyrus; LTL=lateral temporal lobe; L=left; R=right.
Discussion
Our study is the first to provide systematic assessment and quantification of the pattern of temporal lobe atrophy on MRI in semantic dementia and to compare semantic dementia with AD. Contrary to prior reports, based on clinical assessment of MRI,22 36we have shown significant hippocampal atrophy in semantic dementia, which was in fact greater than that seen in AD, and also confirmed medial temporal involvement in fvFTD.14 The three disorders cannot, therefore, be distinguished in terms of hippocampal involvement. Although the other components of the temporal lobe were spared in AD, patients with semantic dementia had profound atrophy of the temporal pole, medial, and lateral temporal gyri. Thus semantic dementia is distinguishable from AD by the gross atrophy of the polar and inferolateral temporal areas. The semantic dementia group can be distinguished from the fvFTD group by the severe polar atrophy.
We have additionally developed a quicker and more widely applicable visual rating scale of MR images which incorporates assessment of the hippocampus, parahippocampal gyrus, temporal pole, and lateral cortex. After initial piloting of more complex schedules, we selected a simple method which uses a four point scale. When scores on this scale were dichotomised into normal (0–1) versus affected (2 or above), very good interrater reliability was achieved for all four brain regions. After training, a rater can perform this assessment in less than 5 minutes. This scale correlates well with the time consuming volumetric measures, thus providing a quick and accurate assessment of the temporal lobe structures.
Our study confirms the already well established finding of significant hippocampal atrophy in AD and highlights the overlap between controls and patients with relatively early stage disease: only 50% of our patients with AD had moderate to severe hippocampal atrophy on the visual scale. Using the same hippocampal scale, Scheltenset al 3 found atrophy in 81% of patients with AD but this higher prevalence may reflect the greater disease severity in their group (mean mini mental state examination (MMSE) score 14.9). Similarly, O'Brien et al 5 found that 93% of 43 patients with probable or possible AD had anterior hippocampal atrophy on a summated score of both left and right hippocampi (mean MMSE 25.9). Using a different rating protocol based on axial images, DeLeon et al 6 examined hippocampal atrophy in a large group of patients including 73 patients with mild AD, 130 patients with moderate to severe AD, and 72 patients with minimal cognitive impairment (with a cut off MMSE score of 23 or above): 78% of their minimally impaired group had hippocampal atrophy, 84% of the mild group, and 96% of the patients with moderate to severe AD. Frisoniet al 14 examined the hippocampus and entorhinal cortex with volumetric analysis in 12 patients with FTD and compared this with a larger AD group. The FTD group had equivalent entorhinal atrophy but less hippocampal atrophy than their AD group; however, the AD group was older than our group with a lower mean MMSE score (20±4). It seems very likely, therefore, that the difference between our study and others reflects primarily or entirely the relative stages of disease progression. Surprisingly, there was no evidence of parahippocampal atrophy in our AD group. This is contrary to pathological reports of early entorhinal cortex involvement in AD, with subsequent spread to the hippocampus proper.37 38 This is due to the fact that the medial temporal lobe measure, being based on the width of the collateral sulcus, is principally an estimate of perirhinal, rather than entorhinal atrophy. The widespread use of MRI techniques in establishing an early diagnosis of AD depends on accurate differentiation from other dementias; our study suggests that hippocampal atrophy is not specific for AD in early disease.
The most unexpected finding of the study was the demonstration that the semantic dementia group had hippocampal atrophy that was at least equivalent to that found in the patients with AD. The proportion of patients with left sided atrophy was higher in the patients with semantic dementia than in the patients with AD. Combined with the finding of hippocampal atrophy in the patients with fvFTD, our results show, therefore, that hippocampal atrophy is not disease or syndrome specific. The finding of pathological changes postmortem involving the medial temporal lobe in some cases of FTD is well established,15 39 although it should be noted that one quantitative analysis showed no hippocampal pathology in a pathologically confirmed case of semantic dementia.40 Our findings clearly show that hippocampal atrophy is present in most cases but with greater involvement of the left side. The remaining temporal lobe structures have been assessed very rarely in AD and not at all in semantic dementia. Our hypothesis that the polar and inferolateral temporal regions would be atrophied in the semantic dementia group, but not in AD, was upheld. Although neuroimaging was not used to classify the patients in this study, the relation between the neuropsychological profiles and patterns of imaging abnormalities is of considerable interest and is currently under investigation in our group.
Conclusions
We have shown that although hippocampal atrophy is not specific for AD, patients with AD or semantic dementia can be distinguished by severe global temporal atrophy seen in semantic dementia. Patients with fvFTD present a more mixed pattern of temporal lobe atrophy including the hippocampus. The data suggest that the visual rating scale may prove a quick and valuable method of assessing temporal lobe atrophy for diagnostic purposes.
Acknowledgments
We thank Rachel Swainson and Sharon Erzinclioglu, Guy Williams, Leslie Hurn, and Ilse Joubert for MRI support, and Peter Watson for statistical advice. The research and CJG were funded by an MRC LINK grant to BJS, JRH, Professor Trevor Robbins, and Dr James Semple, and an MRC programme grant to JRH.